


The known: Data on the rate and risk of stroke and cardiovascular mortality in Aboriginal Australians with atrial fibrillation are limited.
The new: The incidence of stroke in Aboriginal Australians under 60 hospitalised with AF was three times as high as for non‐Aboriginal patients, and that of fatal stroke almost six times as high. The greater risks are associated with the higher prevalence of cardiovascular disease and vascular risk factors among younger Aboriginal Australians.
The implications: Data on the use of oral anticoagulants and better management of cardiovascular risk factors are vital for reducing the stroke burden in Aboriginal patients with atrial fibrillation.
The global burden of atrial fibrillation (AF), a common cardiac condition, is growing.1 Because the prevalence of AF increases with age, population ageing has contributed to the increase in burden in many developed countries. Its prevalence is higher among indigenous than non‐indigenous people in several countries;2 the reported prevalence in central Australian Indigenous communities is 2.5%.3 For Aboriginal Australians under 55 years of age, the incidence rate of AF is four to six times that for non‐Aboriginal people of the same age.4
Complex social and historical factors contribute to health disparities between Aboriginal people and other Australians. Earlier onset of cardiovascular disease5 and higher levels of chronic diseases and health risk factors contribute to these differences,6 as does the greater risk of stroke.7 Stroke and cardiovascular mortality are frequent complications of AF,8 but data on the risks in Aboriginal patients with AF are limited. Oral anticoagulant therapy may be underprescribed for these patients, particularly for those at high risk of stroke.9
Quantifying the risks of stroke and cardiovascular mortality associated with AF in Aboriginal people is vital for assessing the clinical benefit of optimal therapy. The primary aim of our study was to compare the long term risk of stroke after hospitalisation with AF for Aboriginal and non‐Aboriginal people in Western Australia. Our secondary aim was to compare the risks of stroke subtypes and cardiovascular mortality in Aboriginal and non‐Aboriginal people after hospitalisation with AF.
Methods
Study setting and data sources
The population of Western Australia in 2013 was about 2.5 million, of whom nearly 4% identified as Aboriginal people, compared with 3% of all Australians who identified as Aboriginal or Torres Strait Islander Australians.10,11 In WA, 40% of Aboriginal people reside in remote or very remote areas, but only 6% of non‐Aboriginal people.12 In our retrospective cohort study we analysed linked health data (using probabilistic matching) from the WA Hospital Morbidity Data Collection and the WA Deaths Registry. The study dataset included all hospitalisations for AF in WA during 1990–2012, and all linked hospital and death records for the relevant patients. Selected patient demographic details, Aboriginal status, principal and twenty additional discharge diagnosis fields, inpatient procedures, date of death, and underlying and multiple‐coded cause of death were included in our analyses.
Cohort selection
We identified all hospitalisations in WA between 1 January 2000 and 31 December 2012 for which AF (International Classification of Diseases, tenth revision, Australian modification [ICD‐10‐AM] code I48) was recorded in the principal or additional discharge diagnosis fields. The diagnosis of AF had previously been validated in a small randomly selected sample, with a high positive predictive value based upon medical chart review.13 The first AF admission during the study period (index event) for patients aged 20–84 years who survived more than 28 days from admission was included in the analysis. We excluded 1882 patients who had mechanical heart valves (ICD codes: Supporting Information, table 1).
Outcomes
The outcome event date was defined as the date of hospital admission or date of death. Follow‐up data for all patients, including coded cause of death, were available until 30 November 2013. Follow‐up was censored at the date of the outcome event, 10 years after the index AF event, or 30 November 2013, whichever was earliest. Patients were followed up for between 28 days and 10 years from their index AF admission date.
Hospitalisations for stroke (ICD‐10‐AM codes I60–I64, H34.1) were identified in any discharge diagnosis field, and stroke deaths (ICD‐10‐AM codes I60–I69) in the underlying or multiple‐code cause of death fields. The primary outcome was all stroke (stroke hospitalisation or stroke death). We defined non‐fatal stroke as a stroke hospitalisation with survival longer than 28 days from admission; fatal strokes were any stroke death, irrespective of hospitalisation, or death from any cause within 28 days of hospitalisation for stroke. We also identified ischaemic strokes (first ischaemic stroke hospitalisation or death; ICD‐10‐AM codes I63, I64) and haemorrhagic strokes (first haemorrhagic stroke hospitalisation or death; ICD‐10‐AM codes I60–I62); 167 patients (more than 95% of whom were non‐Aboriginal patients) had an ischaemic and haemorrhagic stroke and were included in both subtype analyses. Cardiovascular mortality (ICD‐10‐AM codes I00–I99) was identified from the underlying or associated causes of death.
Covariates
We used the “Getting our story right” algorithm to ascertain Aboriginal identity on the basis of data from multiple health datasets.14 Comorbid conditions were identified from any diagnosis field in the 10 years of hospitalisation history preceding and including the index hospitalisation for AF, and included prior AF admission, stroke or transient ischaemic attack, coronary heart disease, myocardial infarction, valvular heart disease, chronic obstructive pulmonary disease, diabetes, and chronic kidney disease (Supporting Information, table 1). Charlson Comorbidity Index and CHA2DS2‐VASc (stroke risk factors: congestive heart failure, hypertension, age ≥ 75 years, diabetes mellitus, stroke/transient ischemic attack, vascular disease, age 65–74 years, sex) scores were calculated for each patient, based upon 10 years of hospitalisation history preceding and including the index AF admission (Supporting Information, table 1).15 CHA2DS2‐VASc scores of 2 or more indicate moderate to high risk of stroke, for which anticoagulant therapy would generally be appropriate.
Patient remoteness was based on residential address according to the Accessibility/Remoteness Index of Australia;16 socio‐economic status was categorised according to the Index of Relative Socio‐economic Disadvantage (in quintiles).17
Statistical analysis
The cohort was stratified by Aboriginal status and age group (20–59, 60–84 years). We did not include patients over 84 years of age because of their very low number. Patient characteristics were analysed by univariate logistic regression, χ2 tests, and Wilcoxon signed rank tests for binary, categorical, and continuous variables respectively.
Incidence rates were calculated for all outcomes, presented as number per 1000 person‐years with 95% confidence intervals (CIs). Unadjusted risks of all stroke, cardiovascular disease and all‐cause mortality were estimated by Kaplan–Meier survival analysis. Hazard ratios (with 95% CIs) comparing rates for Aboriginal and non‐Aboriginal patients were calculated in Cox proportional hazard models. We undertook a multivariable analysis with progressive adjustment for age (continuous) and sex, remoteness and health insurance status, principal diagnosis of AF, CHA2DS2‐VASc, history of valvular heart disease, chronic kidney disease or chronic obstructive pulmonary disease, and admission year. Assumptions of the Cox proportional hazard models were checked by assessing Schoenfeld and scaled Schoenfeld residuals; no violations were found. Because of the low event numbers, models for haemorrhagic stroke are not presented separately. P < 0.05 was deemed statistically significant. All analyses were undertaken in Stata/MP 15.1.
Ethics approval
Ethics approval was obtained from the University of Western Australia Human Research Ethics Committee (reference, RA/4/1/5227), the WA Aboriginal Health Research Ethics Committee (reference, 381‐01/2011), and the WA Department of Health Human Research Ethics Committee (reference, 2011/89).
Results
During 2000–2012, there were 55 482 index AF hospitalisations of patients aged 20–84 years in WA; 1406 patients (2.5%) were Aboriginal people (825 20–59‐year‐old patients [7.7% of patients in this age group], 581 60–84‐year‐old patients [1.3%]). Overall, 599 Aboriginal patients (43%) and 21 908 non‐Aboriginal patients (40%) were women; among 20–59‐year‐old patients, 321 Aboriginal patients (39%) and 2639 non‐Aboriginal patients (27%) were women. The mean age of Aboriginal patients was 56.6 years (standard deviation [SD], 13.4 years), of non‐Aboriginal patients 69.9 years (SD, 11.7 years); the mean ages of Aboriginal patients in each age group were also lower than for non‐Aboriginal patients. More than half the Aboriginal patients resided in remote or very remote locations, and in areas in the two lowest socio‐economic status quintiles (Box 1).
The prevalence of major comorbid conditions was higher among Aboriginal than non‐Aboriginal patients, and the differences were greater in patients aged 20–59 years (Box 1). The proportion of 20–59‐year‐old Aboriginal patients with CHA2DS2‐VASc scores of 2 or more (493, 60%) was greater than for non‐Aboriginal patients (2151, 22%); among those aged 60–84 years, 507 Aboriginal patients (87%) and 37 026 non‐Aboriginal patients (84%) had CHA2DS2‐VASc scores of 2 or more.
The median follow‐up time for 20–59‐year‐old patients was 7.1 years (interquartile range [IQR], 3.8–10 years) for Aboriginal and 6.8 years (IQR, 3.7–10 years) for non‐Aboriginal patients; for 60–84‐year‐old patients, median follow‐up was respectively 7.2 years (IQR, 3.7–10 years) and 7.5 years (IQR, 4.1–10 years).
A total of 19 883 patients (35.8%) died during follow‐up: 573 Aboriginal patients (40.8% of Aboriginal patients) and 19 310 non‐Aboriginal patients (35.7%). The mean time from index AF admission to death was 2.9 years (SD, 2.6 years) for Aboriginal and 3.3 years (SD, 2.7 years) for non‐Aboriginal patients. Cardiovascular disease was recorded as an underlying or associated cause of death for 14 453 deaths (439 Aboriginal patients [76.6%]; 14 014 non‐Aboriginal patients [72.6%]) (Box 2). Coronary heart disease was the most frequent cardiovascular underlying cause of death (102 Aboriginal patients [17.8% of deaths]; 3978 non‐Aboriginal patients [20.6%]). Stroke was recorded as the underlying cause of death for 28 Aboriginal patients (4.9% of deaths) and 1448 non‐Aboriginal patients (7.5% of deaths). The most frequent non‐cardiovascular underlying cause of death was cancer (96 Aboriginal patients [16.7% of deaths]; 4943 non‐Aboriginal patients [25.6%]).
Stroke and mortality risk
A total of 6229 patients had strokes during follow‐up (179 Aboriginal patients [12.7% of patients]; 6050 non‐Aboriginal patients [11.2%]) (Box 2). The unadjusted 10‐year risks of stroke and cardiovascular mortality (Box 3) and of all‐cause mortality (Supporting Information, figure 1) were significantly greater for Aboriginal than non‐Aboriginal patients (log‐rank P < 0.001), with larger differences in the 20–59 years age group.
The overall incidence of stroke in the cohort was 23.0 events (95% CI, 22.4–23.6 events) per 1000 person‐years. In the 20–59 years age group, the incidence of all stroke was significantly higher for Aboriginal than non‐Aboriginal patients (incidence rate ratio [IRR], 3.2; 95% CI, 2.5–4.1), as was that of non‐fatal stroke (IRR, 2.6; 95% CI, 1.8–3.4) (Box 2). The greatest differences in this age group were for fatal (IRR, 5.7; 95% CI, 3.9–8.9) and haemorrhagic stroke (IRR, 4.1; 95% CI, 1.9–6.4). In the 60–84 years age group, incidence of all outcomes (except haemorrhagic stroke) was higher for Aboriginal than non‐Aboriginal patients, but the differences were smaller than for the 20–59 years age group, and were similar for all outcomes.
Multivariable‐adjusted risks
After full multivariable adjustment, the hazard of all stroke was significantly greater for Aboriginal than non‐Aboriginal patients (20–59‐year‐old patients: adjusted hazard ratio [aHR], 1.67; 95% CI, 1.22–2.28; 60–84‐year‐old patients: aHR, 1.64; 95% CI, 1.32–2.03); the HRs for non‐fatal and fatal stroke were similar. The adjusted hazard for cardiovascular mortality was significantly greater for 20–59‐year‐old (aHR, 1.47; 95% CI, 1.18–1.83) and 60–84‐year‐old Aboriginal people (aHR, 1.45; 95% CI, 1.26–1.67) than for non‐Aboriginal patients (Box 4; Supporting Information, table 2).
Progressive adjustment of the Cox models indicated that adjusting for age and sex, AF as principal diagnosis, and CHA2DS2‐VASc score had the greatest impact on aHRs for stroke rates and cardiovascular mortality (Supporting Information, table 2). Adjusting for valvular heart disease, chronic kidney disease, and chronic obstructive pulmonary disease had smaller effects on stroke hazard ratios for either age group.
Discussion
Our whole population cohort study, including more than 55 000 people hospitalised with AF, found marked differences in the risks of stroke and cardiovascular death for Aboriginal and non‐Aboriginal Australians, especially among patients under 60 years of age. The relative risks of fatal and haemorrhagic stroke were particularly high for Aboriginal patients in this age group. These differences in risk were largely related to the higher prevalence of prior cardiovascular disease and vascular risk factors among Aboriginal patients under 60.
Differences in stroke and cardiovascular mortality risks
AF is an independent risk factor for ischaemic stroke.8 While the risk of stroke after AF is higher for many indigenous peoples,2 comparative data on stroke incidence are limited. The risk of stroke (based on CHA2DS2‐VASc scores) is reported to be twice as high in New Zealand for Māori and Pacific patients under 65 with AF18 as for non‐Māori/non‐Pacific patients. We found that the incidence of stroke (and its subtypes) was higher among Aboriginal than non‐Aboriginal patients with AF, particularly among patients under 60 years of age. The higher incidence of AF in Aboriginal than in non‐Aboriginal people4 may contribute to the higher incidence of stroke in Aboriginal Australians.7,19
The general prognosis for indigenous people with AF is poor, although long term follow‐up data are limited. All‐cause mortality at one year among indigenous patients in WA and Canada was 1.5–2 times as high as for non‐indigenous patients.4,20 We found that the difference in all‐cause mortality after AF hospitalisation increases over 10 years, and that most of the difference is associated with cardiovascular causes of death, which in our study accounted for about three‐quarters of the mortality burden, consistent with the findings of other population‐based studies of patients with AF.8,21
Reasons for the differences in risk
Cardiovascular risk factor levels and the prevalence of comorbidity are higher among Aboriginal people than other Australians,22 and the differences are greater in people with AF.4 In our study, the predicted stroke risk was medium‐high (CHA2DS2‐VASc score of at least 2) for about 70% of Aboriginal patients. We found that adjusting for vascular risk factors markedly reduced differences in stroke and cardiovascular mortality risks between Aboriginal and non‐Aboriginal people. The higher prevalence of valvular heart disease in Aboriginal people under 60 is probably related to their markedly higher prevalence of rheumatic heart disease.23 Recent WA data also indicate that multimorbidity was twice as prevalent among Aboriginal people than non‐Aboriginal patients with atherothrombotic disease (79% v 39%).24
Oral anticoagulants reduce the risk of ischaemic stroke and all‐cause mortality despite the increased risk of major bleeding,25 but data on their use by Aboriginal Australians are limited. One study found that more than 70% of Aboriginal patients with AF and CHA2DS2‐VASc scores of 2 or more were not receiving oral anticoagulants.9 Warfarin was the main oral anticoagulant available during our study period, but adequate monitoring of patients’ international normalised ratio (INR) in rural and remote communities is difficult because of remoteness, limitations in service availability and culturally appropriate referral pathways,26 and family caring responsibilities. Recent Australian guidelines recommend novel oral anticoagulants (NOACs) for Aboriginal people with non‐valvular AF because they overcome many of the logistic and clinical barriers associated with warfarin.27 The higher incidence of haemorrhagic stroke in Aboriginal adults under 60 also indicates that NOACs may be safer options than warfarin, although factors such as poor blood pressure control must be taken into account.
Limitations
We were unable to identify paroxysmal, persistent or chronic AF, or atrial flutter, as ICD coding did not differentiate these subtypes during our study period. However, current clinical guidelines recommend treatment based on stroke risk factors rather than AF type.27 Our upper age limit of 84 years (fewer than 0.05% of Aboriginal patients were over 84 years of age) may have led to our underestimating the absolute risk of stroke, but our age group‐based analyses ensured that the reported relative risks of stroke are valid. Some misclassification of ischaemic and haemorrhagic stroke is probable, as we relied on ICD codes for stroke type. The small number of haemorrhagic strokes precluded robust conclusions about this stroke type.
Medications data were not available in the analysed dataset, so we could not assess the effect of oral anticoagulant therapy on stroke incidence. CHA2DS2‐VASc scores have not been specifically validated in an Aboriginal Australian population.
Conclusions
The incidence of stroke and cardiovascular mortality are higher among Aboriginal than non‐Aboriginal people with AF, and the difference increases with time from hospitalisation, despite evidence of the effectiveness of oral anticoagulants for reducing thrombo‐embolic stroke risk. The availability of NOACs provides an opportunity for reducing the risk of stroke for Aboriginal people with AF. Increased screening for cardiovascular disease risk factors and AF in primary care, incorporating new models of care that take cultural factors into account, could improve primary and secondary prevention for Aboriginal people.
Box 1 – Characteristics of patients admitted to Western Australian hospitals with a diagnosis of atrial fibrillation during 2000–2012, by age group and Aboriginal status
|
|
20–59 years |
60–84 years |
|||||||||||||
|
Aboriginal |
Non‐Aboriginal |
P |
Aboriginal |
Non‐Aboriginal |
P |
||||||||||
|
|
|||||||||||||||
|
Number of patients |
825 |
9862 |
|
581 |
44 214 |
|
|||||||||
|
Sex (women) |
321 (38.9%) |
2639 (26.8%) |
< 0.001 |
278 (47.9%) |
19 269 (43.6%) |
0.040 |
|||||||||
|
Age (years), mean (SD) |
47.6 (9.1) |
50.3 (8.8) |
< 0.001 |
69.3 (6.3) |
74.2 (6.8) |
< 0.001 |
|||||||||
|
Emergency admission |
708 (85.8%) |
6588 (66.8%) |
< 0.001 |
491 (84.5%) |
28 838 (65.2%) |
< 0.001 |
|||||||||
|
Principal diagnosis |
|
|
|
|
|
|
|||||||||
|
Atrial fibrillation |
258 (31.3%) |
5645 (57.2%) |
< 0.001 |
130 (22.4%) |
13 833 (31.3%) |
< 0.001 |
|||||||||
|
Stroke |
18 (2.2%) |
133 (1.4%) |
0.05 |
23 (4.0%) |
1514 (3.4%) |
0.48 |
|||||||||
|
Myocardial infarction |
85 (10%) |
661 (6.7%) |
< 0.001 |
78 (13%) |
4509 (10.2%) |
0.011 |
|||||||||
|
Heart failure |
58 (7.0%) |
230 (2.3%) |
< 0.001 |
43 (7.4%) |
2180 (4.9%) |
0.007 |
|||||||||
|
Chronic obstructive pulmonary disease |
16 (1.9%) |
67 (0.7%) |
< 0.001 |
24 (4.1%) |
1154 (2.6%) |
0.024 |
|||||||||
|
Chronic kidney disease |
18 (2.2%) |
33 (0.3%) |
< 0.001 |
7 (1.2%) |
174 (0.4%) |
0.004 |
|||||||||
|
Diabetes |
14 (1.7%) |
48 (0.5%) |
< 0.001 |
13 (2.2%) |
341 (0.8%) |
< 0.001 |
|||||||||
|
Comorbid conditions* |
|
|
|
|
|
|
|||||||||
|
Prior atrial fibrillation |
64 (7.8%) |
714 (7.2%) |
0.58 |
76 (13%) |
5674 (12.8%) |
0.86 |
|||||||||
|
Prior stroke/transient ischaemic attack |
57 (6.9%) |
330 (3.4%) |
< 0.001 |
74 (13%) |
4289 (9.7%) |
0.015 |
|||||||||
|
Coronary heart disease |
297 (36.0%) |
1777 (18.0%) |
< 0.001 |
275 (47.3%) |
17 083 (38.6%) |
< 0.001 |
|||||||||
|
Hypertension |
466 (56.5%) |
2308 (23.4%) |
< 0.001 |
396 (68.2%) |
22 770 (51.5%) |
< 0.001 |
|||||||||
|
Heart failure |
288 (34.9%) |
1101 (11.2%) |
< 0.001 |
247 (42.5%) |
10 876 (24.6%) |
< 0.001 |
|||||||||
|
Valvular heart disease |
124 (15.0%) |
717 (7.3%) |
< 0.001 |
70 (12%) |
5457 (12.3%) |
0.83 |
|||||||||
|
Peripheral artery disease |
37 (4.5%) |
282 (2.9%) |
0.009 |
41 (7.1%) |
4711 (10.7%) |
0.006 |
|||||||||
|
Chronic obstructive pulmonary disease |
199 (24.1%) |
1426 (14.5%) |
< 0.001 |
153 (26.3%) |
7725 (17.5%) |
< 0.001 |
|||||||||
|
Chronic kidney disease |
257 (31.2%) |
543 (5.5%) |
< 0.001 |
181 (31.2%) |
5969 (13.5%) |
< 0.001 |
|||||||||
|
Diabetes |
412 (49.9%) |
1019 (10.3%) |
< 0.001 |
349 (60.1%) |
9167 (20.7%) |
< 0.001 |
|||||||||
|
Alcohol and illicit drugs |
369 (44.7%) |
863 (8.8%) |
< 0.001 |
105 (18.1%) |
1580 (3.6%) |
< 0.001 |
|||||||||
|
CHA2DS2‐VASc score |
|
|
|
|
|
< 0.001 |
|||||||||
|
0 |
132 (16.0%) |
4575 (46.4%) |
< 0.001 |
26 (4.5%) |
1703 (3.9%) |
|
|||||||||
|
1 |
200 (24.2%) |
3136 (31.8%) |
|
48 (8.3%) |
5485 (12.4%) |
|
|||||||||
|
2–3 |
354 (42.9%) |
1770 (18.0%) |
|
223 (38.4%) |
19 048 (43.1%) |
||||||||||
|
4–5 |
103 (12.5%) |
331 (3.4%) |
|
191 (32.9%) |
12 375 (28.0%) |
||||||||||
|
> 5 |
36 (4.4%) |
50 (0.5%) |
|
93 (16%) |
5603 (12.7%) |
|
|||||||||
|
Charlson Comorbidity Index score |
|
|
|
|
|
< 0.001 |
|||||||||
|
0 |
181 (21.9%) |
5963 (60.5%) |
< 0.001 |
66 (11%) |
13 098 (29.6%) |
|
|||||||||
|
1–2 |
239 (29.0%) |
2593 (26.3%) |
|
150 (25.8%) |
15 211 (34.4%) |
|
|||||||||
|
3–4 |
156 (18.9%) |
700 (7.1%) |
|
146 (25.1%) |
8280 (18.7%) |
|
|||||||||
|
> 4 |
249 (30.2%) |
606 (6.1%) |
|
219 (37.7%) |
7625 (17.3%) |
|
|||||||||
|
Length of stay (days), median (IQR) |
6 (3–12) |
2 (1–7) |
< 0.001 |
8 (4–17) |
7 (2–15) |
< 0.001 |
|||||||||
|
Metropolitan/rural residence3 |
|
|
< 0.001 |
|
|
< 0.001 |
|||||||||
|
Highly accessible/metropolitan |
214 (27.0%) |
7099 (75.3%) |
|
162 (28.9%) |
34 442 (80.4%) |
|
|||||||||
|
Moderately accessible |
157 (19.8%) |
1808 (19.2%) |
|
111 (19.8%) |
7527 (17.6%) |
|
|||||||||
|
Remote/very remote |
421 (53.2%) |
524 (5.6%) |
|
288 (51.3%) |
872 (2.0%) |
|
|||||||||
|
Index of Relative Socio‐economic Disadvantage |
|
< 0.001 |
|
|
< 0.001 |
||||||||||
|
1st quintile |
328 (39.8%) |
1297 (13.1%) |
|
228 (39.2%) |
7105 (16.1%) |
|
|||||||||
|
2nd quintile |
101 (12.2%) |
1389 (14.1%) |
|
68 (12%) |
6616 (15.0%) |
|
|||||||||
|
3rd quintile |
60 (7.3%) |
1395 (14.1%) |
|
26 (4.5%) |
5576 (12.6%) |
|
|||||||||
|
4th quintile |
18 (2.2%) |
1306 (13.2%) |
|
14 (2.4%) |
4825 (10.9%) |
|
|||||||||
|
5th quintile |
8 (1%) |
1432 (14.5%) |
|
12 (2.1%) |
4788 (10.8%) |
|
|||||||||
|
Missing data |
310 (37.6%) |
3045 (30.9%) |
|
233 (40.1%) |
15 304 (34.6%) |
|
|||||||||
|
Private health insurance |
24 (2.9%) |
4200 (42.6%) |
< 0.001 |
31 (5.3%) |
17 373 (39.3%) |
< 0.001 |
|||||||||
|
|
|||||||||||||||
|
IQR = interquartile range; SD = standard deviation. * Comorbid conditions identified from hospitalisation data: fixed lookback period of 10 years for each patient. |
|||||||||||||||
Box 2 – Incidence rates of stroke and mortality during the ten years following hospitalisation for atrial fibrillation, by Aboriginal status and age group
|
|
Aboriginal |
Non‐Aboriginal |
Incidence rate ratio (95% CI) |
||||||||||||
|
Number of patients |
Incidence per 1000 |
Number of patients |
Incidence per 1000 |
||||||||||||
|
|
|||||||||||||||
|
20–59 years old |
825 |
|
9862 |
|
|
||||||||||
|
All stroke |
80 (9.7%) |
20 (16–25) |
366 (3.7%) |
6.2 (5.6–6.9) |
3.2 (2.5–4.1) |
||||||||||
|
Non‐fatal stroke |
51 |
13 (9.7–17) |
296 |
5.0 (4.5–5.6) |
2.6 (1.8–3.4) |
||||||||||
|
Fatal stroke |
36 |
8.6 (6.2–12) |
87 |
1.5 (1.2–1.8) |
5.7 (3.9–8.9) |
||||||||||
|
Ischaemic stroke |
50 |
12 (9.4–16) |
271 |
4.6 (4.1–5.2) |
2.7 (2.0–3.7) |
||||||||||
|
Haemorrhagic stroke |
24 |
5.8 (3.9–8.7) |
84 |
1.4 (1.2–1.8) |
4.1 (1.9–6.4) |
||||||||||
|
Cardiovascular mortality |
206 (31.5%) |
49.1 (43.1–56.7) |
586 (5.9%) |
9.8 (9.0–10.6) |
4.4 (4.3–5.9) |
||||||||||
|
All‐cause mortality |
275 (33.3%) |
66.0 (58.6–74.3) |
980 (9.9%) |
16.4 (15.4–17.4) |
4.0 (3.5–4.6) |
||||||||||
|
60–84 years old |
581 |
|
44 214 |
|
|
||||||||||
|
All stroke |
99 (17%) |
45 (37–54) |
5684 (12.9%) |
27.6 (26.9–28.3) |
1.6 (1.3–2.0) |
||||||||||
|
Non‐fatal stroke |
54 |
24 (19–32) |
3175 |
15.4 (14.9–16.0) |
1.6 (1.2–2.1) |
||||||||||
|
Fatal stroke |
58 |
25 (19–32) |
3415 |
16.0 (15.4–16.5) |
1.5 (1.2–2.0) |
||||||||||
|
Ischaemic stroke |
84 |
38 (30–47) |
4335 |
20.9 (20.3–21.5) |
1.8 (1.4–2.2) |
||||||||||
|
Haemorrhagic stroke |
5 |
2 (0.9–5) |
942 |
4.4 (4.2–4.7) |
0.5 (0.2–1.1) |
||||||||||
|
Cardiovascular mortality |
233 (40.1%) |
99.4 (87.4–113) |
13 428 (30.4%) |
62.8 (61.7–63.8) |
1.6 (1.4–1.8) |
||||||||||
|
All‐cause mortality |
298 (51.3%) |
127.1 (113–142) |
18 330 (41.5%) |
85.7 (84.4–86.9) |
1.5 (1.3–1.7) |
||||||||||
|
|
|||||||||||||||
|
CI = confidence interval. |
|||||||||||||||
Box 3 – Kaplan–Meier survival curves for all stroke and cardiovascular mortality in patients hospitalised with atrial fibrillation, by Aboriginal status and age group*
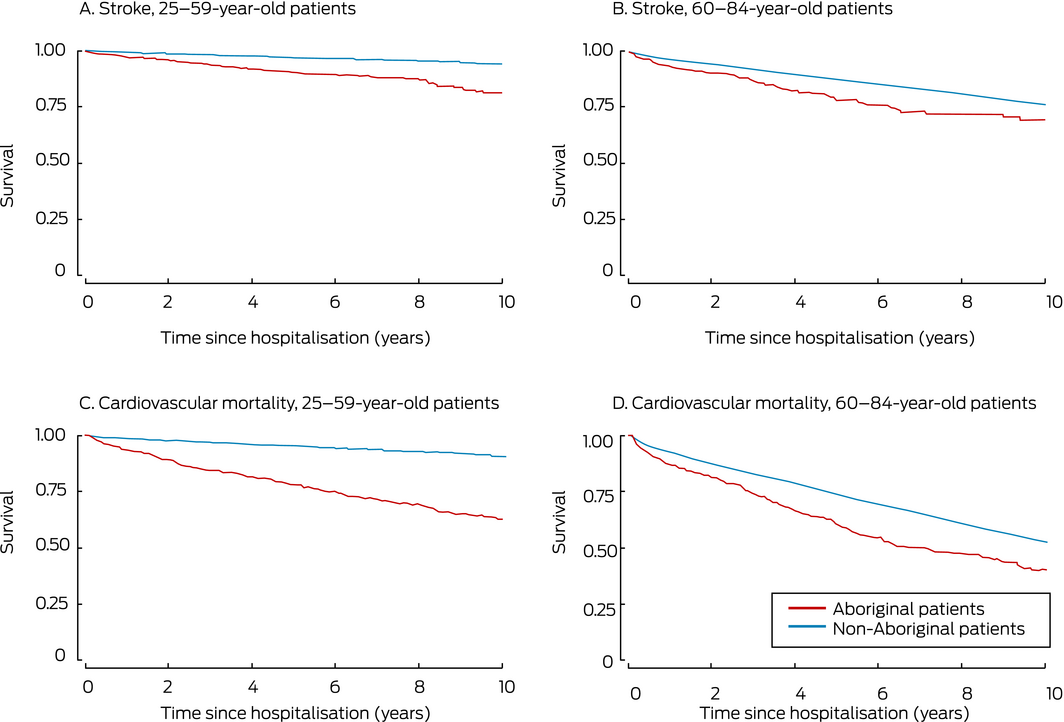
* For all analyses: log‐rank P < 0.001.
Box 4 – Unadjusted and multivariable‐adjusted hazard ratios for stroke and mortality following hospitalisation for atrial fibrillation, Aboriginal v non‐Aboriginal patients*
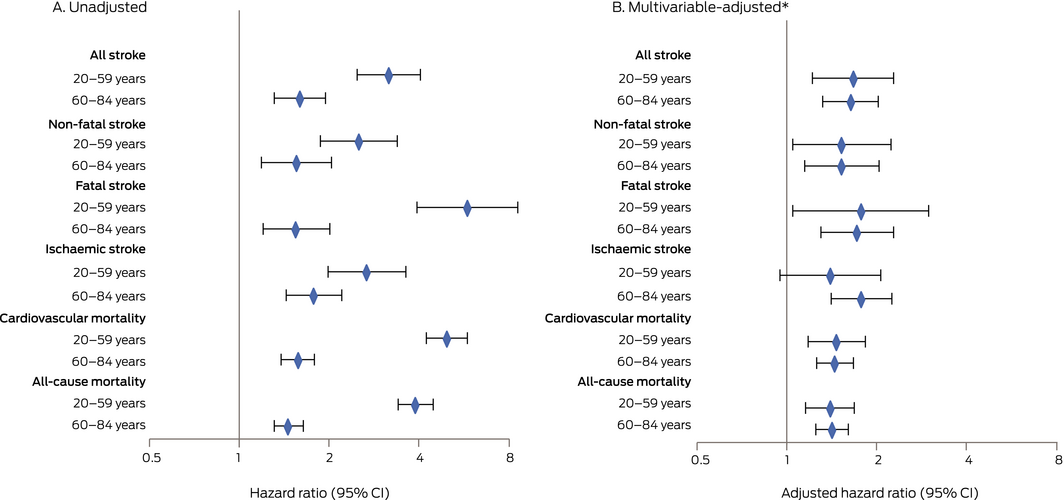
* Multivariable hazard ratios were adjusted for age/sex, remoteness, insurance, principal diagnosis, CHA2DS2‐VASc score, valvular heart disease/chronic kidney disease/chronic obstructive pulmonary disease, alcohol/illicit drug use, and admission year.
Received 20 August 2019, accepted 2 December 2019
- Lee Nedkoff1
- Erin A Kelty1
- Joseph Hung1
- Sandra C Thompson2
- Judith M Katzenellenbogen1,3
- 1 University of Western Australia, Perth, WA
- 2 Western Australia Centre for Rural Health, University of Western Australia, Geraldton, WA
- 3 Telethon Kids Institute, Perth, WA
Our investigation was supported by a National Health and Medical Research Council (NHMRC) grant (1031057). Lee Nedkoff is supported by an NHMRC Early Career Fellowship, Judith Katzenellenbogen by a Heart Foundation Future Leader Fellowship. Data were provided by the Western Australian Data Linkage Branch, the WA Department of Health Inpatient Data Collections and Registrar General, state and territory registries of births, deaths and marriages, state and territory coroners, and the National Coronial Information System.
No relevant disclosures.
- 1. Chugh SS, Havmoeller R, Narayanan K, et al. Worldwide epidemiology of atrial fibrillation: a Global Burden of Disease 2010 study. Circulation 2014; 129: 837–847.
- 2. Katzenellenbogen JM, Woods JA, Teng TH, Thompson SC. Atrial fibrillation in the indigenous populations of Australia, Canada, New Zealand, and the United States: a systematic scoping review. BMC Cardiovasc Disord 2015; 15: 87.
- 3. Krum H, Carrington MJ, Stewart S, et al. Heart failure, ventricular dysfunction and risk factor prevalence in Australian Aboriginal peoples: the Heart of the Heart Study. Heart 2012; 98: 1562–1567.
- 4. Katzenellenbogen JM, Teng TH, Lopez D, et al. Initial hospitalisation for atrial fibrillation in Aboriginal and non‐Aboriginal populations in Western Australia. Heart 2015; 101: 712–719.
- 5. Australian Institute of Health and Welfare. The health and welfare of Australia's Aboriginal and Torres Strait Islander peoples: 2015 (Cat no. IHW 147). Canberra: AIHW, 2015.
- 6. McDermott RA, McCulloch B, Li M. Glycaemia and albuminuria as predictors of coronary heart disease in Aboriginal and Torres Strait Islander adults: a north Queensland cohort. Med J Aust 2011; 194: 514–518. https://www.mja.com.au/journal/2011/194/10/glycaemia-and-albuminuria-predictors-coronary-heart-disease-aboriginal-and
- 7. Balabanski AH, Newbury J, Leyden JM, et al. Excess stroke incidence in young Aboriginal people in South Australia: pooled results from two population‐based studies. Int J Stroke 2018; 13: 811–814.
- 8. Odutayo A, Wong CX, Hsiao AJ, et al. Atrial fibrillation and risks of cardiovascular disease, renal disease, and death: systematic review and meta‐analysis. BMJ 2016; 354: i4482.
- 9. Wong CX, Lee SW, Gan SW, et al. Underuse and overuse of anticoagulation for atrial fibrillation: a study in Indigenous and non‐Indigenous Australians. Int J Cardiol 2015; 191: 20–24.
- 10. Australian Bureau of Statistics. 3101.0. Australian demographic statistics, Dec 2013. June 2014. http://www.abs.gov.au/AUSSTATS/abs@.nsf/Lookup/3101.0Main+Features1Dec%202013?OpenDocument (viewed Nov 2019).
- 11. Australian Bureau of Statistics. 3238.0. Estimates and projections, Aboriginal and Torres Strait Islander Australians, 2001 to 2026. Apr 2014. http://www.abs.gov.au/ausstats/abs@.nsf/Products/C19A0C6E4794A3FACA257CC900143A3D?opendocument (viewed Nov 2019).
- 12. Australian Institute of Health and Welfare. Aboriginal and Torres Strait Islander Health Performance Framework 2017 report: Western Australia (Cat. no. IHW 185). Canberra: AIHW, 2017.
- 13. Briffa T, Hung J, Knuiman M, et al. Trends in incidence and prevalence of hospitalization for atrial fibrillation and associated mortality in Western Australia, 1995–2010. Int J Cardiol 2016; 208: 19–25.
- 14. Christensen D, Davis G, Draper G, et al. Evidence for the use of an algorithm in resolving inconsistent and missing Indigenous status in administrative data collections. Aust J Soc Issues 2014; 49: 423–443.
- 15. Lip GY, Nieuwlaat R, Pisters R, et al. Refining clinical risk stratification for predicting stroke and thromboembolism in atrial fibrillation using a novel risk factor‐based approach: the EuroHeart survey on atrial fibrillation. Chest 2010; 137: 263–272.
- 16. Australian Bureau of Statistics. The Australian statistical geography standard (ASGS) remoteness structure. Updated Mar 2018. http://www.abs.gov.au/websitedbs/d3310114.nsf/home/remoteness+structure (viewed Nov 2019).
- 17. Australian Bureau of Statistics. 2033.0.55.001. Census of population and housing: Socio‐Economic Indexes for Areas (SEIFA), Australia, 2011: IRSD. Mar 2013. https://www.abs.gov.au/ausstats/abs@.nsf/Lookup/by%20Subject/2033.0.55.001~2011~Main%20Features~IRSD~10005 (viewed Nov 2019).
- 18. Gu Y, Doughty RN, Freedman B, et al. Burden of atrial fibrillation in Māori and Pacific people in New Zealand: a cohort study. Intern Med J 2018; 48: 301–309.
- 19. Katzenellenbogen JM, Vos T, Somerford P, et al. Burden of stroke in Indigenous Western Australians: a study using data linkage. Stroke 2011; 42: 1515–1521.
- 20. Atzema CL, Khan S, Lu H, et al. Cardiovascular disease rates, outcomes, and quality of care in Ontario Métis: a population‐based cohort study. PLoS One 2015; 10: e0121779.
- 21. Lee E, Choi E‐K, Kyung‐Do H, et al. Mortality and causes of death in patients with atrial fibrillation: a nationwide population‐based study. PLoS One 2018; 13: e0209687.
- 22. Brown A, Carrington MJ, McGrady M, et al. Cardiometabolic risk and disease in Indigenous Australians: the Heart of the Heart Study. Int J Cardiol 2014; 171: 377–383.
- 23. Lawrence JG, Carapetis JR, Griffiths K, et al. Acute rheumatic fever and rheumatic heart disease: incidence and progression in the Northern Territory of Australia, 1997 to 2010. Circulation 2013; 128: 492–501.
- 24. Hussain MK, Katzenellenbogen JM, Sanfilippo FM, et al. Complexity in disease management: a linked data analysis of multimorbidity in Aboriginal and non‐Aboriginal patients hospitalised with atherothrombotic disease in Western Australia. PLoS One 2018; 13: e0201496.
- 25. Lip GYH, Keshishian A, Li X, et al. Effectiveness and safety of oral anticoagulants among nonvalvular atrial fibrillation patients. The ARISTOPHANES study. Stroke 2018; 49: 2933–2944.
- 26. Hamilton S, Mills B, McRae S, Thompson S. Evidence to service gap: cardiac rehabilitation and secondary prevention in rural and remote Western Australia. BMC Health Serv Res 2018; 18: 64.
- 27. Brieger DB, Amarena J, Bajorek B, et al. National Heart Foundation of Australia and the Cardiac Society of Australia and New Zealand: Australian clinical guidelines for the diagnosis and management of atrial fibrillation 2018. Heart Lung Circ 2018; 27: 1209–1266.
Abstract
Objectives: To assess the risks of stroke and cardiovascular mortality for Aboriginal and non‐Aboriginal Australians with atrial fibrillation.
Design: Retrospective data linkage cohort study.
Setting, participants: All people aged 20–84 years hospitalised with atrial fibrillation in Western Australia during 2000–2012.
Main outcome measures: Stroke incidence rates and mortality after hospitalisation for atrial fibrillation, and 10‐year risks of stroke and of cardiovascular and all‐cause mortality.
Results: Among 55 482 index admissions with atrial fibrillation, 7.7% of 20–59‐year‐old patients and 1.3% of 60–84‐year‐old patients were Aboriginal Australians. A larger proportion of Aboriginal patients aged 20–59 years had CHA2DS2‐VASc scores of 2 or more (59.8% v 21.8%). In 20–59‐year‐old Aboriginal patients, the incidence during follow‐up (maximum, 10 years; median, 7.1 years) of stroke (incidence rate ratio [IRR], 3.2; 95% CI, 2.5–4.1) and fatal stroke (IRR, 5.7; 95% CI, 3.9–8.9) were markedly higher than for non‐Aboriginal patients. Stroke incidence was higher for 60–84‐year‐old patients, but the difference between Aboriginal and non‐Aboriginal patients was smaller (IRR, 1.6; 95% CI, 1.3–2.0). Cardiovascular mortality during follow‐up was also higher for 20–59‐year‐old Aboriginal patients (IRR, 4.4; 95% CI, 4.3–5.9). The hazards of stroke (adjusted HR [aHR], 1.67; 95% CI, 1.22–2.28) and cardiovascular mortality (aHR, 1.47; 95% CI, 1.18–1.83) in younger Aboriginal patients remained significantly higher after multivariable adjustment; age/sex, principal diagnosis of atrial fibrillation, and CHA2DS2‐VASc score were the most influential factors.
Conclusion: Stroke risk and cardiovascular mortality are markedly higher for Aboriginal than non‐Aboriginal patients with atrial fibrillation, particularly for patients under 60. Strategies for providing evidence‐based therapies and cardiovascular prevention to Aboriginal people with atrial fibrillation must be improved.