


Coronavirus disease 2019 (COVID‐19) poses extraordinary challenges for health care in Australia. One of the greatest will be the pressure on hospitals to support people with severe disease. Modelling studies can provide valuable insights into the likely course of the epidemic, and can be particularly useful for anticipating resource requirements, including demand for intensive care services at the peak of the epidemic. In this report, we extrapolate the findings of the Imperial College model of the pandemic1 to the New South Wales population. We also developed a simple SEIR (susceptible–exposed/incubating–infected–removed) model to explore the effect of varying the infection reproduction number (R), which can be reduced by effective social distancing measures, on the timing of the peak of the epidemic. The two models are described in the online Supporting Information.
Applying the Imperial College model, the peak demand for intensive care in NSW would be at least 6965 beds if mitigation efforts — isolation of people with confirmed COVID‐19, household quarantine of their contacts, social distancing from people over 70 years of age — are implemented, or almost eight times as many as the baseline number; without mitigation, more than three times as many ICU beds (21 283) could be required (Box 1).
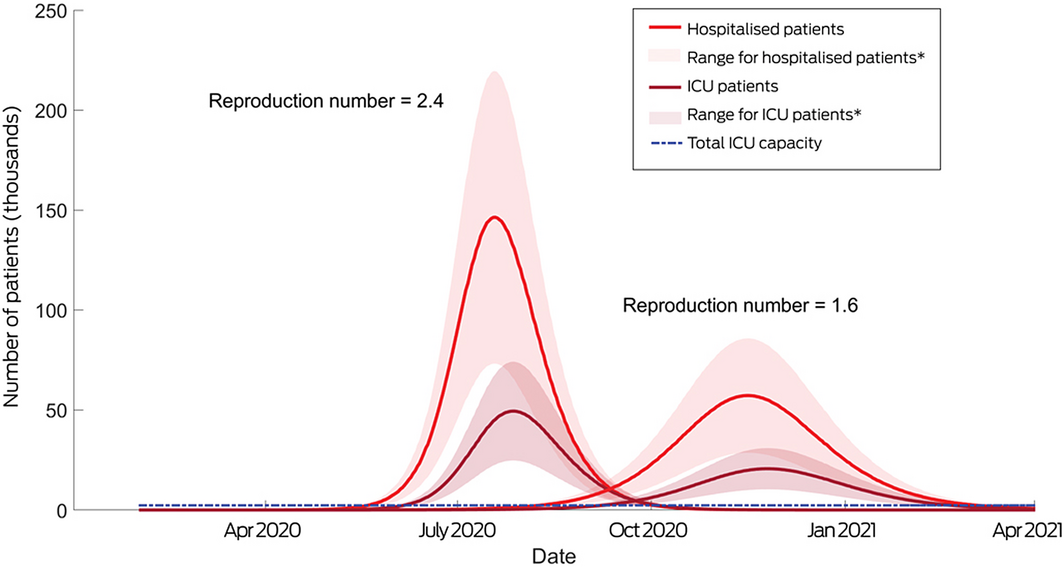
Applying our SEIR model to a scenario without social distancing measures (R = 2.4), the number of people requiring hospitalisation in NSW would peak at 450 per 100 000 population (35 375 beds), and the number requiring critical care at 150 per 100 000 population (11 792 ICU beds, or 1349% of baseline ICU capacity). In this scenario, viral transmission would peak during late June and ICU bed occupancy in early July. About 16% of people would be potentially infectious at this point, although a smaller proportion was modelled as exhibiting symptoms (Box 2; Supporting Information, table 3).
In a scenario of increased social isolation (R = 1.6) and an assumed hospitalisation rate for people with confirmed COVID‐19 of 6.7%, case numbers would peak in early October and ICU occupancy in mid‐November; about 180 people per 100 000 population would require hospitalisation (14 150 beds) and 65 per 100 000 intensive care (5110 ICU beds, or 585% of baseline ICU capacity) (Box 2; Supporting Information, table 3). That is, the peak figures would be about one‐third the size of those in the no mitigation scenario. Sensitivity analyses in which the proportion of hospitalised patients was varied (5–15%) similarly found that increasing social isolation markedly reduced demand (Supporting Information, table 4).
We have used two modelling methods to estimate peak demand for critical care services in NSW during the COVID‐19 epidemic. Both approaches identified that COVID‐19 would impose a major burden on the health care system, and the mismatch between the estimated numbers of ICU beds needed and their availability is stark. Our modelling shows the critical importance of effective COVID‐19 containment strategies, as well as the urgent need to invest in resources that support the surge capacity of critical care services in NSW.
Box 1 – Estimated number of intensive care unit (ICU) beds required at the peak of the initial wave of COVID‐19 cases, applying the Imperial College model to New South Wales, by Local Health District (LHD)
|
|
|
Mitigation strategy |
|||||||||||||
|
Population (2016)2 |
No mitigation |
Close schools, universities |
Case isolation |
Case isolation, household quarantine |
Case isolation, household quarantine, social distancing of people over 70 |
||||||||||
|
|
|||||||||||||||
|
ICU beds needed per 100 000 population1 |
— |
275 |
240 |
190 |
125 |
90 |
|||||||||
|
ICU beds need, by LHD |
|
|
|
|
|
|
|||||||||
|
Sydney |
656 460 |
1805 |
1576 |
1247 |
821 |
591 |
|||||||||
|
South Western Sydney |
964 342 |
2652 |
2314 |
1832 |
1205 |
868 |
|||||||||
|
South Eastern Sydney |
914 021 |
514 |
2194 |
1737 |
1143 |
823 |
|||||||||
|
Western Sydney |
948 584 |
2609 |
2277 |
1802 |
1186 |
854 |
|||||||||
|
Northern Sydney |
914 233 |
2514 |
2194 |
1737 |
1143 |
823 |
|||||||||
|
Illawarra Shoalhaven |
405 534 |
1115 |
973 |
771 |
507 |
365 |
|||||||||
|
Central Coast |
335 309 |
922 |
805 |
637 |
419 |
302 |
|||||||||
|
Other LHDs |
2 600 791 |
7152 |
6242 |
4942 |
3251 |
2341 |
|||||||||
|
All NSW (proportion of baseline bed number)* |
7 739 274 |
21 283 (2435%) |
18 574 (2125%) |
14 705 (1682%) |
9674 (1107%) |
6965 (797%) |
|||||||||
|
|
|||||||||||||||
|
* Estimated number of ICU beds prior to COVID‐19 epidemic: 874.3 |
|||||||||||||||
Received 22 March 2020, accepted 16 April 2020
- 1. Ferguson NM, Laydon D, Nedjati‐Gilani G, et al; Imperial College COVID‐19 Response Team. Impact of non‐pharmaceutical interventions (NPIs) to reduce COVID‐19 mortality and healthcare demand. 16 Mar 2020. https://www.imperial.ac.uk/media/imperial-college/medicine/sph/ide/gida-fellowships/Imperial-College-COVID19-NPI-modelling-16-03-2020.pdf (viewed Mar 2020).
- 2. HealthStats NSW. Population by local health district 2016. http://www.healthstats.nsw.gov.au/Indicator/dem_pop_lhnmap (view Mar 2020).
- 3. Australian and New Zealand Intensive Care Society. Centre for Outcome and Resource Evaluation: 2018 report. https://www.anzics.com.au/wp-content/uploads/2019/10/2018-ANZICS-CORE-Report.pdf (viewed Mar 2020).
No relevant disclosures.