


The known: The rates of HIV and other sexually transmissible infections (STIs) are greater overseas for transgender men and women than for other people. Data from Australia are very limited.
The new: Transgender women attending sexual health clinics in Australia are more likely to have STIs than cisgender heterosexual patients; transgender men are less likely than cisgender gay and bisexual men to have STIs. The prevalence of gonorrhoea among transgender women has risen from 3% to nearly 10% over the past seven years.
The implications: Health services need to meet the unique sexual health needs of transgender people, and patient gender information must be better captured by health systems.
Developing awareness of the problems faced by transgender people, including stigmatisation and discrimination,1 structural barriers to health care,2 and violence,3 has spurred their investigation. Researchers and advocates, however, have repeatedly bemoaned the paucity of reliable data, noting “the need to explicitly consider sex and gender pathways and mechanisms in epidemiologic research and public health surveillance more broadly”.4
Infection with the human immunodeficiency virus (HIV) and other sexually transmissible infections (STIs) are health problems for transgender people overseas4 and in Australia.5 A meta‐analysis found that transgender women are 49 times as likely to be HIV‐positive as adults in the general population,6 but the situation in Australia is unclear. Almost nothing is known about STI rates in transgender men, and the inclusion of all transgender people (ie, both men and women) in a single, third gender category by the national passive surveillance system hinders analyses of the relevant data in Australia.
STIs in transgender men and women in Australia have only been investigated in three single urban clinic studies in Sydney and Melbourne7,8,9 from which it is difficult to draw general conclusions about the sexual health of transgender people. It is unknown whether transgender men and women are at greater risk for infection than cisgender people (those whose gender corresponds to their sex at birth), an important question given the rising rates of STIs and the continuing presence of HIV in Australia.10
We analysed data for a national sample of transgender people who had attended publicly funded sexual health clinics in Australia. We estimated rates of HIV, chlamydia, gonorrhoea and syphilis infections in transgender men and women, assessed changes in these rates over time, and compared them with rates for cisgender people.
Methods
Study design
We conducted a cross‐sectional study of health data extracted from the Australian Collaboration for Coordinated Enhanced Sentinel Surveillance (ACCESS) network.11
Setting
We extracted data for the period 1 January 2010 – 31 December 2017 from 46 of 59 publicly funded sexual health clinics in Australia: 33 in New South Wales, seven in Queensland, two in the Northern Territory, and one each in Western Australia, Victoria, South Australia, and the Australian Capital Territory. Twenty clinics were located in major cities, 22 in regional areas, and four in remote parts of the country. Data from the nine other sexual health clinics participating in ACCESS could not be analysed because transgender patients were not separately identified in their data systems.
Participants
Patients were classified as transgender men, transgender women, cisgender gay and bisexual men, and cisgender heterosexual people (men and women combined). Each patient had no more than one record at a clinic, but they could have several records if they had attended more than one clinic. ACCESS employed a process of data linkage that relied on non‐reversible alphanumeric keys based on unique patient details (eg, name) to link patient records from different clinics. This process of anonymous linkage could account for slight variations in details (eg, differences in names such as “Bill” and “William”) but not necessarily for deliberate attempts to obscure identity (eg, pseudonyms).11
Variables
For each consultation, the following data were extracted: date of clinic visit; and patient age, sex/gender, home postcode (urban or non‐urban12), country of birth (Australia or overseas), HIV status, and Indigenous status.
We extracted test and diagnosis data for chlamydia, gonorrhoea, syphilis, and HIV infections. For chlamydia and gonorrhoea, results were categorised by anatomic site (any/all, urogenital, anorectal, pharyngeal) and cases were identified by positive test results; infectious syphilis (primary, secondary, early latent [less than 2 years]) was identified by clinical diagnosis, because interpreting test results is difficult without knowing the clinical context. New HIV infection cases were identified from test results; existing cases were identified by self‐reported HIV status or current HIV‐related care.
Sexual health clinics in Australia often collect behavioural risk data that we extracted when available: injecting drug use, sex work, condom use, sexual partner numbers, and gender of partners during the 12 months preceding a consultation.
Statistical analysis
We report descriptive summary analyses of demographic and behavioural characteristics based on each patient's first visit to a sexual health clinic; differences between groups were assessed in χ2 tests. First‐test positivity for an STI was defined as the proportion of patients with positive results at their first clinical visit, using anonymous linkage to more accurately identify initial consultations.11 First‐test positivity is useful for estimating the prevalence of STIs among clinic patients; by focusing on individuals, it reduces the effects on estimates of clinical engagement and repeat testing.13
Differences between patient groups in rates of test positivity were assessed by univariate logistic regression. First‐test positivity was stratified by 2‐year periods because of small numbers in some groups, and temporal changes assessed in Wilcoxon rank‐sum tests. As each first clinical encounter was assigned to the period in which it took place, each patient contributed one data point during the study period.
To assess factors associated with STIs, test results for first visits were combined in the single category of “bacterial STI infection” as the outcome variable in a multiple logistic regression; demographic and behavioural variables were included in the model if the associated unadjusted P ≤ 0.10. We conducted two multivariable analyses: the first assessed factors associated with infection in transgender patients; the second also included transgender status as a predictor variable. This analysis was not conducted for HIV infections because the number of positive test results was low. All analyses were conducted in Stata 14.0 (StataCorp); P < 0.05 was deemed statistically significant.
Ethics
ACCESS was reviewed and approved by the human research ethics committees of the Alfred Hospital, Melbourne (reference, 248/17), the Menzies School of Health, Darwin (reference, 08/047), and, representing the interests of LGBTQI+ people, the AIDS Councils of New South Wales (reference, 2015/14) and Victoria (reference, VAC REP 15/003).
Results
Participants
During 2010–2017, 389 108 people attended the 46 sexual health clinics; 5852 (1.5%) had visited more than one clinic, and their records were collapsed to identify their first visits. A total of 1260 people (0.32%) were recorded as transgender: 404 transgender men (32%), 492 transgender women (39%), and 364 patients for whom gender details were not recorded (29%; excluded from our comparative analyses). Data were also captured for 78 108 cisgender gay and bisexual men (20.1% of the sample) and 309 740 cisgender heterosexual people (79.6%). As condom use and sexual partner data were recorded for only 15% of transgender patients, these variables are not reported and were excluded from our analyses (Box 1).
The proportion of patients identified as transgender increased slightly from 0.39% (244 of 61 370) in 2010 to 0.56% in 2017 (472 of 83 898; P < 0.001), with the increase greatest during 2014–2017 (data not shown). The proportion of patients identified as transgender but without further gender details declined from 28.3% in 2010 (69 of 244) to 20.3% in 2017 (96 of 472; P = 0.017), although this change was not consistent (data not shown).
Prevalence of sexually transmitted infections
Chlamydia
At their first visits, 233 transgender men (58%) and 326 transgender women (66%) were tested for chlamydia (P = 0.008). Fourteen transgender men (6%) and 34 transgender women (10%; P = 0.10) were diagnosed with chlamydia; 5462 of 71 414 tested cisgender gay and bisexual men (7.6%) and 20 676 of 192 101 tested cisgender heterosexual patients (10.8%) were positive for chlamydia (Supporting Information, table 1; Box 2). The rates of chlamydia positivity in transgender men (odds ratio [OR], 0.77; 95% confidence interval [CI], 0.44–1.33; P = 0.35) and transgender women (OR, 1.04; 95% CI, 0.86–1.27; P = 0.67) were not statistically significantly different from that for cisgender gay and bisexual men. The prevalence of chlamydia positivity was lower among transgender men than among cisgender heterosexual patients (OR, 0.73; 95% CI, 0.56–0.95; P = 0.021) but the rates for transgender women and heterosexual patients were similar (OR, 0.91; 95% CI, 0.80–1.04; P = 0.15). The frequency of infections at each anatomic site was higher for transgender women than for transgender men, as was the proportion of anorectal infections (Supporting Information, table 1).
The rate of first‐test chlamydia positivity was statistically stable between 2010–2011 and 2016–2017 for both transgender men (P = 0.39) and women (P = 0.06). Among patients attending a sexual health clinic for the first time, chlamydia positivity increased among cisgender gay and bisexual men (from 5.6% in 2010–2011 to 9.7% in 2016–2017; P < 0.001) and was stable among cisgender heterosexual patients (P = 0.09) (Box 3; Supporting Information, table 2).
Gonorrhoea
At their first visits, 233 transgender men (58%) and 326 transgender women (66%) were tested for gonorrhoea (P = 0.008). Nine transgender men (4%) and 28 transgender women (8.6%; P = 0.027) were diagnosed with gonorrhoea; 6162 of 71 414 tested cisgender gay and bisexual men (8.63%) and 4771 of 192 101 tested cisgender heterosexual patients (2.48%) were positive for gonorrhoea (Supporting Information, table 1; Box 2). The rate of first‐visit gonorrhoea positivity was lower among transgender men than among cisgender gay and bisexual men (OR, 0.51; 95% CI, 0.36–0.74; P < 0.001) but similar to that for cisgender heterosexual patients (OR, 1.25; 95% CI, 0.90–1.75; P = 0.19); the rate for transgender women was similar to that of cisgender gay and bisexual men (OR, 1.16; 95% CI, 0.96–1.40; P = 0.12) but higher than for cisgender heterosexual patients (OR, 1.50; 95% CI, 1.31–1.72; P < 0.001). [Correction added on 3 September 2019, after first online publication: The rate of first‐visit gonorrhea positivity for transgender women was erroneously noted as lower than the rate for cisgender heterosexual patients and has been corrected.] The frequencies and proportions of anorectal and pharyngeal infections were higher for transgender women than for transgender men (Supporting Information, table 1).
The rate of first‐visit gonorrhoea positivity in transgender women increased from 3.1% in 2010–2011 to 9.8% in 2016–2017 (P = 0.011) but was stable for transgender men (P = 1.0). Among patients attending a sexual clinic for the first time, gonorrhoea positivity increased among cisgender gay and bisexual men (from 5.1% in 2010–2011 to 11.5% in 2016–2017; P < 0.001) and cisgender heterosexual patients (from 2.11% to 3.01%; P < 0.001) (Box 3; Supporting Information, table 2).
Infectious syphilis
At their first visits, 210 transgender men (52%) and 324 transgender women (66%) were tested for syphilis (P < 0.001). One transgender man (0.5%) and ten transgender women (3.1%; P = 0.038) were diagnosed with infectious syphilis; 1186 of 48 347 tested gay and bisexual men (2.4%) and 406 of 120 813 tested cisgender heterosexual patients (0.34%) had diagnoses of syphilis (Supporting Information, table 1; Box 2). The syphilis rates for transgender men (OR, 0.19; 95% CI, 0.03–1.36; P = 0.10) and transgender women (OR, 1.13; 95% CI, 0.82–1.54; P = 0.46) were not significantly different from that for cisgender gay and bisexual men. Rates of syphilis diagnoses were similar for transgender men and cisgender heterosexual patients (OR, 1.19; 95% CI, 0.46–3.19; P = 0.73), but the rate for transgender women was higher (OR, 9.44; 95% CI, 4.99–17.9; P < 0.001).
The rate of infectious syphilis diagnoses was stable between 2010–2011 and 2016–2017 for both transgender men (P = 0.07) and women (P = 0.80); it increased among cisgender gay and bisexual men (from 1.90% in 2010–2011 to 2.71% in 2016–2017; P < 0.001) and cisgender heterosexual patients (from 0.22% to 0.52%, P < 0.001) (Box 3; Supporting Information, table 2).
HIV
Excluding patients known to be HIV‐positive at their first visit, 187 of 390 transgender men (48%) and 296 of 464 transgender women (64%) were tested for HIV (P < 0.001); there were no positive test results. Fourteen transgender men (3.5%) and 28 transgender women (5.7%) were known to be HIV‐positive at their first visits (P = 0.19); 5756 of 78 108 cisgender gay and bisexual men (7.37%) and 3814 of 309 740 cisgender heterosexual patients (1.23%) were HIV‐positive at their first visits (Supporting Information, table 1; Box 2). Transgender men were less likely to be HIV‐positive than cisgender gay and bisexual men (OR, 0.36; 95% CI, 0.21–0.62; P < 0.001), as were transgender women (OR, 0.62; 95% CI, 0.42–0.95; P < 0.001); transgender men were more likely to be HIV‐positive than cisgender heterosexual patients (OR, 2.89; 95% CI, 1.69–4.92; P < 0.001), as were transgender women (OR, 4.85; 95% CI, 3.31–7.11; P < 0.001).
The proportion of patients with existing HIV infections at first visit was stable between 2010–2011 and 2016–2017 among transgender men (P = 0.25) and transgender women (P = 0.48); it decreased among gay and bisexual men (from 8.30% in 2010–2011 to 6.09% in 2016–2017; P < 0.001) and among cisgender heterosexual patients (from 1.6% in 2010–2011 to 0.95% in 2016–2017; P < 0.001) (Box 3; Supporting Information, table 2).
Factors associated with sexually transmitted infection diagnoses
At their first visit, 21 of 251 transgender men (8.4%) and 54 of 351 transgender women (15%) tested for chlamydia and gonorrhoea (duplex testing), syphilis, or for all three were diagnosed with one or more bacterial STIs. Among transgender patients, being born overseas (adjusted OR [aOR], 2.16; 95% CI, 1.22–3.81; P = 0.008) was significantly associated with receiving STI diagnoses (Box 4).
At their first visit, 11 088 of 72 960 tested cisgender gay and bisexual men (15.2%) and 24 400 of 197 224 tested cisgender heterosexual patients (12.4%) were diagnosed with one or more bacterial STIs. In the multivariable analysis of data for all sexual health clinic patients (excluding transgender patients for whom gender was not recorded), being under 30 years of age (aOR, 1.91; 95% CI, 1.86–1.96; P < 0.001), born overseas (aOR, 1.08; 95% CI, 1.05–1.10; P < 0.001), and non‐Indigenous (aOR, 0.85; 95% CI, 0.83–0.87; P < 0.001) were each associated with having STI diagnoses. Sex work in the 12 months preceding the consultation was associated with a lower likelihood of infection (aOR, 0.80; 95% CI, 0.77–0.83; P < 0.001). The likelihood of an STI diagnosis was lower for transgender men than for cisgender gay and bisexual men (aOR, 0.46; 95% CI, 0.29–0.71; P = 0.001), while the likelihood for transgender women was similar (aOR, 0.98; 95% CI, 0.73–1.32; P = 0.92) (Box 4). Compared with cisgender heterosexual patients, the likelihood of an STI diagnosis was similar for transgender men (aOR, 0.72; 95% CI, 0.46–1.13; P = 0.16) but greater for transgender women (aOR, 1.56; 95% CI, 1.16–2.10; P = 0.003).
Discussion
We have estimated the prevalence of STIs among transgender men and women attending sexual health clinics in Australia. Among transgender patients, being born overseas was associated with a greater likelihood of receiving a first‐visit bacterial STI diagnosis (as also reported for Australians in general10). Compared with cisgender gay and bisexual men, rates of bacterial STI diagnoses were lower for transgender men and similar for transgender women; compared with cisgender heterosexual patients, rates of bacterial STI diagnoses were similar for transgender men and higher for transgender women.
The differences in positivity rates between trans‐ and cisgender patients suggest that transgender men and women have sexual health risk profiles that differ from those of cisgender people, consistent with the findings of some behavioural studies.14,15,16 Further investigation is needed to understand the sexual behaviours and networks of transgender people in Australia and how they influence STI risk.
The prevalence of gonorrhoea has increased over the past decade among transgender women attending sexual health clinics, but not transgender men. This change illustrates why we need to move beyond including all transgender people in a single category, as epidemiologic differences such as this require different responses for reducing infection and delivering appropriate sexual health care.
Complete information on gender was unavailable for many transgender patients, despite recommendations regarding best practice collection of health data.17,18 Health systems must meet the specific sexual health needs of gender‐diverse communities. Not adequately accounting for gender undermines health surveillance, diminishes patient confidence, and reduces quality of care.19
Limitations
We have provided the first national epidemiologic account of STIs in transgender people in Australia, and also one of the most comprehensive studies of its kind internationally. However, we were unable to account for gender‐diverse people (eg, gender non‐binary or agender people). Second, our multivariable analysis of bacterial STI rates did not include condom use or the numbers and genders of sexual partners as factors, each of which influence risk but were poorly recorded for transgender patients. Third, given the limited number of new cases of HIV infection we identified, methods other than sentinel surveillance are required to assess HIV prevalence among transgender people. Finally, as the clientele of sexual health clinics are people at greater risk of STIs than the general population,20 our findings may not be generalisable to all transgender and cisgender people.
Conclusion
While we did not find as markedly higher levels of STIs in transgender people as have been reported overseas,6 some significant differences from cisgender people were evident. Understanding the sexual practices and identities of transgender and gender‐diverse people therefore requires further investigation, particularly in the face of rising STI rates in Australia.
Box 1 – Demographic and behavioural characteristics of 1260 transgender and 387 848 cisgender people who attended 46 Australian sexual health clinics, 2010–2017, by transgender status and sexual orientation (cisgender only)
|
Characteristic* |
Transgender people |
Cisgender people |
|||||||||||||
|
Men |
Women |
Gender not recorded |
Gay and bisexual men |
Heterosexual men and women |
|||||||||||
|
|
|||||||||||||||
|
Number of people |
404 |
492 |
364 |
78 108 |
309 740 |
||||||||||
|
Age at first visit (years), median (IQR) |
29 (22–40) |
29 (24–40) |
32 (27–38) |
31 (26–41) |
28 (23–36) |
||||||||||
|
Born in Australia |
305 (78%) |
281 (61%) |
154 (44%) |
45 194 (59.0%) |
163 738 (53.6%) |
||||||||||
|
Urban postcode |
185 (48%) |
294 (65%) |
297 (97%) |
63 731 (88.8%) |
201 471 (72.2%) |
||||||||||
|
Aboriginal or Torres Strait Islander Australian |
29 (17%) |
35 (13%) |
12 (3.3%) |
1388 (2.2%) |
14 831 (6.9%) |
||||||||||
|
Injecting drug use† |
12 (3.4%) |
28 (6.5%) |
26 (7.1%) |
3371 (4.4%) |
7695 (2.6%) |
||||||||||
|
Sex work† |
55 (14%) |
153 (33%) |
195 (54%) |
6542 (8.4%) |
27 372 (8.8%) |
||||||||||
|
|
|||||||||||||||
|
IQR = interquartile range. * Missing data: age, 31 (0.01%); country of birth, 5792 (1.5%); home postcode, 37 217 (9.6%); Indigenous status, 111 051 (29%); injecting drug use, 17 456 (4.5%). † Reported at any point during the study period. ◆ |
|||||||||||||||
Box 2 – Proportions of tested patients positive for bacterial sexually transmitted infections, and proportion of patients known to be HIV‐positive (with 95% confidence intervals): people attending 46 Australian sexual health clinics for the first time, 2010–2017
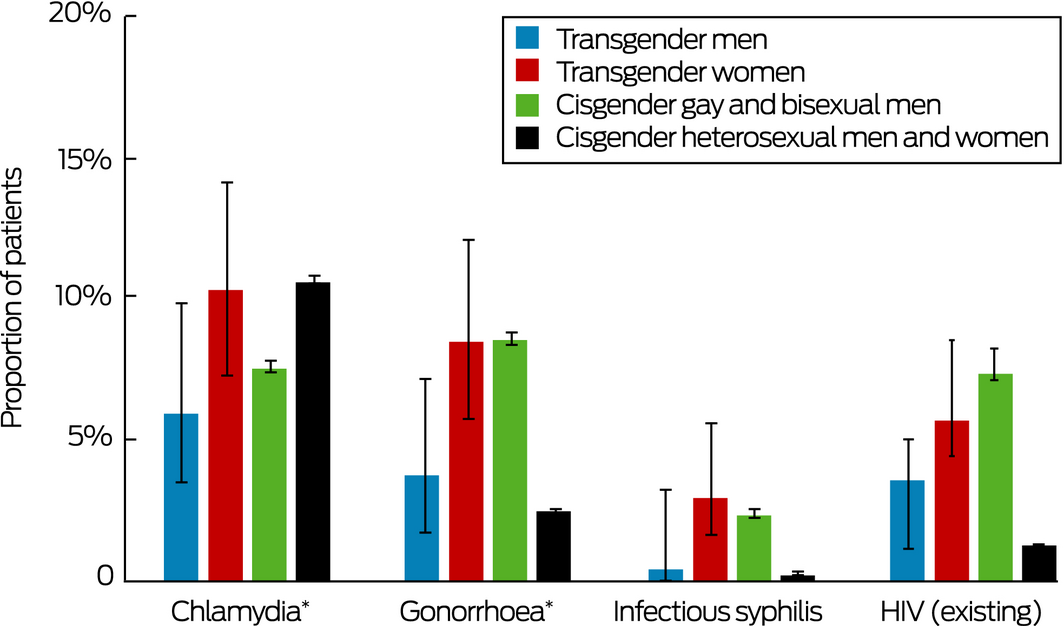
HIV = human immunodeficiency virus. * Any anatomic site. ◆
Box 3 – First‐test positivity or diagnosis rate of bacterial sexually transmitted infections and first‐visit clinical prevalence of HIV among patients who attended 46 Australian sexual health clinics, 2010–2017, by paired years
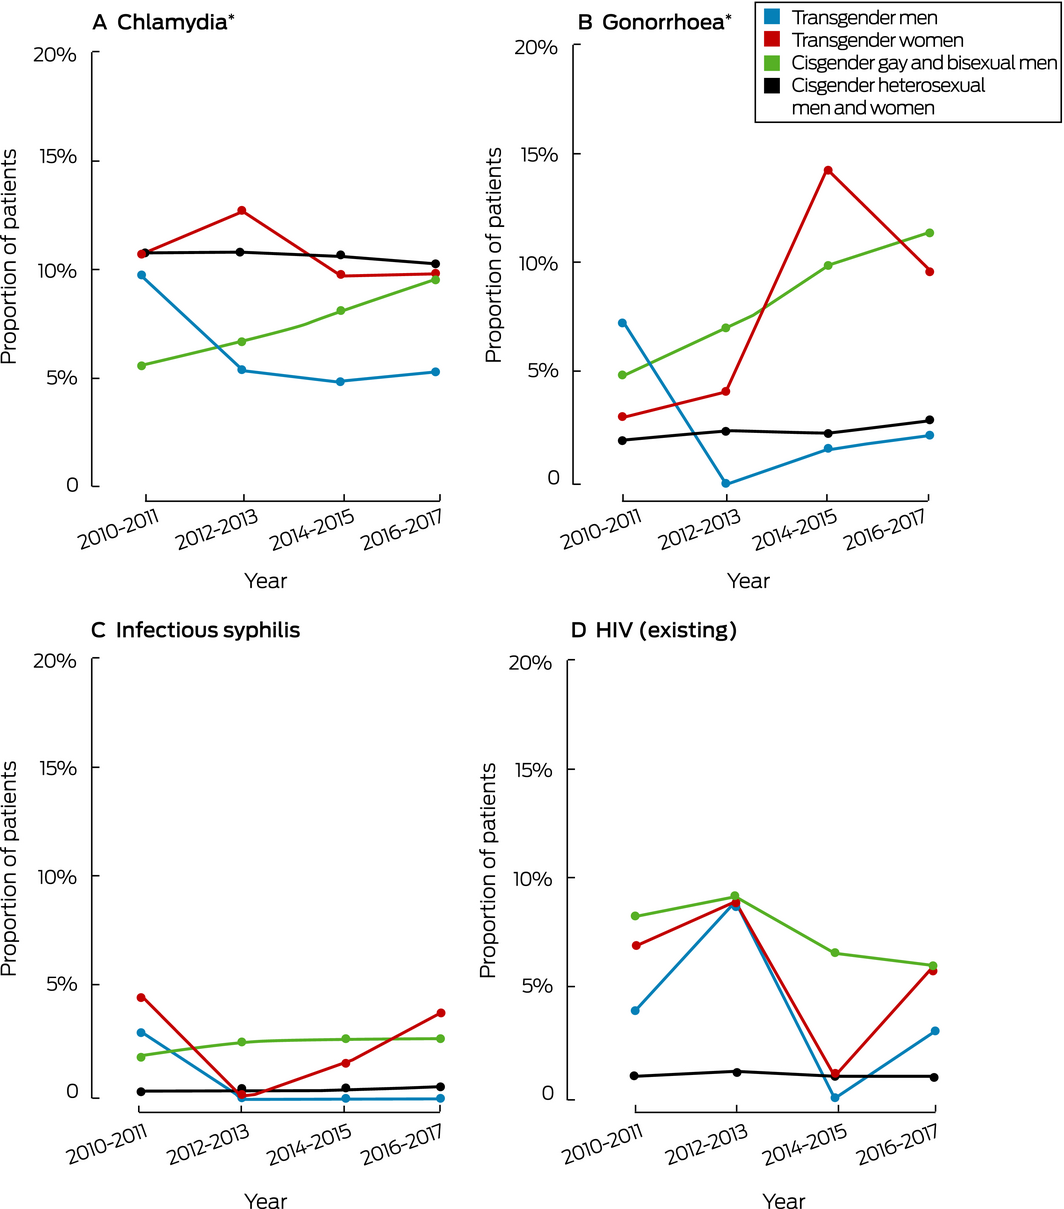
HIV = human immunodeficiency virus. * Any anatomic site. ◆
Box 4 – First‐visit diagnoses of bacterial sexually transmitted infections (chlamydia, gonorrhoea, infectious syphilis) among patients who attended 46 Australian sexual health clinics, 2010–2017: univariate and multivariable analyses*
|
|
Transgender patients |
All patients |
|||||||||||||
|
OR (95% CI) |
P |
aOR (95% CI) |
P |
OR (95% CI) |
P |
aOR (95% CI) |
P |
||||||||
|
|
|||||||||||||||
|
Patient group |
|
|
|
|
|
|
|
|
|||||||
|
Cisgender gay and bisexual men |
— |
|
— |
|
1 |
— |
1 |
— |
|||||||
|
Cisgender heterosexual patients |
— |
|
— |
|
0.78 |
< 0.001 |
0.63 |
< 0.001 |
|||||||
|
Transgender men |
1 |
— |
1 |
— |
0.51 |
< 0.001 |
0.46 |
0.001 |
|||||||
|
Transgender women |
1.99 |
0.011 |
1.29 |
0.40 |
1.01 |
0.92 |
0.98 |
0.92 |
|||||||
|
Age |
|
|
|
|
|
|
|
|
|||||||
|
≥ 30 years |
1 |
— |
1 |
— |
1 |
— |
1 |
— |
|||||||
|
< 30 years |
1.81 |
< 0.001 |
1.64 |
0.06 |
1.81 |
< 0.001 |
1.91 |
< 0.001 |
|||||||
|
Country of birth |
|
|
|
|
|
|
|
|
|||||||
|
Australia |
1 |
— |
1 |
— |
1 |
— |
1 |
— |
|||||||
|
Overseas |
1.03 |
< 0.001 |
2.16 |
0.008 |
1.04 |
0.002 |
1.08 |
< 0.001 |
|||||||
|
Postcode of residence |
|
|
|
|
|
|
|
|
|||||||
|
Non‐urban |
1 |
— |
1 |
— |
1 |
— |
1 |
— |
|||||||
|
Urban |
0.96 |
0.004 |
1.76 |
0.17 |
0.96 |
0.004 |
0.98 |
0.22 |
|||||||
|
Indigenous status |
|
|
|
|
|
|
|
|
|||||||
|
Non‐Indigenous |
1 |
— |
1 |
— |
1 |
— |
1 |
— |
|||||||
|
Aboriginal or Torres Strait Islander |
0.61 |
< 0.001 |
1.18 |
0.58 |
0.88 |
< 0.001 |
0.85 |
< 0.001 |
|||||||
|
Recent injecting drug use† |
|
|
|
|
|
|
|
|
|||||||
|
No |
1 |
— |
1 |
— |
1 |
— |
— |
— |
|||||||
|
Yes |
0.9 |
0.95 |
— |
— |
1.01 |
0.79 |
— |
— |
|||||||
|
Recent sex work† |
|
|
|
|
|
|
|
|
|||||||
|
No |
1 |
— |
1 |
— |
1 |
— |
1 |
— |
|||||||
|
Yes |
0.73 |
< 0.001 |
1.63 |
0.09 |
0.9 |
0.08 |
0.80 |
< 0.001 |
|||||||
|
|
|||||||||||||||
|
aOR = adjusted odds ratio; OR = Odds ratio; CI = confidence interval.* Multivariable analyses included only those patients for whom a sexually transmitted infection test was conducted (any infection) and for whom information on each covariate was recorded: 234 transgender men, 339 transgender women, 65 617 cisgender gay and bisexual men, and 172 898 cisgender heterosexual patients. Transgender people for whom gender was not recorded were excluded from both analyses. Odds ratios adjusted for all other factors significant in univariate analyses. † At least once during the 12 months preceding the first visit to a sexual health clinic. ◆ |
|||||||||||||||
Received 26 October 2018, accepted 21 May 2019
- Denton Callander1,2
- Teddy Cook3
- Phillip Read1,4
- Margaret E Hellard5
- Christopher K Fairley6,7
- John M Kaldor1
- Emanuel Vlahakis8
- Alisa Pollack9
- Christopher Bourne9,10
- Darren B Russell11
- Rebecca J Guy1
- Basil Donovan1,9
- 1 Kirby Institute, University of New South Wales, Sydney, NSW
- 2 New York University School of Medicine, New York, New York, United States
- 3 AIDS Council of New South Wales, Sydney, NSW
- 4 Kirketon Road Centre, Sydney, NSW
- 5 Centre for Population Health, Burnet Institute, Melbourne, VIC
- 6 Melbourne Sexual Health Centre, Alfred Hospital, Melbourne, VIC
- 7 Central Clinical School, Monash University, Melbourne, VIC
- 8 Mid North Coast Local Health District, Coffs Harbour, NSW
- 9 Sydney Sexual Health Centre, Sydney, NSW
- 10 New South Wales Ministry of Health, Sydney, NSW
- 11 Cairns Sexual Health, Cairns, QLD
Funding
Australian Government Department of Health.
ACCESS receives funding from the Australian Department of Health. We thank Tobias Vickers for his support with extracting and preparing the data for this analysis. We also acknowledge the ACCESS chief investigators who are not authors on this article, Mark Stoove and Carol El‐Hayek. Finally, we thank the clinical staff who supported the extraction and interpretation of ACCESS data.
No relevant disclosures.
- 1. Pitts MK, Couch M, Mulcare H, et al. Transgender people in Australia and New Zealand: health, well‐being and access to health services. Fem Psychol 2009; 19: 475–495.
- 2. Safer JD, Coleman E, Feldman J, et al. Barriers to health care for transgender individuals. Curr Opin Endocrinol Diabetes Obes 2016; 23: 168–171.
- 3. Stotzer RL. Violence against transgender people: a review of United States data. Aggress Violent Behav 2009; 14: 170–179.
- 4. Reisner SL, Poteat T, Keatley J, et al. Global health burden and needs of transgender populations: a review. Lancet 2016; 388: 412–436.
- 5. McNulty A, Bourne C. Transgender HIV and sexually transmissible infections. Sex Health 2017; 14: 451–455.
- 6. Baral SD, Poteat T, Strömdahl S, et al. Worldwide burden of HIV in transgender women: a systematic review and meta‐analysis. Lancet Inf Dis 2013; 13: 214–222.
- 7. Pell C, Prone I, Vlahakis E. Comparison of male to female (MTF) and female to male (FTM) transgender patients attending Taylor Square Private Clinic (TSPC) Sydney, Australia; clinical audit results. J Sex Med 2011; 8: 179.
- 8. Hounsfield VL, Freedman E, McNulty A, Bourne C. Transgender people attending a Sydney sexual health service over a 16‐year period. Sex Health 2007; 4: 189–193.
- 9. Bellhouse C, Walker S, Fairley CK, et al. Patterns of sexual behaviour and sexual healthcare needs among transgender individuals in Melbourne, Australia, 2011–2014. Sex Trans Inf 2018; 94: 212–215.
- 10. Kirby Institute. HIV, viral hepatitis and sexually transmissible infections in Australia: annual surveillance report 2017. Sydney: Kirby Institute, UNSW Australia, 2017. https://kirby.unsw.edu.au/report/annual-surveillance-report-hiv-viral-hepatitis-and-stis-australia-2017 (viewed Mar 2019).
- 11. Callander D, Moriera C, Asselin J, et al. Monitoring the control of sexually transmissible infections and blood‐borne viruses: protocol for the Australian Collaboration for Coordinated Enhanced Sentinel Surveillance (ACCESS). JMIR Res Prot 2018; 7: e11028.
- 12. Australian Bureau of Statistics. Australian Statistical Geography Standard (ASGS). Updated July 2018. https://www.abs.gov.au/websitedbs/D3310114.nsf/home/Australian+Statistical+Geography+Standard+(ASGS)) (viewed Mar 2019).
- 13. Dicker LW, Mosure DJ, Levine WC. Chlamydia positivity versus prevalence: what's the difference? Sexually Trans Dis 1998; 25: 251–253.
- 14. James S, Herman J, Rankin S, Keisling M, et al. The report from the 2015 US Transgender Survey. Washington (DC): National Center for Transgender Equality, 2016. http://www.ustranssurvey.org/reports (viewed Mar 2019).
- 15. Wilson EC, Chen Y‐H, Raad N, et al. Who are the sexual partners of transgender individuals? Differences in demographic characteristics and risk behaviours of San Francisco HIV testing clients with transgender sexual partners compared with overall testers. Sex Health 2014; 11: 319–333.
- 16. Bockting W, Huang C‐Y, Ding H, et al. Are transgender persons at higher risk for HIV than other sexual minorities? A comparison of HIV prevalence and risks. Int J Transgend 2005; 8: 123–131.
- 17. Deutsch MB, Green J, Keatley J, et al. Electronic medical records and the transgender patient: recommendations from the World Professional Association for Transgender Health EMR Working Group. J Am Med Inform Assoc 2013; 20: 700–703.
- 18. Irlam C. LGBTI data: developing an evidence‐informed environment for LGBTI health policy. Sydney: National LGBTI Health Alliance, 2013. https://lgbtihealth.org.au/resources/lgbti-data (viewed Mar 2019).
- 19. Bauer GR, Hammond R, Travers R, et al. “I don't think this is theoretical; this is our lives”: how erasure impacts health care for transgender people. J Assoc Nurses AIDS Care 2009; 20: 348–361.
- 20. Ali H, Donovan B, Fairley CK, et al. Are Australian sexual health clinics attracting priority populations? Sex Health 2013; 10: 456–459.
Abstract
Objectives: To estimate rates of HIV infection, chlamydia, gonorrhoea, and infectious syphilis in transgender men and women in Australia; to compare these rates with those for cisgender people.
Design: Cross‐sectional, comparative analysis of de‐identified health data.
Setting, participants: We analysed data for 1260 transgender people (404 men, 492 women, 364 unrecorded gender), 78 108 cisgender gay and bisexual men, and 309 740 cisgender heterosexual people who attended 46 sexual health clinics across Australia during 2010–2017.
Main outcome measures: First‐visit test positivity for sexually transmitted infections (STIs), stratified by patient group and year; demographic and behavioural factors associated with having STIs.
Results: 14 of 233 transgender men (6.0%) and 34 of 326 transgender women (10%) tested during first clinic visits were chlamydia‐positive; nine transgender men (4%) and 28 transgender women (8.6%) were gonorrhoea‐positive. One of 210 tested transgender men (0.5%) and ten of 324 tested transgender women (3.1%) were diagnosed with infectious syphilis; 14 transgender men (3.5%) and 28 transgender women (5.7%) were HIV‐positive at their first visit. The only significant change in prevalence of an STI among transgender patients during the study period was the increased rate of gonorrhoea among transgender women (from 3.1% to 9.8%). Compared with cisgender gay and bisexual men, transgender men were less likely (adjusted odds ratio [aOR], 0.46; 95% CI, 0.29–0.71; P = 0.001) and transgender women as likely (aOR, 0.98; 95% CI, 0.73–1.32; P = 0.92) to be diagnosed with a bacterial STI; compared with heterosexual patients, transgender men were as likely (aOR, 0.72; 95% CI, 0.46–1.13; P = 0.16) and transgender women more likely (aOR, 1.56; 95% CI, 1.16–2.10; P = 0.003) to receive a first‐visit bacterial STI diagnosis.
Conclusions: The epidemiology of STIs in transgender people attending Australian sexual health clinics differs from that of cisgender patients. Gender details must be captured by health data systems to facilitate appropriate delivery of sexual health care.