




Volume 211 - Issue 11
What would happen if Santa Claus was sick? His impact on communicable disease transmission
Author: Yuki Furuse
Med J Aust 2019; 211 (11): 523-524. || doi: 10.5694/mja2.50420
Published online: 9 December 2019
Published online: 9 December 2019
Efforts to reduce the probability of disease transmission by Santa Claus can mitigate his impact on public health
In some areas of the world it is believed that Santa Claus brings presents to children on Christmas Eve. While it is unclear whether only good boys and girls receive presents, it is reported that more than 90% of children are visited by Santa Claus at Christmas.1 It is possible that he could spread pathogens if infected with a communicable disease at the time of his yearly visit. In this study, we used mathematical modelling to investigate the probability and impact of influenza and measles transmission by Santa Claus on Christmas Eve.
We simulated infectious disease transmission by Santa Claus and its consequences in a discrete‐time stochastic SEIR (Susceptible, Exposed, Infectious, and Recovered) compartmental model; the details of our methodology are described in the online Supporting Information. Potential efficiency of disease transmission from Santa Claus to children, including airborne, droplet, and direct or indirect contact transmission, was initially assumed to be equivalent to that for transmission from other adults. As contacts between Santa Claus and individual children, however, are transient and therefore less likely to result in disease transmission, we also included a santa‐factor that accounted for different levels of transmission efficiency.
To assess the impact of a visit by Santa Claus on influenza transmission, we assumed the location of our simulation to be the Northern Hemisphere, where Santa visits children in the middle of a seasonal influenza outbreak.2 The population infection rate for an influenza outbreak in the absence of a visit by Santa Claus was 18.7% (interquartile range [IQR], 17.4–19.5%) (Box 1). When Santa Claus was infected with influenza and contact with children was as efficient as that of generic adults for transmitting disease (santa‐factor = 1), the infection rate increased to 20.9% (IQR, 20.0–21.8%; P < 0.001). The numbers of infected children and adults both increased, but these increases were not found when the santa‐factor was set to 0.1 or 0.01.
In the measles simulation, we introduced one infected generic adult or infected Santa Claus into a population of 10 000 people on day 1. When vaccination coverage was 95% for children and 90% for adults, introducing one infected adult did not cause any disease transmission in 70% of simulations; in the remaining 30%, fewer than 150 people were infected. When the disease was introduced by infected Santa Claus with santa‐factor = 1, at least one transmission occurred in 100% of simulations, but the final size of the outbreaks was small (fewer than 150 infected persons). When santa‐factor was set to 0.1, there was no transmission in 32% of simulations, and the outbreaks in the remaining 68% were small. Finally, when santa‐factor was set to 0.01, the probability of Santa Claus infecting at least one person was even lower than when an infected generic adult was introduced (Box 2).
We also tested a scenario in which vaccination coverage was only 85% among children (but 90% among adults). Introducing one infected generic adult into the population caused no transmission in 64% of simulations, a small outbreak in 15%, and a large outbreak in 21% (at least 150 infected people). When Santa Claus had measles and santa‐factor = 1, all simulations resulted in a large outbreak, as did 77% of simulations with santa‐factor set to 0.1; with santa‐factor set to 0.01, the size of the outbreaks was similar to that caused by one infected generic adult (Box 3).
We found that disease transmission by Santa Claus potentially has a great impact on public health. When Santa Claus was infected with influenza and transmitted the disease effectively through contact with children, the final size of a seasonal outbreak increased slightly but statistically significantly. The impact of Santa Claus visiting was even greater for measles; visits while he was measles‐infected typically caused large outbreaks, especially when vaccination coverage was low. We also found, however, that the impact of visits by Santa Claus when he had a communicable disease was markedly reduced when the contact of children with Santa Claus was limited. A reduction in the effectiveness of disease transmission could be achieved by Santa Claus minimising contact time during his distribution of presents and his adhering to standard precautions, including hand washing and wearing a mask.
We hope that Santa Claus will distribute only presents this year, not pathogens, and that his laughter is the only thing found to be infectious.
Box 1 – Simulated outbreaks of influenza with or without disease transmission by Santa Claus: number of infected people per 100 simulations of a population of 10 000 people
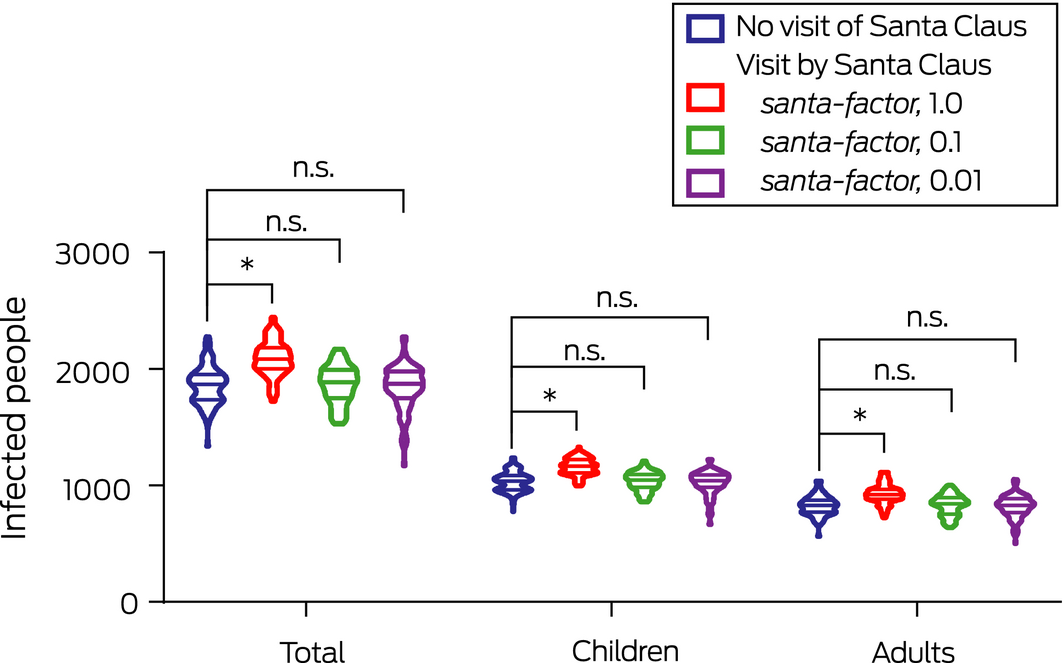
The violin plot shows the frequency distribution of the number of infected people in 100 simulations. The three horizontal lines in the plot indicate quartiles. * P < 0.001; n.s., not significant.
Box 2 – Numbers of infected people (A) and outbreak size (B) for 100 simulations of measles outbreaks, with or without disease transmission by Santa Claus, in a population of 10 000 people: 95% measles vaccination coverage (children) assumed
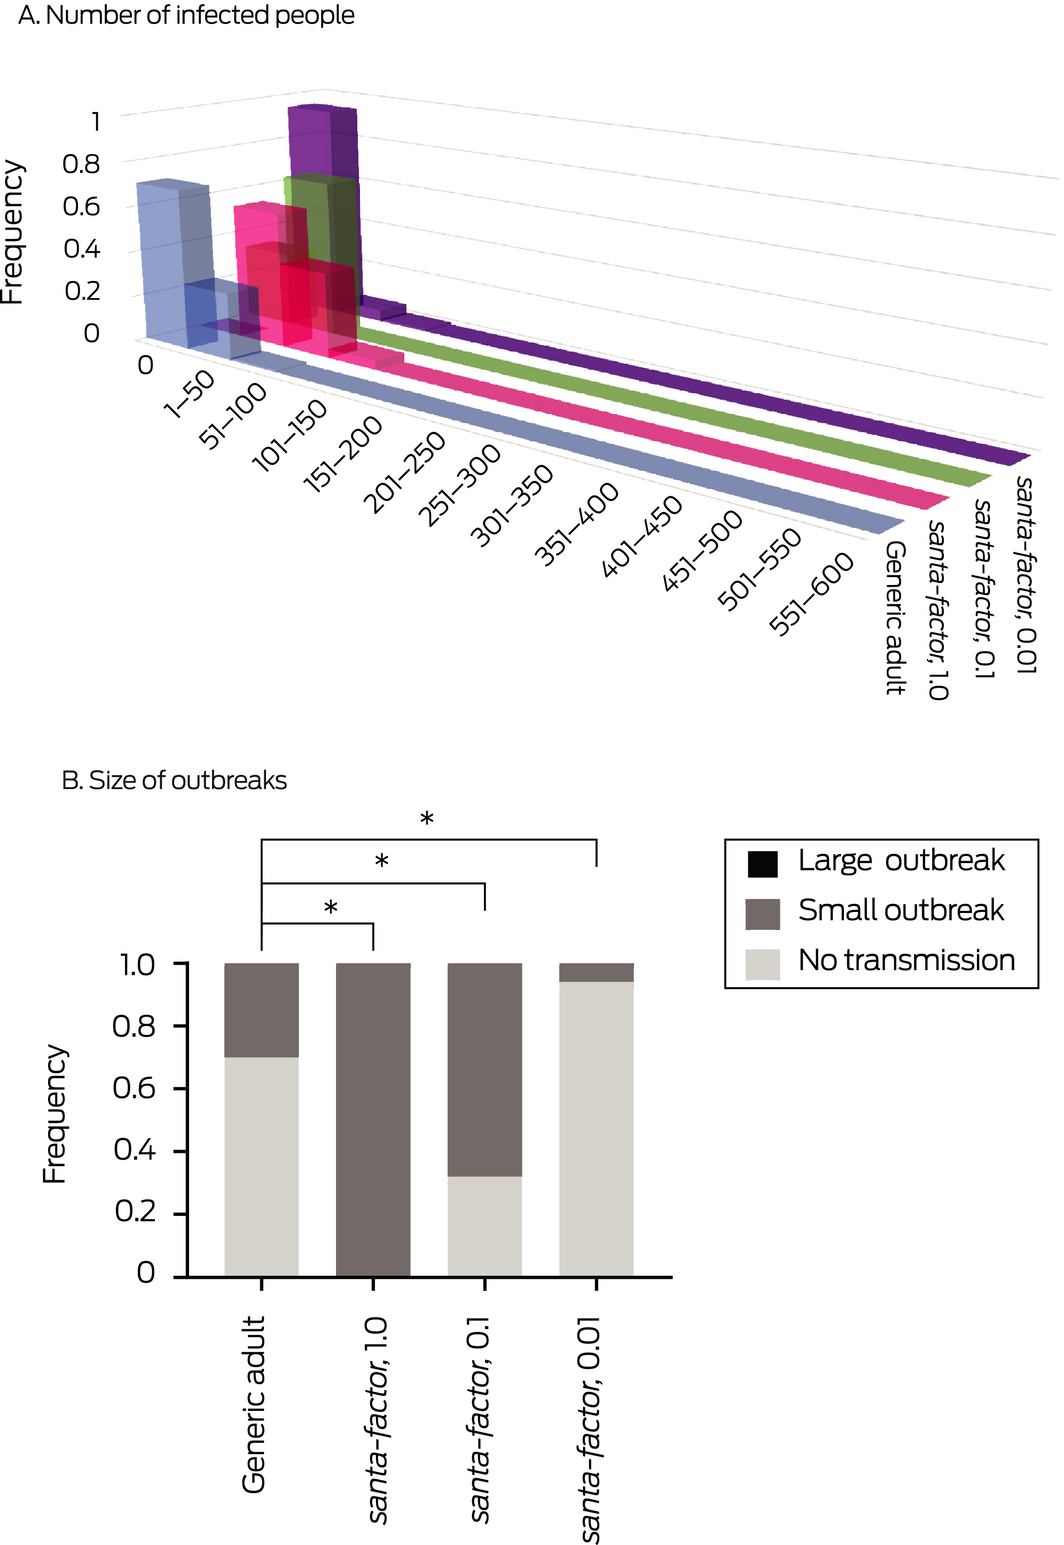
* P < 0.001. In panel A, “frequency” is the proportion of simulations with the number of infected people indicated on the lower scale. In panel B, “frequency” is the proportion of simulations of the indicated size: outbreaks with fewer than 150 infected people per 10 000 population were classified as small, those with at least 150 as large outbreaks.
Box 3 – Numbers of infected people (A) and outbreak size (B) for 100 simulations of measles outbreaks, with or without disease transmission by Santa Claus, in a population of 10 000 people: 85% measles vaccination coverage (children) assumed
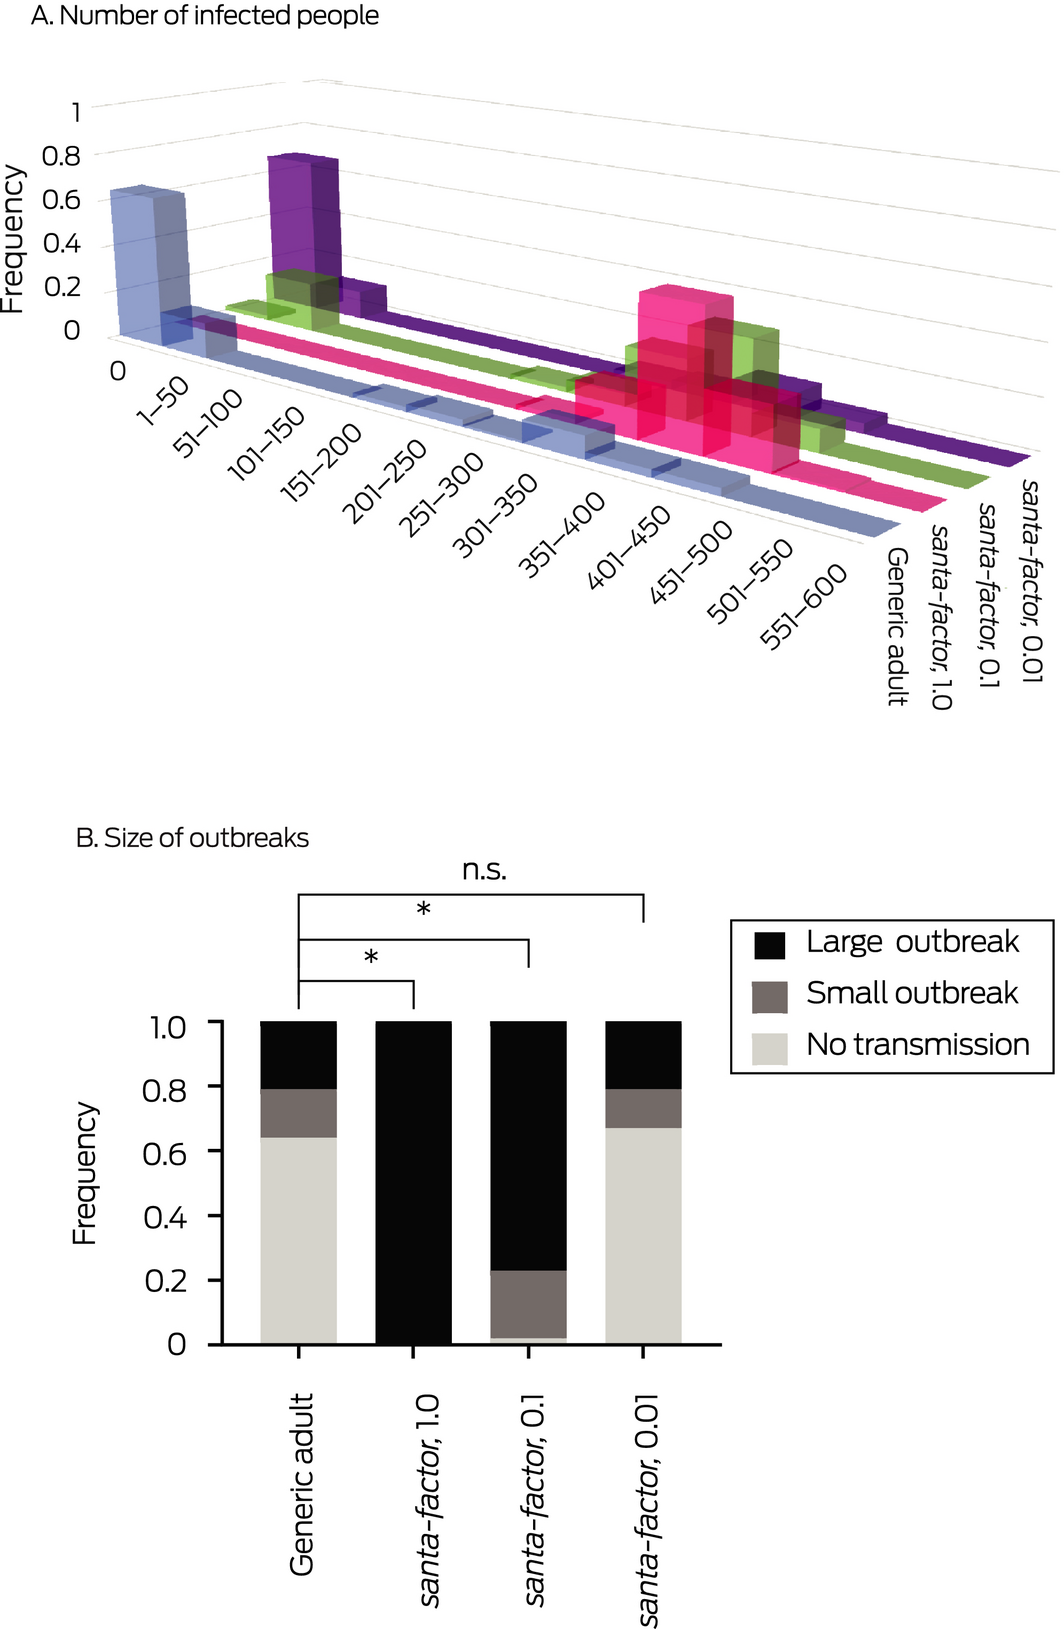
* P < 0.001; n.s., not significant. In panel A, “frequency” is the proportion of simulations with the number of infected people indicated on the lower scale. In panel B, “frequency” is the proportion of simulations of the indicated size: outbreaks with fewer than 150 infected people per 10 000 population were classified as small, those with at least 150 as large outbreaks.
Acknowledgements
This research was supported, in part, by the Leading Initiative for Excellent Young Researchers of the Ministry of Education, Culture, Sport, Science and Technology (Japan) and the Japan Society for the Promotion of Science (grant 16809810). I am grateful to the Summer Bootcamp of Infectious Disease Modelling at the Institute of Statistical Mathematics in Japan and the Summer Institute in Statistics and Modelling in Infectious Diseases at the University of Washington in the United States, where I learned the basics of infectious disease modelling.
References
- Park JJ, Coumbe BGT, Park EHG, et al. Dispelling the nice or naughty myth: Retrospective observational study of Santa Claus. BMJ 2016; 355: i6355.
- Paget J, Marquet R, Meijer A, van der Velden K. Influenza activity in Europe during eight seasons (1999–2007): an evaluation of the indicators used to measure activity and an assessment of the timing, length and course of peak activity (spread) across Europe. BMC Infect Dis 2007; 7: 141.
Costs of Delivering the Hep B PAST Model of Care in Remote Australia: A Retrospective Pre–Post Study
Hoa Nguyen, Anh Le Tuan Nguyen, Paula Binks, Melita McKinnon, Emily Vintour-Cesar, Karen Wills, Nicola Stephens, Benjamin Cowie, Joshua S. Davis, Yuejen Zhao, Peter Nihill, Julie A. Campbell, Andrew J. Palmer, Jane Davies, Barbara de Graaff
Buruli Ulcer Acquired From Ringtail Possum Rescue
Daniel P. O'Brien, Naomi Clarke, Sara Bonnici, Mohammad A. Hussain
Q Fever Visceral Abscesses After Contact With Native Australian Marsupials
Samantha J. Laws, Enzo Binotto, James Stewart, Jennifer Ho, Trent Yarwood, Josh Hanson, Simon Smith
Hospital-Admitted Injection-Related Infections Among Incarcerated People Who Inject Drugs in Australia: A Retrospective Cohort Study
Andrew Palmer, Matthew Carter, Jeremy Yeo, Cecilia Shim, Jason Connor, Jeremy Hayllar, Gerald Holtmann, Naomi Moy, Elliott G. Playford, Naomi Runnegar, Paul J. Clark
The Live Attenuated Influenza Vaccine in Australia: An Additional Tool for Influenza Prevention
Cyra Patel, Alexis Pillsbury, Tran Nguyen, Xia Wang, Helen E. Quinn, Clayton K. Chiu, Allen C. Cheng, Katie L. Flanagan, Zhicheng Wang
Reflex Testing for Hepatitis D Infection: A Unique Opportunity to Reduce Hepatitis D-Related Chronic Liver Disease Deaths in Australia
Jessica Howell, Lauren Andersson, Miriam T. Levy, James O'Beirne, Leon Adams, Katharine Irvine, Avik Majumdar, Golo Ahlenstiel, Kathy Jackson, Krispin Hajkowicz, Joseph Doyle, Jane Davies, Sarah Cherian, Wayne Dimech, Alexander J. Thompson