


The known: Traumatic spinal cord injury (TSCI) is often debilitating and life‐threatening.
The new: The crude and population‐adjusted incidence of TSCI did not change during 2007–2016. However, the incidence of TCSI in people aged 65 years or more increased by 5% per year, and the proportion of cases that involved incomplete tetraplegia also increased.
The implications: As the incidence of TSCI has not declined, primary prevention must be improved. The increasing number of TSCI events in older adults has implications for planning prevention, acute and post‐discharge care, and support activities.
While the worldwide incidence of traumatic spinal cord injury (TSCI) is low, its effects on individuals can be debilitating and life‐threatening.1 As the mortality associated with TSCI declines,2 the number of people living with the condition is increasing, contributing to significant social and economic costs.3 The total annual costs of TSCI in Australia is estimated to be $2 billion, including those of prolonged hospitalisation, long term care, equipment, and productivity losses.3
Despite evidence that the incidence of TSCI in adults has declined in Australia,4 rates may be underestimated because official statistics encompass only people admitted to dedicated spinal cord injury units. Accurate knowledge of the epidemiology of TSCI is essential for developing injury prevention strategies and providing health care and disability services. We therefore examined trends in the incidence and causes of hospitalisation for TSCI in all age groups in Victoria during 2007–2016.
Methods
We undertook a retrospective review of Victorian State Trauma Registry (VSTR) data for people who sustained TSCIs during January 2007 – December 2016. The state of Victoria (population, 6.1 million) established the Victorian State Trauma System during 2000–2003. It is an inclusive, regionalised system with one major trauma service for children (under 16 years of age) and two for adults, as well as a specialist spinal cord trauma centre for adults (the Victorian Spinal Cord Service at Austin Health).5
The population‐based VSTR collects data for all patients hospitalised in Victoria who meet any of the following criteria for major trauma:
- death after injury;
- an injury severity score (ISS) greater than 12 (calculated with the Abbreviated Injury Scale [AIS] 2005 – update 2008);
- admission to an intensive care unit (ICU) for more than 24 hours and requiring mechanical ventilation; or
- urgent surgery for intracranial, intrathoracic or intra‐abdominal injury, or for fixation of pelvic or spinal fractures.6
Definitions and data collection
TSCI was defined as an injury to the spinal cord with an AIS score of 4 or more, ensuring complete population coverage (given the VSTR inclusion criterion of an ISS exceeding 12). Cases of cauda equina and nerve root injury were excluded. Consistent with AIS codes, TSCIs were classified as complete or incomplete injuries in the cervical (subclassified: C3 or above, C4 or below), thoracic, or lumbar spine, with or without associated fractures or dislocations at the same level as the TSCI. Tetraplegia was defined as TSCI in the cervical spine, and paraplegia as TSCI in the thoracic or lumbar spine. AIS coding data were supplemented with information regarding the specific anatomic level of the injury and the type of incomplete cervical TSCI (central cord syndrome, other incomplete injury) derived from International Classification of Diseases, tenth revision, Australian modification (ICD‐10‐AM) coding. Isolated TSCI was defined as the absence of injuries with an AIS score greater than one in any other body region. TSCIs in patients injured outside Victoria were excluded from our analysis.
Patients’ postcodes of residence were mapped to the Accessibility/Remoteness Index of Australia (ARIA)7 and the Index of Relative Socio‐economic Advantage and Disadvantage (IRSAD).8 Comorbidity status was defined with the Charlson Comorbidity Index,9 mapped from ICD‐10‐AM codes.
Events were classified as transport‐related, low falls (falls from a standing position or from a height of one metre or less), high falls (from more than one metre), or being struck by or colliding with an object or another person (including interpersonal violence). After reviewing the free text for the injury event, events classified as collisions with objects could be further specified as diving into shallow water or as water sports‐related (including surfing and powered water sports).
WorkSafe Victoria and the Transport Accident Commission are the no‐fault, third party insurers for work and transport injuries in Victoria, reimbursing the costs of treatment, rehabilitation, income replacement, and long term support services.
Data analysis
Frequencies by sex, age group, and mechanisms of injury were compared in χ2 tests. Population crude incidence rates (with 95% confidence intervals [CIs]) were calculated for each year, based on the total population on June 30 of the corresponding year (source: Australian Bureau of Statistics). Age‐ and sex‐standardised incidence rates were calculated with the direct method.10 Rates were standardised for 5‐year age groups (to 85 years or more) using the 2011 Australian population as the population standard.11 Changes in crude incidence rates over the 10‐year period were assessed in individual Poisson regression models; data were checked for over‐dispersion (variance greater than the mean) to ensure that the assumptions of a Poisson distribution were met, and the incidence rate ratio (IRR) and its 95% CI were calculated. Trends in the proportion of cases of TSCI for which WorkSafe Victoria or the Transport Accident Commission provided compensation, in the profile of neurological impairment, and in the proportion of patients discharged to the state rehabilitation service for spinal cord injury, were each assessed in χ2 tests for trend. All analyses were conducted in Stata 14.2 (StataCorp); P < 0.05 was deemed statistically significant.
Ethics approval
Ethics approval was provided by the Human Research Ethics Committees (HRECs) of the Department of Health and Human Services (reference, DHHREC 11/14) and Monash University (reference, CF13/3040 – 2001000165), and by all trauma‐receiving hospitals.
Results
There were 706 cases of TSCI during 2007–2016, comprising 2.5% of all cases of major trauma recorded in the VSTR. The median age of the patients was 50 years (interquartile range, 31–68 years) and 560 were male (79%); comorbidity status, and residential socio‐economic status and remoteness were similar for male and female patients, but the median age of women was higher (Box 1).
Incidence
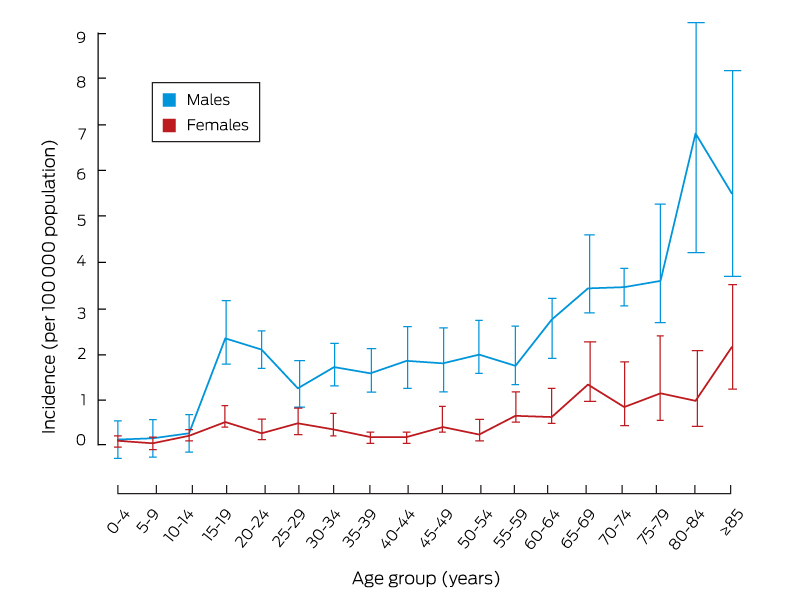
The overall crude incidence of TSCI was 1.26 (95% CI, 1.17–1.36) cases per 100 000 population, and did not change over the study period (IRR, 1.01; 95% CI, 0.99–1.04). The crude incidence of TSCI was higher among males (2.02 [95% CI, 1.86–2.20] cases per 100 000 population) than females (0.52 [95% CI, 0.44–0.61] cases per 100 000 population); it did not change over the study period for men (IRR, 1.01; 95% CI, 0.98–1.04) or women (IRR, 1.05; 95% CI, 0.99–1.11). The age‐ and sex‐standardised incidence of TSCI was 1.25 (95% CI, 1.21–1.30) cases per 100 000 population. The incidence among people aged 65 years or more increased across the study period by 5% per year (95% CI, 1–10%), but was stable in younger age groups (Box 2). Among people aged 15 years or more, the incidence of TSCI was higher for males than females at all ages (Box 3).
Mechanism of injury
Most cases of TSCI (673, 96%) were caused by unintentional incidents. The mechanism of injury was a transport‐related event in 269 cases (38%) and a low fall in 197 (28%). Eighteen TSCI cases (3%) resulted from diving into shallow water (14 at a beach, river or lake, four in pools), ten (1%) resulted from other water sport activities. One hundred and twenty cases of TSCI (17%) resulted from high falls, including 30 from ladders and 21 from roofs. A greater proportion of injuries in women than in men were caused by low falls (44% v 24%), while all 19 cases of being struck by a person and 48 of 51 cases of collisions with objects involved men (Box 4).
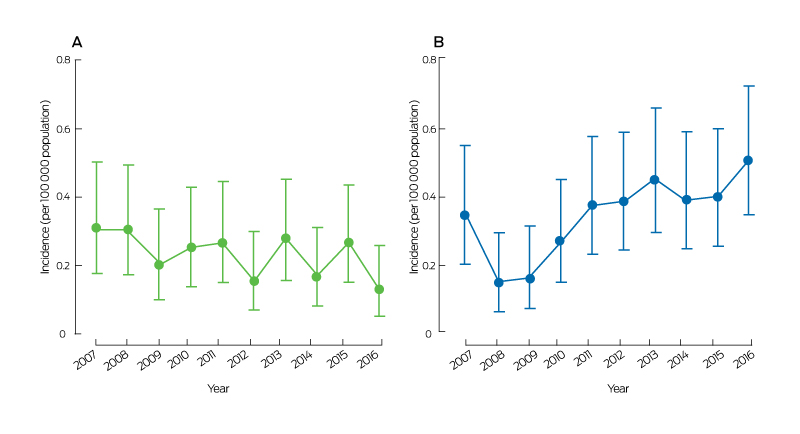
The proportion of TSCIs resulting from transport‐related events was greater among younger patients (0–15, 16–34 years) than older patients (Box 5). There were no statistically significant changes in the incidence of TSCI resulting from transport‐related events (Box 2), including motor vehicle‐related incidents (Box 6, A).
Of 197 TSCIs resulting from low falls, 123 involved people aged 65 or more (55% of TSCIs in this age group; 62% of all low fall‐related cases) (Box 5). While the incidence of TSCI resulting from high falls was steady, that for low falls increased by 9% per year (95% CI, 4–15% per year) (Box 2, Box 6, B). One hundred and sixty‐two of 197 patients (82%) with TCSIs resulting from low falls had isolated TSCI injuries (Box 7).
Profile of injury
Incomplete cervical spinal cord injuries comprised the largest group of TSCI by anatomic location (332 cases, 48%; Box 4), of which 161 of 221 cases of known injury type (73%) were classified as central cord syndrome (Supporting Information, table 1). The proportions of cases of incomplete cervical TSCI (65%), isolated spinal cord injury (82%), and cervical spinal cord injury without associated spinal column fractures or dislocations (44%) were each greatest for low falls, while the proportion of complete thoracic TSCI was greatest for high energy mechanisms (transport‐related events and high falls, each 24%; Box 7). The frequency of TSCI by anatomic site and age group is reported in the Supporting Information, table 2.
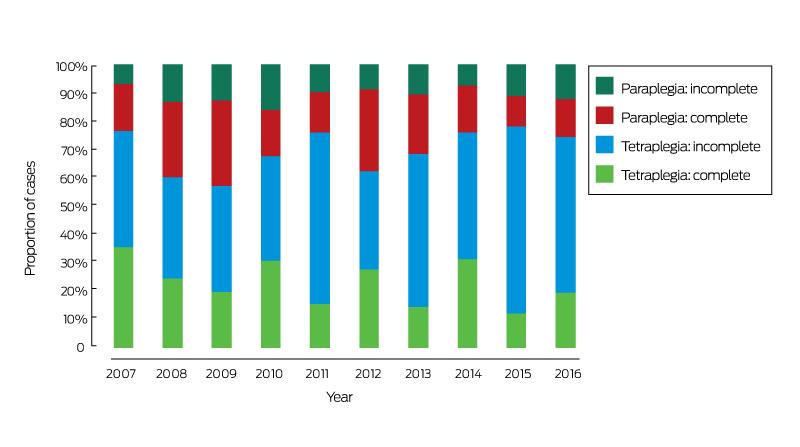
The incidence of complete TSCI declined by 5% per year (95% CI, 1–8%), while the incidence of incomplete TSCI increased by 6% per year (95% CI, 2–9%) (Box 2). More specifically, the proportions of complete tetraplegia (from 35% to 20%; P = 0.007) and complete paraplegia (from 18% to 13%; P = 0.034) declined, and that of incomplete tetraplegia increased (from 41% to 55%; P < 0.001) (Box 8).
The overall in‐hospital mortality rate was 15% (104 deaths), and was greatest for people aged 65 years or more (70 deaths, 31%) (Box 5). Of the patients who survived to hospital discharge, 477 (79%) were discharged to inpatient rehabilitation (Box 4), of whom 294 (62%) were discharged to the state spinal cord injury rehabilitation service (the Royal Talbot Rehabilitation Centre); the proportion referred to this service declined from 75% (38 patients) in 2007 to 52% in 2016 (28 patients). The proportion of patients who survived to hospital discharge who were discharged home was greater for incomplete than for complete TSCI (20% [75 patients] v 3% [six patients]; P < 0.001).
Injury compensation
The proportion of patients who received financial compensation for the costs of their injuries from WorkSafe or the Transport Accident Commission declined from 37% in 2007 (27 cases) to 16% in 2016 (13 cases) (P < 0.001).
Discussion
There was no change in the overall crude incidence of TSCI between 2007 and 2016, but the incidence of TSCI resulting from low falls increased by 9% per year, paralleled by a statistically significant increase in the proportion of incomplete tetraplegia TSCI cases.
The crude incidence of TSCI was 1.26 cases per 100 000 population, similar to figures reported for the Netherlands (1.40 per 100 000),12 Denmark (1.02 per 100 000),13 and Finland (1.38 per 100 000),14 but substantially lower than in the United States (5.4 cases per 100 000 population),15 perhaps reflecting higher rates of violence‐related TSCI in the US (particularly with firearms).16 Australia is recognised for its low levels of firearm‐related injury.17
Our finding that an increasing number of older adults (65 years or more) are sustaining TSCIs is consistent with those of other studies.14,15,18 It has been suggested that this reflects ageing populations,19 but we found that the incidence of TSCI in older adults increased by 5% per year after adjusting for population increases. It has been reported in the United Kingdom that both the number and the proportion of cases of major trauma in older adults are increasing rapidly, largely because of the increase in low fall event numbers.20 We similarly found that low falls were the most common cause of TSCI in older adults. Low falls, as the leading cause of injury‐related hospitalisations in Australia (2014–15: 198 576 people, 41% of injury‐related hospitalisations21), are a significant public health problem. The frequency of fall‐related spinal injuries in older adults has been attributed to a number of risk factors, including vulnerable spinal structure and anatomy (eg, spinal stenosis, pre‐existing spinal cord pathology), poor balance, reduced muscle strength, and polypharmacy.22 Continued efforts to avert falls are required, including group and home‐based exercise programs, as well as improved home safety and design,23 as most low falls happen in the home.24
TSCIs resulting from low falls were typically isolated, incomplete injuries to the cervical spine, often without an associated spinal column fracture or dislocation. Further, most cases of incomplete cervical spinal cord injury of known injury type were classified as central cord syndrome, which often impairs upper limb function more than mobility and reduces autonomy in activities of daily living. Older adults are often more susceptible to TSCI associated with reduced bone density and more severe spinal degeneration;25 multimorbidity and reduced physiological reserve may also exacerbate both the acute and long term effects of TSCI in these patients.26,27
While low energy mechanisms were the most common cause of TSCI in older adults, high energy events (transport‐related events, high falls) were the leading causes of TSCI in younger adults and children. Motor vehicle and motorcycle collisions remain key causes of TSCI, and their incidence did not decline over the 10‐year study period. Road safety interventions (improved vehicle design, passenger restraints, enforced speed limits, preventing drink‐ and drug‐impaired driving) have been associated with lower incidence of TSCI overseas.15 The specific mechanisms of spinal injury in motor vehicle crashes must be better understood if the incidence of transport‐related cases of TSCI is to be reduced. Protecting vulnerable road users should also be further emphasised, particularly as substantial increases in the number of seriously injured pedal cyclists have been reported.28 High falls accounted for 17% of all cases of TSCI, nearly half of which were from a ladder or roof. The incidence of ladder falls is increasing, and interventions that encourage avoiding risk, using safety equipment, and improving ladder setup have been recommended.29,30
Patients with spinal cord injuries face complex challenges during their care and recovery, including long stays in inpatient rehabilitation, high rates of hospital re‐admission, and substantial post‐discharge care needs.31,32,33 In our study, the proportion of patients who received compensation from no‐fault, third party insurers for work‐ and transport‐related spinal injury was lower in 2016 than in 2007, reflecting the concurrent increase in the proportion of low fall‐related and decline in that of transport‐related TCSI cases. This shift will increase the demand from patients under 65 on the recently established National Disability Insurance Scheme (NDIS) once it is fully implemented in late 2020. The NDIS does not provide support for people who acquire a disability at age 65 or older; these patients will need alternative types of support, such as that provided by the Home Care Packages program. Ensuring appropriate support for these patients is needed to optimise their recovery and function after a TSCI.33
Limitations
The key strength of our population‐based study is that it captured all cases of severe TSCI and was not limited to patients managed in dedicated spinal cord injury units. This is particularly important as only 58% of patients received definitive care at the dedicated spinal care centre. However, we did not have access to American Spinal Injury Association Impairment Scale data for classifying the extent of impairment, nor were we able to include pre‐hospital deaths, so we may have underestimated the incidence of TSCI. Changes in imaging practices (eg, magnetic resonance imaging) may have improved the ability to detect TSCI, a factor for which we could not account.
Conclusion
While TSCI cases comprise a small proportion of all cases of major trauma, their societal and economic impacts are profound. We found that the epidemiologic profile of TSCI has shifted, with an increasing number of TSCI events in older adults and a parallel increase in the proportion of patients with incomplete tetraplegia. Better primary prevention strategies are required to reduce the incidence of TSCI.
Box 1 – Demographic characteristics of patients who sustained traumatic spinal cord injuries in Victoria, 2007–2016, by sex
|
Characteristic |
Total |
Males |
Females |
P |
|||||||||||
|
|
|||||||||||||||
|
Number of patients |
706 |
560 |
146 |
|
|||||||||||
|
Age (years), median (IQR) |
50.0 (31.0–68.0) |
49.0 (31.0–68.0) |
58.5 (31.0–72.0) |
0.026 |
|||||||||||
|
Charlson Comorbidity Index |
|
|
|
0.68 |
|||||||||||
|
0 |
493 (69.8%) |
389 (69.5%) |
104 (71%) |
|
|||||||||||
|
≥ 1 |
213 (30.2%) |
171 (30.5%) |
42 (29%) |
|
|||||||||||
|
Index of Relative Socio‐economic Advantage and Disadvantage (quintiles) |
|
|
0.43 |
||||||||||||
|
1st (most disadvantaged) |
107 (15.7%) |
86 (16%) |
21 (15%) |
|
|||||||||||
|
2nd |
95 (14%) |
81 (15%) |
14 (9.8%) |
|
|||||||||||
|
3rd |
131 (19.2%) |
103 (19.1%) |
28 (20%) |
|
|||||||||||
|
4th |
152 (22.3%) |
114 (21.2%) |
38 (27%) |
|
|||||||||||
|
5th (least disadvantaged) |
197 (28.9%) |
155 (28.8%) |
42 (29%) |
|
|||||||||||
|
Missing data |
24 |
21 |
3 |
|
|||||||||||
|
Accessibility/Remoteness Index of Australia |
|
|
0.39 |
||||||||||||
|
Major cities |
463 (67.9%) |
361 (67.1%) |
102 (71%) |
|
|||||||||||
|
Inner or outer regional/remote |
219 (32.1%) |
177 (32.9%) |
42 (29%) |
|
|||||||||||
|
Missing data |
24 |
22 |
2 |
|
|||||||||||
|
|
|||||||||||||||
|
|
|||||||||||||||
Box 2 – Change in incidence of traumatic spinal cord injuries in Victoria, 2007–2016 (incidence rate ratio), by age group, mechanism of injury, and injury type
|
Characteristic |
Incidence rate ratio |
P |
|||||||||||||
|
|
|||||||||||||||
|
Age group (years) |
|
|
|||||||||||||
|
0–14 |
0.94 (0.81–1.08) |
0.38 |
|||||||||||||
|
15–34 |
0.98 (0.93–1.03) |
0.35 |
|||||||||||||
|
35–64 |
1.01 (0.97–1.05) |
0.68 |
|||||||||||||
|
≥ 65 |
1.05 (1.01–1.10) |
0.026 |
|||||||||||||
|
Mechanism of injury |
|
|
|||||||||||||
|
Transport‐related: motor vehicle |
0.95 (0.89–1.01) |
0.08 |
|||||||||||||
|
Transport‐related: motorcycle |
0.96 (0.89–1.14) |
0.35 |
|||||||||||||
|
Transport‐related: cyclist |
1.02 (0.92–1.12) |
0.75 |
|||||||||||||
|
Transport‐related: pedestrian |
0.96 (0.79–1.16) |
0.71 |
|||||||||||||
|
Low falls (≤ 1 m) |
1.09 (1.04–1.15) |
0.001 |
|||||||||||||
|
High falls (> 1 m) |
1.03 (0.97–1.10) |
0.33 |
|||||||||||||
|
Injury type |
|
|
|||||||||||||
|
Complete spinal cord injury |
0.95 (0.92–0.99) |
0.017 |
|||||||||||||
|
Incomplete spinal cord injury |
1.06 (1.02–1.09) |
0.001 |
|||||||||||||
|
|
|||||||||||||||
|
CI = confidence interval. ◆ |
|||||||||||||||
Box 4 – Characteristics of injuries and care for patients who sustained traumatic spinal cord injuries in Victoria, 2007–2016, by sex
|
Characteristic |
Total |
Males |
Females |
P |
|||||||||||
|
|
|||||||||||||||
|
Number of patients |
706 |
560 |
146 |
|
|||||||||||
|
Nature of injury‐causing incident |
0.77 |
||||||||||||||
|
Unintentional |
673 (96.1%) |
533 (96.0%) |
140 (96.6%) |
|
|||||||||||
|
Intentional |
27 (3.9%) |
22 (4.0%) |
5 (3%) |
|
|||||||||||
|
Missing data |
6 |
5 |
1 |
|
|||||||||||
|
Mechanism of injury |
|
|
|
< 0.001 |
|||||||||||
|
Transport‐related: motor vehicle |
131 (18.6%) |
90 (16%) |
41 (28%) |
|
|||||||||||
|
Transport‐related: motorcycle |
73 (10%) |
69 (12%) |
4 (3%) |
|
|||||||||||
|
Transport‐related: cyclist |
53 (7.5%) |
51 (9.1%) |
2 (1%) |
|
|||||||||||
|
Transport‐related: pedestrian |
12 (1.7%) |
10 (1.8%) |
2 (1%) |
|
|||||||||||
|
Low falls (≤ 1 m) |
197 (27.9%) |
133 (23.8%) |
64 (44%) |
|
|||||||||||
|
High falls (> 1 m) |
120 (17.0%) |
101 (18.0%) |
19 (13%) |
|
|||||||||||
|
Struck by or collided with person |
19 (2.7%) |
19 (3.4%) |
0 |
|
|||||||||||
|
Struck by or collided with object |
51 (7.2%) |
48 (8.6%) |
3 (2%) |
|
|||||||||||
|
Other |
50 (7.1%) |
39 (7.0%) |
11 (7.5%) |
|
|||||||||||
|
Anatomic site of injury |
0.33 |
||||||||||||||
|
Cervical: complete, C3 or above |
37 (5.3%) |
29 (5.3%) |
8 (6%) |
|
|||||||||||
|
Cervical: complete, C4 or below |
120 (17.3%) |
99 (18%) |
21 (15%) |
|
|||||||||||
|
Cervical: incomplete |
332 (47.8%) |
270 (48.9%) |
62 (43%) |
|
|||||||||||
|
Thoracic: complete |
113 (16.3%) |
89 (16%) |
24 (17%) |
|
|||||||||||
|
Thoracic: incomplete |
44 (6.3%) |
30 (5.4%) |
14 (9.8%) |
|
|||||||||||
|
Lumbar: complete |
19 (2.7%) |
14 (2.5%) |
5 (4%) |
|
|||||||||||
|
Lumbar: incomplete |
30 (4.3%) |
21 (3.8%) |
9 (6%) |
|
|||||||||||
|
Missing data |
11 |
8 |
3 |
|
|||||||||||
|
In‐hospital mortality |
104 (14.7%) |
87 (16%) |
17 (12%) |
0.24 |
|||||||||||
|
Definitive care hospital service level |
|
|
|
0.83 |
|||||||||||
|
Victorian Spinal Cord Service |
406 (57.5%) |
325 (58.0%) |
81 (56%) |
|
|||||||||||
|
Major trauma centre |
270 (38.2%) |
212 (37.9%) |
58 (40%) |
|
|||||||||||
|
Other |
30 (4.2%) |
23 (4.1%) |
7 (5%) |
|
|||||||||||
|
Discharge destination (for survivors to discharge) |
|
|
0.39 |
||||||||||||
|
Home |
84 (14%) |
66 (14%) |
18 (14%) |
|
|||||||||||
|
Rehabilitation |
477 (79.4%) |
378 (80.1%) |
99 (77%) |
|
|||||||||||
|
Other |
40 (6.7%) |
28 (5.9%) |
12 (9.3%) |
|
|||||||||||
|
Missing data |
1 |
1 |
0 |
|
|||||||||||
|
|
|||||||||||||||
|
IQR = interquartile range. ◆ |
|||||||||||||||
Box 5 – Mechanism of injury, neurological impairment, and deaths for 706 patients with traumatic spinal cord injuries in Victoria, 2007–2016, by age group
|
|
0–15 years |
16–34 years |
35–64 years |
≥ 65 years |
P |
||||||||||
|
|
|||||||||||||||
|
Number of patients |
23 |
192 |
268 |
223 |
|
||||||||||
|
Mechanism of injury |
|
|
|
|
< 0.001 |
||||||||||
|
Transport‐related |
17 (74%) |
100 (52%) |
102 (38%) |
50 (22%) |
|
||||||||||
|
Low falls (≤ 1 m) |
1 (4%) |
10 (5.2%) |
63 (24%) |
123 (55%) |
|
||||||||||
|
High falls (> 1 m) |
0 |
30 (16%) |
54 (20%) |
36 (16%) |
|
||||||||||
|
Struck by or collided with object |
2 (9%) |
23 (12%) |
23 (8.6%) |
3 (1%) |
|
||||||||||
|
Other |
3 (13%) |
29 (15%) |
26 (9.7%) |
11 (4.9%) |
|
||||||||||
|
Neurologic impairment |
< 0.001 |
||||||||||||||
|
Tetraplegia: complete |
5 (22%) |
40 (21%) |
54 (20%) |
60 (27%) |
|
||||||||||
|
Tetraplegia: incomplete |
10 (44%) |
56 (30%) |
144 (54%) |
122 (56%) |
|
||||||||||
|
Paraplegia: complete |
3 (13%) |
70 (37%) |
36 (14%) |
22 (10%) |
|
||||||||||
|
Paraplegia: incomplete |
5 (22%) |
22 (12%) |
33 (12%) |
15 (6.8%) |
|
||||||||||
|
Missing data |
0 |
4 |
1 |
4 |
|
||||||||||
|
Isolated spinal cord injury |
13 (56%) |
93 (48%) |
148 (55%) |
139 (62%) |
0.044 |
||||||||||
|
In‐hospital deaths |
2 (9%) |
8 (4%) |
24 (9.0%) |
70 (31%) |
< 0.001 |
||||||||||
|
|
|||||||||||||||
|
|
|||||||||||||||
Box 6 – Incidence (with 95% confidence intervals) of traumatic spinal cord injury resulting from A. motor vehicle collisions and B. low falls, Victoria, 2007–2016
Box 7 – Traumatic spinal cord injuries in Victoria, 2007–2016: injury profile, by mechanism of injury
|
|
Transport‐related |
Low falls |
High falls |
Struck by or collision with object |
Other |
P |
|||||||||
|
|
|||||||||||||||
|
Number of patients |
269 |
197 |
120 |
51 |
69 |
|
|||||||||
|
Anatomic site of injury |
< 0.001 |
||||||||||||||
|
Cervical: complete, C3 or above |
16 (6.1%) |
10 (5.2%) |
5 (4%) |
3 (6%) |
3 (4%) |
|
|||||||||
|
Cervical: complete, C4 or below |
47 (18%) |
33 (17%) |
15 (13%) |
15 (29%) |
10 (15%) |
|
|||||||||
|
Cervical: incomplete |
103 (39%) |
126 (65%) |
43 (36%) |
24 (47%) |
36 (54%) |
|
|||||||||
|
Thoracic: complete |
63 (24%) |
10 (5.2%) |
29 (24%) |
3 (6%) |
8 (12%) |
|
|||||||||
|
Thoracic: incomplete |
18 (6.8%) |
5 (3%) |
12 (10%) |
2 (4%) |
7 (10%) |
|
|||||||||
|
Lumbar: complete |
10 (3.8%) |
1 (0.5%) |
7 (6%) |
1 (2%) |
0 |
|
|||||||||
|
Lumbar: incomplete |
7 (3%) |
9 (5%) |
8 (7%) |
3 (6%) |
3 (4%) |
|
|||||||||
|
Missing data |
5 |
3 |
1 |
0 |
2 |
|
|||||||||
|
Isolated spinal cord injury |
105 (39%) |
162 (82%) |
52 (43%) |
34 (67%) |
40 (58%) |
< 0.001 |
|||||||||
|
Associated spinal column injury: cervical spinal cord injury |
|
|
|
|
0.001 |
||||||||||
|
No fracture or dislocation |
44 (28%) |
71 (44%) |
16 (26%) |
8 (22%) |
18 (42%) |
|
|||||||||
|
With fracture |
46 (29%) |
47 (29%) |
27 (44%) |
18 (49%) |
11 (26%) |
|
|||||||||
|
With dislocation |
9 (6%) |
10 (6.3%) |
1 (2%) |
2 (5%) |
2 (5%) |
|
|||||||||
|
With both fracture and dislocation |
59 (37%) |
32 (20%) |
18 (29%) |
9 (24%) |
12 (28%) |
|
|||||||||
|
Missing data |
10 |
2 |
9 |
5 |
8 |
|
|||||||||
|
Associated spinal column injury: thoracic spinal cord injury |
|
|
|
|
0.16 |
||||||||||
|
No fracture or dislocation |
5 (6%) |
2 (13%) |
4 (10%) |
0 |
3 (27%) |
|
|||||||||
|
With fracture |
42 (54%) |
11 (73%) |
19 (46%) |
2 (50%) |
8 (73%) |
|
|||||||||
|
With dislocation |
3 (4%) |
1 (7%) |
1 (2%) |
0 |
0 |
|
|||||||||
|
With both fracture and dislocation |
28 (36%) |
1 (7%) |
17 (42%) |
2 (50%) |
0 |
|
|||||||||
|
Missing data |
3 |
0 |
0 |
1 |
4 |
|
|||||||||
|
|
|||||||||||||||
|
|
|||||||||||||||
Received 8 August 2018, accepted 26 November 2018
- Ben Beck1
- Peter A Cameron1,2
- Sandra Braaf1
- Andrew Nunn1,3
- Mark C Fitzgerald2,4
- Rodney T Judson5,6
- Warwick J Teague6,7,8
- Alyse Lennox1
- James W Middleton9,10
- James E Harrison11
- Belinda J Gabbe1,12
- 1 Monash University, Melbourne, VIC
- 2 The Alfred Hospital, Melbourne, VIC
- 3 Victorian Spinal Cord Service, Austin Hospital, Melbourne, VIC
- 4 National Trauma Research Institute, Melbourne, VIC
- 5 Royal Melbourne Hospital, Melbourne, VIC
- 6 University of Melbourne, Melbourne, VIC
- 7 Royal Children's Hospital, Melbourne, VIC
- 8 Murdoch Children's Research Institute, Melbourne, VIC
- 9 Kolling Institute, University of Sydney, Sydney, NSW
- 10 Agency for Clinical Innovation, Sydney, NSW
- 11 Research Centre for Injury Studies, Flinders University, Adelaide, SA
- 12 Health Data Research UK, Swansea University Medical School, Swansea University, Swansea, United Kingdom
We thank the Victorian State Trauma Outcome Registry and Monitoring (VSTORM) group for providing Victorian State Trauma Registry data. We also thank Sue McLellan for her assistance with providing the data. The VSTR is funded by the Department of Health and Human Services, Victoria and the Transport Accident Commission. Ben Beck was supported by an Australian Research Council Discovery Early Career Researcher Award Fellowship (DE180100825). Peter Cameron was supported by a National Health and Medical Research Council Practitioner Fellowship (545926). Warwick Teague's role as director of trauma services was supported by a grant from the Royal Children's Hospital Foundation. Belinda Gabbe was supported by an Australian Research Council Future Fellowship (FT170100048).
No relevant disclosures.
- 1. Bickenbach JR, Officer A, Shakespeare T, et al. International perspectives on spinal cord injury. Geneva: World Health Organization; International Spinal Cord Society, 2013. http://apps.who.int/iris/bitstream/10665/94190/1/9789241564663_eng.pdf?ua=1 (viewed May 2017).
- 2. O'Connor PJ. Prevalence of spinal cord injury in Australia. Spinal Cord 2005; 43: 42–46.
- 3. Access Economics, for the Victorian Neurotrauma Initiative. The economic cost of spinal cord injury and traumatic brain injury in Australia. June 2009. http://www.spinalcure.org.au/pdf/Economic-cost-of-SCI-and-TBI-in-Au-2009.pdf (viewed May 2017).
- 4. Australian Institute of Health and Welfare. Spinal cord injury, Australia, 2014–15 (Cat. No. INJCAT 193; Injury Research and Statistics Series No. 113). Canberra: AIHW, 2018.
- 5. Department of Health and Human Services (Victoria). Victorian State Trauma System. 2018. https://www2.health.vic.gov.au/hospitals-and-health-services/patient-care/acute-care/state-trauma-system (viewed Jan 2019).
- 6. Cameron PA, Gabbe BJ, Cooper DJ, et al. A statewide system of trauma care in Victoria: effect on patient survival. Med J Aust 2008; 189: 546–550. https://www.mja.com.au/journal/2008/189/10/statewide-system-trauma-care-victoria-effect-patient-survival
- 7. Australian Bureau of Statistics. The Australian statistical geography standard (ASGS) remoteness structure. Updated Mar 2018. http://www.abs.gov.au/websitedbs/d3310114.nsf/home/remoteness+structure (viewed Jan 2019).
- 8. Australian Bureau of Statistics. 2033.0.55.001. Census of population and housing: Socio‐Economic Indexes for Areas (SEIFA), Australia, 2016: IRSAD. Mar 2018. http://www.abs.gov.au/ausstats/abs@.nsf/Lookup/by%20Subject/2033.0.55.001~2016~Main%20 (viewed Jan 2019).
- 9. Charlson ME, Pompei P, Ales KL, et al. A new method of classifying prognostic comorbidity in longitudinal studies: development and validation. J Chronic Dis 1987; 40: 373–383.
- 10. Australian Institute of Health and Welfare. Age‐standardised rate. METeOR Metadata Online Registry; Mar 2005. http://meteor.aihw.gov.au/content/index.phtml/itemId/327276 (viewed Sept 2016).
- 11. Australian Bureau of Statistics. 3101.0. Australian demographic statistics, Mar 2013. Sept 2013. http://www.abs.gov.au/AUSSTATS/abs@.nsf/DetailsPage/3101.0Mar%202013?OpenDocument (viewed Aug 2016).
- 12. Nijendijk JH, Post MW, Van Asbeck FW. Epidemiology of traumatic spinal cord injuries in The Netherlands in 2010. Spinal Cord 2014; 52: 258–263.
- 13. Bjørnshave Noe B, Mikkelsen EM, Hansen R, et al. Incidence of traumatic spinal cord injury in Denmark, 1990–2012: a hospital‐based study. Spinal Cord 2015; 53: 436–440.
- 14. Ahoniemi E, Alaranta H, Hokkinen E, et al. Incidence of traumatic spinal cord injuries in Finland over a 30‐year period. Spinal Cord 2008; 46: 781–784.
- 15. Jain NB, Ayers GD, Peterson EN, et al. Traumatic spinal cord injury in the United States, 1993–2012. JAMA 2015; 313: 2236–2243.
- 16. Lee B, Cripps R, Fitzharris M, et al. The global map for traumatic spinal cord injury epidemiology: update 2011, global incidence rate. Spinal Cord 2014; 52: 110–116.
- 17. Chapman S, Alpers P, Jones M. Association between gun law reforms and intentional firearm deaths in Australia, 1979–2013. JAMA 2016; 316: 291–299.
- 18. DeVivo MJ, Chen Y. Trends in new injuries, prevalent cases, and aging with spinal cord injury. Arch Phys Med Rehabil 2011; 92: 332–338.
- 19. Bárbara‐Bataller E, Méndez‐Suárez JL, Alemán‐Sánchez C, et al. Change in the profile of traumatic spinal cord injury over 15 years in Spain. Scand J Trauma Resusc Emerg Med 2018; 26: 27.
- 20. Kehoe A, Smith J, Edwards A, et al. The changing face of major trauma in the UK. Emerg Med J 2015; 32: 911–915.
- 21. Australian Institute of Health and Welfare. Trends in hospitalised injury, Australia 1999–00 to 2014–15 (Cat. No. INJCAT 190; Injury Research and Statistics Series No. 110). Canberra: AIHW, 2018.
- 22. Ambrose AF, Paul G, Hausdorff JM. Risk factors for falls among older adults: a review of the literature. Maturitas 2013; 75: 51–61.
- 23. Gillespie LD, Robertson MC, Gillespie WJ, et al. Interventions for preventing falls in older people living in the community. Cochrane Database Syst Rev 2012; CD007146.
- 24. Beck B, Cameron P, Lowthian J, et al. Major trauma in older persons. BJS Open 2018; 2: 310–318.
- 25. Fehlings MG, Tetreault L, Nater A, et al. The aging of the global population: the changing epidemiology of disease and spinal disorders. Neurosurgery 2015; 77 (Suppl 1): S1–S5.
- 26. Heffernan DS, Thakkar RK, Monaghan SF, et al. Normal presenting vital signs are unreliable in geriatric blunt trauma victims. J Trauma 2010; 69: 813–820.
- 27. Kehoe A, Smith J, Bouamra O, et al. Older patients with traumatic brain injury present with a higher GCS score than younger patients for a given severity of injury. Emerg Med J 2016; 33: 381–385.
- 28. Beck B, Cameron P, Fitzgerald MC, et al. Road safety: serious injuries remain a major unsolved problem. Med J Aust 2017; 207: 244–249. https://www.mja.com.au/journal/2017/207/6/road-safety-serious-injuries-remain-major-unsolved-problem
- 29. Ackland HM, Pilcher DV, Roodenburg OS, et al. Danger at every rung: epidemiology and outcomes of ICU‐admitted ladder‐related trauma. Injury 2016; 47: 1109–1117.
- 30. Cabilan C, Vallmuur K, Eley R, et al. Impact of ladder‐related falls on the emergency department and recommendations for ladder safety. Emerg Med Australas 2018; 30: 95–102.
- 31. Gabbe BJ, Nunn A. Profile and costs of secondary conditions resulting in emergency department presentations and readmission to hospital following traumatic spinal cord injury. Injury 2016; 47: 1847–1855.
- 32. Munce SE, Wodchis W, Guilcher SJ, et al. Direct costs of adult traumatic spinal cord injury in Ontario. Spinal Cord 2013; 51: 64–69.
- 33. Braaf SC, Lennox A, Nunn A, et al. Experiences of hospital readmission and receiving formal carer services following spinal cord injury: a qualitative study to identify needs. Disabil Rehabil 2018; 40: 1893–1899.
Abstract
Objective: To investigate trends in the incidence and causes of traumatic spinal cord injury (TSCI) in Victoria over a 10‐year period.
Design, setting, participants: Retrospective cohort study: analysis of Victorian State Trauma Registry (VSTR) data for people who sustained TSCIs during 2007–2016.
Main outcomes and measures: Temporal trends in population‐based incidence rates of TSCI (injury to the spinal cord with an Abbreviated Injury Scale [AIS] score of 4 or more).
Results: There were 706 cases of TSCI, most the result of transport events (269 cases, 38%) or low falls (197 cases, 28%). The overall crude incidence of TSCI was 1.26 cases per 100 000 population (95% CI, 1.17–1.36 per 100 000 population), and did not change over the study period (incidence rate ratio [IRR], 1.01; 95% CI, 0.99–1.04). However, the incidence of TSCI resulting from low falls increased by 9% per year (95% CI, 4–15%). The proportion of TSCI cases classified as incomplete tetraplegia increased from 41% in 2007 to 55% in 2016 (P < 0.001). Overall in‐hospital mortality was 15% (104 deaths), and was highest among people aged 65 years or more (31%, 70 deaths).
Conclusions: Given the devastating consequences of TSCI, improved primary prevention strategies are needed, particularly as the incidence of TSCI did not decline over the study period. The epidemiologic profile of TSCI has shifted, with an increasing number of TSCI events in older adults. This change has implications for prevention, acute and post‐discharge care, and support.