


The known: Opportunistic Q fever serosurveys in Australia suggest that it is underreported, but exposure histories have not been collected.
The new: The seroprevalence of antibody to Coxiella burnetii among 2740 blood donors was 3.7% in Hunter New England and 4.9% in Toowoomba. After adjusting for other risk factors, the risk of seropositivity was 2.5 times as high for people who had lived in rural areas for more than 3 months (but had had little contact with sheep, cattle or goats) as for people who had never lived rurally.
The implications: Exposure to multiple risk factors in rural communities means that Q fever vaccination should be considered for all rural residents.
The prevalence of Q fever, caused by Coxiella burnetii, is substantial in Australia despite the availability of a safe and effective vaccine. C. burnetii infects both wild and domestic animals and their ticks; humans are generally infected by inhaling the bacterium in droplets or dust, as the environmental resilience of C. burnetii facilitates transmission by wind and dust. Most infections (20–80%) are asymptomatic, but acute manifestations range from a self‐limiting influenza‐like illness to more severe pneumonia, hepatitis, endocarditis, and osteomyelitis;1 10–15% of patients experience a protracted post‐Q fever fatigue syndrome. Chronic Q fever, which may develop years after infection, is usually characterised by endocarditis, but may also include osteomyelitis and hepatitis.2 During 2013–2017, more than 2500 cases of Q fever were notified in Australia;3 studies have found that in 40–50% of notified cases patients were hospitalised for a median 4–6 days.4,5 A recent death linked to Q fever underscores the importance of preventing this infection.6
Notification data do not fully reflect the risk of infection because most acute infections are asymptomatic, and any symptoms are non‐specific, complicating the diagnosis of Q fever. The value of notification data for informing vaccination policy is further limited because data on the vaccination status, occupation, and exposure history of patients are not routinely collected.7 Infection risk can also be measured by serosurveys, but most Q fever serosurveys in Australia have been of occupational groups at high risk, such as abattoir workers or farmers.8,9 Localised outbreaks suggest that living or working near certain types of industry may also play a role.10 Three regional seroprevalence studies (two in Queensland, one in rural New South Wales) analysed sera collected for other laboratory tests,11,12,13 but the demographic information available was limited (age, sex, postcode), and there were no data on exposure history, occupation, or vaccination status (particularly important after the introduction of vaccination programs that target groups at high risk14). It therefore remains unclear which population groups are at risk and whether vaccination recommendations, which target people in direct contact with animals or their products, are adequate.
We conducted a large cross‐sectional study, in a purposively selected sample of blood donors in NSW and Queensland, to estimate the prevalence of C. burnetii antibody (as a measure of past exposure) and of C. burnetii DNA (as a measure of current infection and consequently of the risk of transmission via blood donation), with the goal of informing vaccination policy and other prevention strategies.
Methods
Study participants
We undertook a cross‐sectional study of blood donors aged 16–79 years who attended Australian Red Cross Blood Service collection centres in Brisbane and Sydney and in selected non‐metropolitan NSW and Queensland centres during October 2014 – June 2015. The non‐metropolitan centres — Toowoomba (Queensland) and Muswellbrook, Gloucester, Scone, Glen Innes, Guyra, Armidale and Tamworth (the Hunter New England district of NSW) — represented different risk settings in regions with high Q fever notification rates. On each day of recruitment, each donor (or the next available donor, as dictated by staff limitations) was approached to provide written consent for participation. Consenting donors completed a questionnaire that included questions about demographic details, Q fever vaccination status, diagnosis and knowledge, and exposure history (online Supporting Information); they also provided blood samples.
Sample size
Sample size determinations were related to our major aim, comparing the proportions of donors seropositive for phase II IgG antibodies to C. burnetii in metropolitan and non‐metropolitan regions. To detect a minimum 4.5 percentage point difference in seroprevalence (with 80% power, α = 0.05), assuming that prevalence in metropolitan regions did not exceed 5%, 900 sera from each non‐metropolitan area and 500 from the metropolitan regions in each state were required. Sampling was stratified by age group (16–24, 25–29, 30–39, 40–49, 50–59, 60–79 years) and sex.
Antibody assay for evidence of past exposure
Q fever serology testing was performed by the Australian Rickettsial Reference Laboratory in Geelong, Victoria. Sera were diluted 1:50 and tested for phase II IgG antibodies by indirect immunofluorescence.11
Molecular testing for detecting current infection
Polymerase chain reaction (PCR) detection of C. burnetii DNA was performed at the Australian Red Cross Blood Service Research and Development Laboratory in Brisbane, targeting the bacterial genes Com1 and IS1111a, with the RNA coliphage MS2 as internal control.15
Statistical analysis
Participants were allocated to metropolitan and non‐metropolitan groups by mapping their residential postcodes to 2011 Australian Statistical Geography Standard (ASGS) remoteness areas.16 Based on questionnaire responses regarding animal exposure, we identified participants for whom vaccination would be recommended by current guidelines.17
Age group‐specific and age‐ and sex‐standardised antibody seroprevalence was calculated by state and region; confidence intervals (CIs) were calculated using the normal approximation to the binomial method or the surveyfreq procedure (SAS 9.4) respectively. The 2011 census estimate of the Australian population aged 15–79 years served as the standard population.18
Factors associated with being antibody‐seropositive in univariate analyses (P < 0.10) were included in a multivariate logistic regression model generated by stepwise forward elimination; factors for which P < 0.05 after adjusting for sex and vaccination status were retained in the final model. To accommodate highly correlated factors, we employed a composite variable — living in a rural area for more than 3 months and contact with sheep, cattle or goats — in the regression analysis.
Statistical analyses were conducted in SAS 9.4 (SAS Institute).
Ethics approval
Ethics approval was obtained from the Blood Service Human Research Ethics Committee (reference, 2014#09) and the Sydney Children's Hospitals Network Human Research Ethics Committee (reference, LNR/14/SCHN/409).
Results
Study participants
Of 2898 donors approached, 2834 consented to completing the questionnaire (98%) and 2740 (94.5%) provided a blood sample adequate for analysis. Their median age was 43 years (interquartile range [IQR], 28–57 years); 1393 (51%) were men. Most participants (1816; 66%) had lived in a rural area for longer than 3 months at some point in their life, including 190 of 512 participants from metropolitan NSW (37%) and 227 of 493 from metropolitan Queensland (46%). Of those who had lived in rural areas, 975 of 1812 (54%; data missing for four participants) had lived on a farm with sheep, cattle or goats, and 900 of 1779 (51%; data missing for 37) had assisted at an animal birth.
Antibody assay: evidence of past exposure to C. burnetii
C. burnetii antibody was detected in 99 of 2740 samples (3.6%; 95% CI, 2.9–4.4%); seroprevalence was highest among 50–59‐year‐old people (5.6%; 95% CI, 3.6–7.6%; Box 1). The median ages of seropositive men (52 years; IQR, 41–59 years) and women (48 years; IQR, 37–59 years; P = 0.62) were similar. Only 11 of 28 participants (39%) who had been told by a general practitioner they had Q fever and 18 of 183 vaccinated participants (10%) were seropositive. Among the 62 seropositive participants who reported they had not been vaccinated, 40 (65%) were men, and 49 (79%) had had contact with sheep, cattle or goats on most days, or lived on a farm or worked with sheep, cattle or goats. However, 12 participants (19%) who were seropositive were not in risk groups recommended for vaccination; nine had lived in rural areas. Only seven of the 62 seropositive, unvaccinated participants (11%) had been told by a GP that they had Q fever.
Point estimates for age‐ and sex‐standardised seroprevalence were higher in non‐metropolitan than metropolitan regions of NSW and Queensland, but the difference was statistically significant only for Queensland (NSW: 3.7% [95% CI, 2.4–5.0%] v 2.8% [95% CI, 1.1–3.9%]; Queensland: 4.9% [95% CI, 3.5–6.3%] v 1.6% [95% CI, 0.5–2.8%]; Box 2). The results were similar when analysis was restricted to unvaccinated participants (data not shown).
All exposure‐related risk factors examined were significantly associated with being seropositive in the univariate analysis, except smoking, having lived overseas, and having lived adjacent to bushland (Box 3). Independent predictors of seropositivity after adjusting for vaccination status and sex were degree of contact with exposure to sheep, cattle, goats/ever lived rurally (P = 0.002), ever worked in an abattoir (P = 0.007), assisting at an animal birth (P = 0.012), and age (P = 0.019) (Box 3). Compared with people who had rarely or never had contact with sheep, cattle, goats and had never lived in a rural area for more than 3 months, people who had lived in a rural area for more than 3 months with only rare or no contact with sheep, cattle, goats were 2.5 times as likely (95% CI, 1.1–5.9) and those with contact most days 5.3 times as likely (95% CI, 2.1–14) to be seropositive. The odds of being seropositive were more than twice as high for people who had worked in an abattoir or assisted at an animal birth than for those who had not. For each 5‐year increase in age, the odds of being seropositive increased 9% (95% CI, 1–18%). After adjusting for independent predictors of seropositivity, vaccination status, and sex, there were no statistically significant association between seroprevalence, and contact with pigs (odds ratio [OR], 3.0; 95% CI, 1.0–8.6).
DNA testing: current infection with C. burnetii
We initially tested the non‐metropolitan samples, as they were more likely to be DNA‐positive than metropolitan samples. All 1681 samples were negative for C. burnetii DNA, and metropolitan samples were therefore not tested.
Awareness of Q fever and vaccination among people for whom vaccination is recommended
A greater proportion of people living in non‐metropolitan than in metropolitan regions had heard about Q fever and Q fever vaccination (Box 4). However, 471 of the 1510 participants in groups for whom vaccination is recommended (31%) had not heard of Q fever, and only 605 (40%) knew about vaccination, with the exception of abattoir workers: 174 of 200 (87%) were aware of Q fever, 134 of 200 (67%) knew about vaccination. In groups for whom vaccination is recommended, 158 of 1510 people (10%) had been vaccinated, and 158 of 605 people (26%) in these groups who knew about vaccination had been vaccinated. None of the 183 vaccinated participants had been diagnosed with Q fever after being vaccinated.
Discussion
Our study is the first to specifically assess the prevalence of C. burnetii antibody and DNA in Australian blood donors and to determine risk factors for antibody seropositivity. No current infections were detected in samples from non‐metropolitan regions, which suggests that the likelihood of blood donations from people with C. burnetii infections is low. Standardised antibody seroprevalence was higher in non‐metropolitan than in metropolitan regions of Queensland and NSW, but one in 36 Sydney donors (2.8%) were seropositive; further studies are needed to identify infection risks in this population, especially as only 37% had ever lived in rural areas.
The strongest independent predictors of antibody seropositivity were regular contact with sheep, cattle or goats, abattoir work, and assisting at an animal birth. Vaccination of people in these risk groups is already recommended, and their higher representation in non‐metropolitan areas at least partially explains regional differences in past exposure to C. burnetii. However, living in a rural area was the only identified risk factor for nine of 62 unvaccinated seropositive donors (14%). Further, having lived in a rural area, but with no or rare contact with sheep, cattle or goats, was itself an independent predictor of antibody seropositivity after accounting for the effects of other exposures. However, this factor needs to be examined in larger, more detailed studies, as well as in other rural areas, to determine the reasons for the increased risk.
Past exposure to C. burnetii is likely to be even more common than we found. First, antibody levels decline with time; only 10% of vaccinated participants and 39% of people with a history of Q fever in our study were seropositive. Seropositivity is therefore a poor marker of immunity, highlighting the importance of a good clinical history when screening for vaccination eligibility, as the performance of the skin test as a predictor of immunity also varies.9 Nevertheless, although 90% of vaccinated participants were seronegative, no‐one who had been vaccinated had been diagnosed with Q fever, consistent with reports of high vaccination effectiveness.19 Second, blood donors may not be representative of the general population, as they may be healthier and less likely to have been recently exposed to Q fever. This effect may explain why our estimates of antibody seroprevalence were lower than those reported in previous serosurveys based on convenience samples of de‐identified pathology specimens from similar geographic populations.11,13 In a study that employed the same antibody assay as our study, the estimated seroprevalence in the Hunter New England area was 7% (compared with 3.7% in our study), but was at least 11% for age groups beyond 19 years.11 Among Queenslanders aged 15 years or more, estimated seroprevalence was 8.8% in rural and 7.1% in metropolitan regions (compared with 4.9% and 1.6% in our study).13 However, the authors of the cited study used different laboratory methods and diluted sera 1:10 rather than 1:50, perhaps explaining the higher reported overall seroprevalence, but not the relatively higher metropolitan rate compared with our study. Differences in population sampling (geographic, age‐related, hospital v community participants) may also account for some of the differences.
Our analysis suggests that not all symptomatic cases of Q fever are notified. Four times as many cases of Q fever in men as in women were notified in Australia during 1991–2014,7 but we found that 1.6 times as many men as women were seropositive for antibody to C. burnetii. The difference may reflect a greater susceptibility of men to illness20 or a bias toward testing traditional occupational risk groups, in which men predominate. Further, we found that only seven of 62 unvaccinated participants (11%) who were seropositive had been diagnosed with Q fever. Even though the proportion of cases that are symptomatic varies,1 we would expect 40–50% of infections to be symptomatic; we therefore estimate that 29–39% of people with symptomatic Q fever were not diagnosed with the disease.
As reported in other Australian studies,5,21,22 we found that only 40% of people in groups for whom vaccination is recommended knew about the Q fever vaccine and only 10% had been vaccinated; even among those who knew about the vaccine, only 26% had been vaccinated. Targeted awareness campaigns (as currently underway in NSW)23 are needed, especially as the main reported reason for not being vaccinated was the perceived lack of risk.5,22 However, access to the vaccine can also be a problem.5,21,22 A new online training module for rural general practitioners23 should improve access and increase the number of early Q fever diagnoses, which may reduce the risk of chronic infection.24
Limitations
One strength of our study was the high participation rate; although our seroprevalence estimates may not be generalisable to other locations, they are likely to be accurate for the healthy adults residing in the regions assessed. The main limitation was that there were only 99 antibody‐positive sera; it was therefore difficult to assess independent associations between multiple, mostly correlated, risk factors and seroprevalence; for example, at least half the rural residents had also lived on a farm with sheep, cattle, goats, or assisted at an animal birth. Further, there were probably unmeasured risk factors that caused residual confounding. Whether exposure to pigs (serological evidence of exposure of pigs to C. burnetii has been reported)25 is an independent risk factor for infection needs to be investigated, and further studies will help better understand the risks for people in rural communities with little or no contact with animals. Finally, our study participants may not have been representative of the general population, and the questionnaire data were self‐reported.
Conclusion
While we did not detect any current Q fever infections, we did find evidence that past exposure to C. burnetii is common not only in groups recommended for vaccination but also among adults whose only risk factor appears to have been living in a rural area. More detailed studies are needed in rural communities to identify reasons for this increased risk. As we found that most rural donors were exposed to several risk factors, Q fever vaccination for all rural residents should be considered.
Box 1 – Age group‐specific seroprevalence (with 95% confidence intervals) of C. burnetii phase II IgG antibodies among donors attending selected Australian Red Cross Blood Service collection centres in New South Wales and Queensland,* 2014–2015
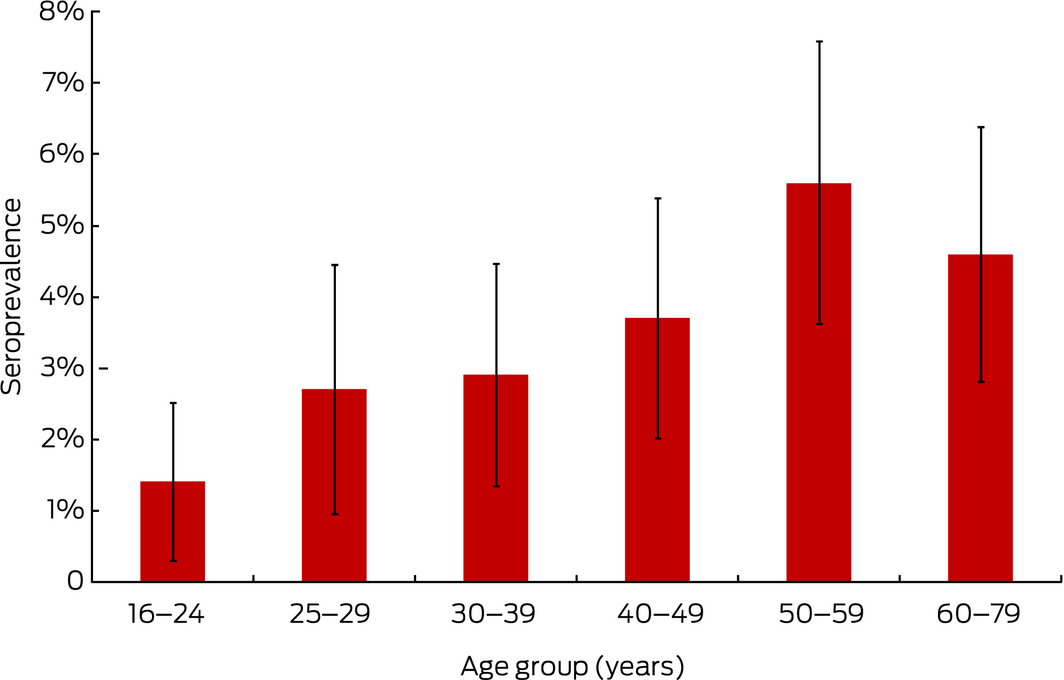
* See Methods for centres included in the study. The numbers of people in each age group are given in Box 3.
Box 2 – Age‐ and sex‐standardised seroprevalence (with 95% confidence intervals) of C. burnetii phase II IgG antibody by state and region of residence* among donors attending selected Australian Red Cross Blood Service collection centres in New South Wales and Queensland,† 2014–2015
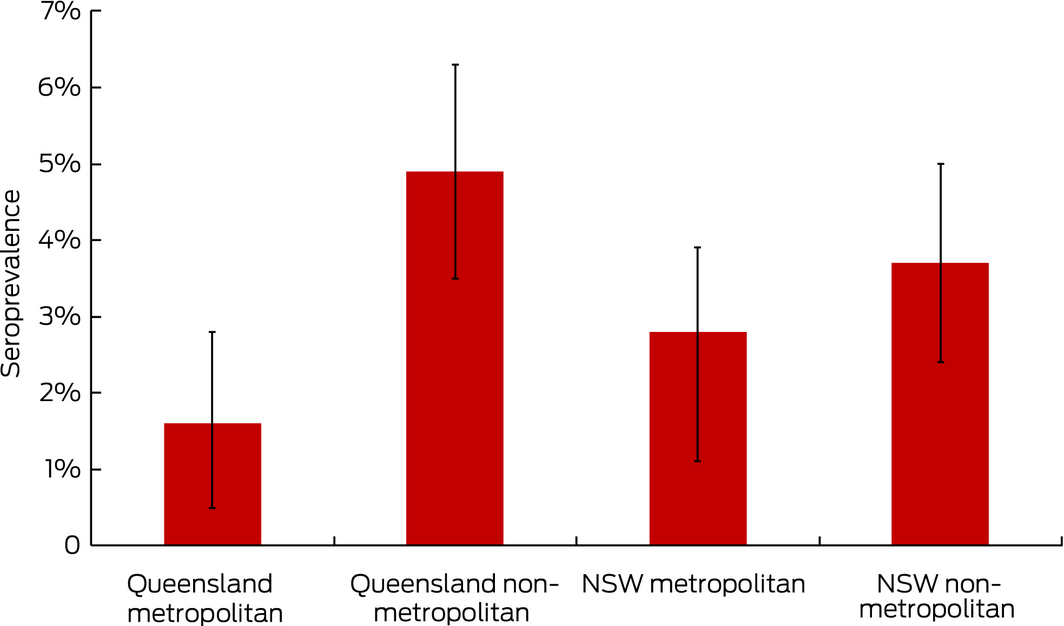
* Standardised to 2011 Australian census population.18 Metropolitan and non‐metropolitan assignment based on mapping postcode of residence to 2011 Australian Statistical Geography Standard remoteness areas.16 † See Methods for centres included in the study. Numbers of participants in each group: Queensland metropolitan, 493; Queensland non‐metropolitan, 882; NSW metropolitan, 512; NSW non‐metropolitan, 853.
Box 3 – Factors associated with C. burnetii phase II IgG antibody seropositivity among donors attending selected Australian Red Cross Blood Service collection centres in New South Wales and Queensland,* 2014–2015: univariate and adjusted multivariate logistic regression analyses
|
Variable† |
Total number |
Number positive |
Univariate analysis |
Multivariate analysis‡ |
|||||||||||
|
OR (95% CI) |
P |
aOR (95% CI) |
P |
||||||||||||
|
|
|||||||||||||||
|
Lived in a rural location for more than 3 months; sheep, cattle or goat contact |
|
< 0.001 |
|
0.002 |
|||||||||||
|
Never lived rurally; no/rare contact |
847 |
8 (0.9%) |
1 |
— |
1 |
— |
|||||||||
|
Rural; rare contact |
903 |
25 (2.8%) |
2.99 (1.34–6.66) |
0.007 |
2.51 (1.06–5.94) |
0.036 |
|||||||||
|
Rural; contact a few days each week |
616 |
33 (5.4%) |
5.94 (2.72–12.9) |
< 0.001 |
3.61 (1.48–8.81) |
0.005 |
|||||||||
|
Rural; contact most days of week |
297 |
29 (9.8%) |
11.4 (5.13–25.1) |
< 0.001 |
5.29 (2.07–13.5) |
< 0.001 |
|||||||||
|
Missing data |
77 |
4 (5%) |
NA |
|
|
|
|||||||||
|
Ever assisted or been present at the birth of a live or dead animal |
< 0.001 |
|
0.012 |
||||||||||||
|
No |
1685 |
29 (1.7%) |
1 |
— |
1 |
— |
|||||||||
|
Yes |
1000 |
66 (6.6%) |
3.16 (1.5–6.63) |
< 0.001 |
2.06 (1.20–3.55) |
0.009 |
|||||||||
|
Unsure |
52 |
4 (8%) |
4.76 (1.61–14.1) |
0.005 |
3.62 (1.15–11.4) |
0.027 |
|||||||||
|
Unknown |
3 |
0 |
NA |
|
|
|
|||||||||
|
Ever worked at an abattoir |
|
|
|
|
|
|
|||||||||
|
No |
2534 |
73 (2.9%) |
1 |
— |
1 |
— |
|||||||||
|
Yes |
200 |
24 (12.0%) |
4.53 (2.79–7.36) |
< 0.001 |
2.21 (1.24–3.94) |
0.007 |
|||||||||
|
Unknown |
6 |
1 (17%) |
NA |
|
|
|
|||||||||
|
Age (years)§ |
|
|
|
|
|
|
|||||||||
|
Per 5‐year increase |
2731 |
|
1.13 (1.06–1.21) |
< 0.001 |
1.09 (1.01–1.18) |
0.019 |
|||||||||
|
16–24 |
434 |
6 (1%) |
NA |
|
|
|
|||||||||
|
25–29 |
330 |
9 (3%) |
NA |
|
|
|
|||||||||
|
30–39 |
442 |
13 (2.9%) |
NA |
|
|
|
|||||||||
|
40–49 |
482 |
18 (3.7%) |
NA |
|
|
|
|||||||||
|
50–59 |
517 |
29 (5.6%) |
NA |
|
|
|
|||||||||
|
60–79 |
526 |
24 (4.6%) |
NA |
|
|
|
|||||||||
|
Unknown |
9 |
0 |
NA |
|
|
|
|||||||||
|
Q fever vaccination |
|
|
|
< 0.001 |
|
0.18 |
|||||||||
|
No |
1806 |
61 (3.4%) |
1 |
— |
1 |
— |
|||||||||
|
Yes |
183 |
18 (9.8%) |
3.07 (1.77–5.31) |
< 0.001 |
1.81 (0.97–3.41) |
0.06 |
|||||||||
|
Cannot recall |
708 |
18 (2.5%) |
0.73 (0.43–1.25) |
0.25 |
0.97 (0.54–1.74) |
0.93 |
|||||||||
|
Not answered |
43 |
1 (2%) |
NA |
|
|
|
|||||||||
|
Sex |
|
|
|
|
|
|
|||||||||
|
Men |
1393 |
62 (4.5%) |
1 |
— |
1 |
— |
|||||||||
|
Women |
1343 |
37 (2.8%) |
0.61 (0.4–0.92) |
0.017 |
0.84 (0.54–1.32) |
0.46 |
|||||||||
|
Not answered |
4 |
0 |
NA |
|
|
|
|||||||||
|
Highest level of direct contact (at any time in life) with pigs |
|
|
|
|
|||||||||||
|
Never |
2713 |
94 (3.5%) |
1 |
— |
1 |
— |
|||||||||
|
At least rarely |
26 |
5 (19%) |
6.63 (2.44–18.0) |
< 0.001 |
2.98 (1.03–8.64) |
0.07 |
|||||||||
|
Not answered |
1 |
0 |
NA |
|
|
|
|||||||||
|
Highest level of direct contact (at any time in life) with pond water |
0.011 |
|
0.14 |
||||||||||||
|
Never |
840 |
21 (2.5%) |
1 |
— |
1 |
— |
|||||||||
|
Rare |
988 |
29 (2.9%) |
1.18 (0.67–2.08) |
0.57 |
0.75 (0.41–1.38) |
0.36 |
|||||||||
|
Occasional |
421 |
26 (6.2%) |
2.57 (1.42–4.62) |
0.002 |
1.20 (0.63–2.30) |
0.58 |
|||||||||
|
At least a few days each week |
236 |
10 (4.2%) |
1.73 (0.8–3.72) |
0.16 |
0.47 (0.20–1.10) |
0.08 |
|||||||||
|
Not answered |
255 |
13 (5.1%) |
2.1 (1.03–4.25) |
0.04 |
0.79 (0.34–1.84) |
0.58 |
|||||||||
|
Ever handled animal manure/animal fertiliser |
|
0.009 |
|
0.21 |
|||||||||||
|
No |
1818 |
49 (2.7%) |
1 |
— |
1 |
— |
|||||||||
|
Yes |
888 |
49 (5.5%) |
2.45 (1.30–4.64) |
0.006 |
0.78 (0.36–1.67) |
0.52 |
|||||||||
|
Unsure |
24 |
1 (4%) |
2.07 (0.71–6.06) |
0.18 |
2.09 (0.68–6.44) |
0.20 |
|||||||||
|
Not answered |
10 |
0 |
NA |
|
|
|
|||||||||
|
Ever worked with animals other than sheep, cattle or goats |
|
|
|
|
|||||||||||
|
No |
2131 |
53 (2.5%) |
1 |
— |
1 |
— |
|||||||||
|
Yes |
566 |
42 (7.4%) |
3.14 (2.07–4.76) |
< 0.001 |
1.22 (0.74–2.03) |
0.44 |
|||||||||
|
Unknown |
43 |
4 (9.3%) |
NA |
|
|
|
|||||||||
|
Ever consumed unpasteurised milk or milk products |
|
< 0.001 |
|
0.53 |
|||||||||||
|
No |
948 |
20 (2.1%) |
1 |
— |
1 |
— |
|||||||||
|
Yes |
1102 |
64 (5.8%) |
2.86 (1.72–4.76) |
< 0.001 |
1.30 (0.72–2.36) |
0.38 |
|||||||||
|
Unsure |
680 |
15 (2.2%) |
1.04 (0.53–2.06) |
0.90 |
0.96 (0.47–1.97) |
0.91 |
|||||||||
|
Not answered |
10 |
0 |
NA |
|
|
|
|||||||||
|
Highest level of direct contact (at any time in life) with feral animals |
< 0.001 |
|
0.63 |
||||||||||||
|
Never |
1688 |
40 (2.4%) |
1 |
— |
1 |
— |
|||||||||
|
Rare |
689 |
28 (4.1%) |
1.74 (1.07–2.85) |
0.026 |
0.92 (0.53–1.59) |
0.77 |
|||||||||
|
At least occasionally |
253 |
22 (8.7%) |
3.92 (2.29–6.72) |
< 0.001 |
1.23 (0.62–2.43) |
0.55 |
|||||||||
|
Not answered |
110 |
9 (8%) |
3.67 (1.73–7.78) |
< 0.001 |
1.70 (0.60–4.80) |
0.32 |
|||||||||
|
Ever been involved in shooting/hunting/preparing hunted animals (excluding fish) |
|
|
|
||||||||||||
|
No |
1818 |
49 (2.7%) |
1 |
— |
1 |
— |
|||||||||
|
Yes |
888 |
49 (5.5%) |
2.09 (1.4–3.13) |
< 0.001 |
0.86 (0.53–1.41) |
0.55 |
|||||||||
|
Unsure |
24 |
1 (4%) |
NA |
|
|
|
|||||||||
|
Not answered |
10 |
0 |
NA |
|
|
|
|||||||||
|
Highest level of direct contact (at any time in life) with native animals |
0.002 |
|
0.67 |
||||||||||||
|
Never |
900 |
22 (2.4%) |
1 |
— |
1 |
— |
|||||||||
|
Rare |
1322 |
44 (3.3%) |
1.37 (0.82–2.31) |
0.23 |
0.94 (0.54–1.64) |
0.83 |
|||||||||
|
At least occasionally |
424 |
25 (5.9%) |
2.5 (1.39–4.49) |
0.002 |
0.78 (0.39–1.56) |
0.44 |
|||||||||
|
Not answered |
94 |
8 (8%) |
3.71 (1.6–8.59) |
0.002 |
1.60 (0.48–5.35) |
0.44 |
|||||||||
|
Highest level of direct contact (at any time in life) with pets |
|
|
|
|
|||||||||||
|
Not most days |
721 |
17 (2.4%) |
1 |
— |
1 |
— |
|||||||||
|
Most days |
1985 |
81 (4.1%) |
1.76 (1.04–2.99) |
0.027 |
1.09 (0.62–1.92) |
0.77 |
|||||||||
|
Not answered |
34 |
1 (3%) |
NA |
|
|
|
|||||||||
|
Born or lived in another country > 3 months |
|
|
|
|
|||||||||||
|
No |
2030 |
68 (3.3%) |
1 |
— |
|
|
|||||||||
|
Yes |
696 |
30 (4.3%) |
1.30 (0.84–2.01) |
0.24 |
|
|
|||||||||
|
Unknown |
14 |
1 (7%) |
NA |
|
|
|
|||||||||
|
Ever lived on a property that adjoined native bushland |
|
|
|
|
|||||||||||
|
No |
1887 |
60 (3.2%) |
1 |
— |
|
|
|||||||||
|
Yes |
810 |
36 (4.4%) |
1.41 (0.93–2.16) |
0.12 |
|
|
|||||||||
|
Unknown |
43 |
1 (2%) |
NA |
|
|
|
|||||||||
|
Smoking status |
|
|
|
0.18 |
|
|
|||||||||
|
Never |
1831 |
60 (3.3%) |
1 |
— |
|
|
|||||||||
|
Current |
144 |
4 (3%) |
0.84 (0.30–2.35) |
0.75 |
|
|
|||||||||
|
Previous |
737 |
35 (4.7%) |
1.47 (0.96–2.25) |
0.08 |
|
|
|||||||||
|
Not answered |
28 |
0 |
NA |
|
|
|
|||||||||
|
|
|||||||||||||||
|
aOR = adjusted odds ratio; CI = confidence interval; NA = not applicable; OR = odds ratio. * See Methods for centres included in the study. † Rarely, 1–5 times/year; occasionally, at least 6 times/year. ‡ Adjusted for vaccination status, sex, and variables significant in final model (living in rural area/sheep, goat, cattle contact; worked in abattoir, at birth of animal; age). § Data missing for nine participants. |
|||||||||||||||
Box 4 – Q fever knowledge and vaccination status among donors attending selected Australian Red Cross Blood Service collection centres in New South Wales and Queensland,* 2014–2015, in groups recommended for vaccination17
|
Participants, by risk group |
Total number |
Aware of Q fever |
Aware of vaccination |
Vaccinated |
|||||||||||
|
|
|||||||||||||||
|
Total number, metropolitan† |
1005 |
207 (21%) |
77 (8%) |
22 (2%) |
|||||||||||
|
Total number, non‐metropolitan† |
1735 |
1250 (72%) |
704 (41%) |
161 (9%) |
|||||||||||
|
Total number in groups recommended for vaccination‡ |
1510 |
1039 (69%) |
605 (40%) |
158 (10%) |
|||||||||||
|
Regular contact with sheep, cattle, goats§ |
1210 |
880 (73%) |
515 (43%) |
134 (11%) |
|||||||||||
|
Abattoir worker |
200 |
174 (87%) |
134 (67%) |
75 (38%) |
|||||||||||
|
Shooting/hunting/preparing hunted animals |
888 |
606 (68%) |
352 (40%) |
99 (11%) |
|||||||||||
|
Worked with animals other than sheep, cattle, goats |
566 |
426 (75%) |
276 (49%) |
87 (15%) |
|||||||||||
|
Native animal contact most days of the week |
54 |
34 (63%) |
23 (42%) |
9 (17%) |
|||||||||||
|
|
|||||||||||||||
|
* See Methods for centres included in the study. † Based on postcode of residence. ‡ Inclusion in more than one risk group possible. § Lived on a farm with sheep, cattle, goats; worked with sheep, cattle, goats; or had contact with sheep, cattle, goats most days of the week. |
|||||||||||||||
Received 3 July 2018, accepted 13 September 2018
- Heather F Gidding1,2
- Helen M Faddy3
- David N Durrheim4
- Stephen R Graves5
- Chelsea Nguyen5
- Penny Hutchinson6
- Peter Massey7,8
- Nicholas Wood2,9
- 1 Northern Clinical School, University of Sydney, Sydney, NSW
- 2 National Centre for Immunisation Research and Surveillance of Vaccine Preventable Diseases, Sydney, NSW
- 3 Australian Red Cross Blood Service, Brisbane, QLD
- 4 University of Newcastle, Newcastle, NSW
- 5 Australian Rickettsial Reference Laboratory, University Hospital Geelong, VIC
- 6 Darling Downs Public Health Unit, Toowoomba, QLD
- 7 Hunter New England Local Health District, Newcastle, NSW
- 8 University of New England, Armidale, NSW
- 9 University of Sydney, Sydney, NSW
This study was funded by a National Health and Medical Research (NHMRC) project grant (APP1049558). Heather Gidding and Nicholas Wood are supported by NHMRC fellowships. Australian governments fund the Australian Red Cross Blood Service for providing blood products and services to the Australian community. The funding bodies had no role in the study. We thank Blood Service Donor Services and Manufacturing staff who assisted with the study, participating donors, and Genevieve Dwyer, Thomas Allen, Megs Packer, Kate Laurie and Glen Shuttleworth for assisting with data collection. We also thank Thu Tran, Jesse Fryk, John Stenos and Gemma Vincent for assisting with and performing the laboratory testing.
No relevant disclosures.
- 1. Million M, Raoult D. Recent advances in the study of Q fever epidemiology, diagnosis and management. J Infect 2015; 71 Suppl 1: S2–S9.
- 2. Marmion BP, Storm PA, Ayres JG, et al. Long‐term persistence of Coxiella burnetii after acute primary Q fever. QJM 2005; 98: 7–20.
- 3. Australian Government Department of Health. National Notifiable Diseases Surveillance System, 2018. http://www9.health.gov.au/cda/source/rpt_4_sel.cfm (viewed Oct 2018).
- 4. Karki S, Gidding HF, Newall AT, et al. Risk factors and burden of acute Q fever in older adults in New South Wales: a prospective cohort study. Med J Aust 2015; 203: 438.e1–438.e6. https://www.mja.com.au/journal/2015/203/11/risk-factors-and-burden-acute-q-fever-older-adults-new-south-wales-prospective
- 5. Massey PD, Irwin M, Durrheim DN. Enhanced Q fever risk exposure surveillance may permit better informed vaccination policy. Commun Dis Intell 2009; 33: 41–45.
- 6. Lord H, Fletcher‐Lartey S, Weerasinghe G, et al. A Q fever cluster among workers at an abattoir in south‐western Sydney, Australia, 2015. Western Pac Surveill Response J 2016; 7(4): 21–27.
- 7. Sloan‐Gardner TS, Massey PD, Hutchinson P, et al. Trends and risk factors for human Q fever in Australia, 1991–2014. Epidemiol Infect 2017; 145: 787–795.
- 8. Taylor R, Hunter I, Tan R. Short report: prevalence of markers of exposure to Q fever in rural central Queensland. Commun Dis Intell Q Rep 2001; 25: 285–287.
- 9. Greig JE, Patel MS, Clements MS, Taylor NK. Control strategies for Q fever based on results of pre‐vaccination screening in Victoria, 1988 to 2001. Aust N Z J Public Health 2005; 29: 53–57.
- 10. van der Hoek W, Hunink J, Vellema P, Droogers P. Q fever in The Netherlands: the role of local environmental conditions. Int J Environ Health Res 2011; 21: 441–451.
- 11. Islam A, Ferguson J, Givney R, Graves S. Seroprevalence to Coxiella burnetii among residents of the Hunter New England region of New South Wales, Australia. Am J Trop Med Hyg 2011; 84: 318–320.
- 12. Parker N, Robson J, Bell M. A serosurvey of Coxiella burnetii infection in children and young adults in South West Queensland. Aust N Z J Public Health 2010; 34: 79–82.
- 13. Tozer SJ, Lambert SB, Sloots TP, Nissen MD. Q fever seroprevalence in metropolitan samples is similar to rural/remote samples in Queensland, Australia. Eur J Clin Microbiol Infect Dis 2011; 30: 1287–1293.
- 14. Gidding HF, Wallace C, Lawrence GL, McIntyre PB. Australia's national Q fever vaccination program. Vaccine 2009; 27: 2037–2041.
- 15. Stenos J, Graves S, Lockhart M. Coxiella burnetii. In: Schiuller M, Sloots TP, James G, et al. editors. PCR for clinical microbiology: an Australian and international perspective. London: Springer, 2010; pp. 145–148.
- 16. Australian Bureau of Statistics. 1270.0.55.001. Australian Statistical Geography Standard (ASGS). Volume 1. Main structure and Greater Capital City statistical areas, July 2011. Dec 2010. http://www.abs.gov.au/AUSSTATS/abs@.nsf/allprimarymainfeatures/9593E06A9325683BCA257FED001561EA?opendocument (viewed Oct 2018).
- 17. Australian Government Department of Health. The Australian immunisation handbook. Vaccine preventable diseases: Q fever. Updated June 2018. https://immunisationhandbook.health.gov.au/vaccine-preventable-diseases/q-fever (viewed Oct 2018).
- 18. Australian Bureau of Statistics. 3105.0.65.001. Australian historical population statistic, 2014. Sept 2014. http://www.abs.gov.au/ausstats/abs@.nsf/cat/3105.0.65.001 (viewed Oct 2018).
- 19. Gefenaite G, Munster JM, van Houdt R, Hak E. Effectiveness of the Q fever vaccine: a meta‐analysis. Vaccine 2011; 29: 395–398.
- 20. Tissot Dupont H, Raoult D, Brouqui P, et al. Epidemiologic features and clinical presentation of acute Q fever in hospitalized patients: 323 French cases. Am J Med 1992; 93: 427–334.
- 21. Lower T, Corben P, Massey P, et al. Farmers’ knowledge of Q fever and prevention approaches in New South Wales. Aust J Rural Health 2017; 25: 306–310.
- 22. Sellens E, Norris JM, Dhand NK, et al. Q fever knowledge, attitudes and vaccination status of Australia's veterinary workforce in 2014. PLoS One 2016; 11: e0146819.
- 23. Australian Council of Rural and Remote Medicine. Q fever early diagnosis and vaccination. 2018. http://www.acrrm.org.au/search/find-online-learning/details?id=11347&title=Q-Fever+-+Early+Diagnosis+and+Vaccination (viewed Oct 2018).
- 24. Kampschreur LM, Dekker S, Hagenaars JC, et al. Identification of risk factors for chronic Q fever, the Netherlands. Emerg Infect Dis 2012; 18: 563–570.
- 25. Cooper A, Goullet M, Mitchell J, et al. Serological evidence of Coxiella burnetii exposure in native marsupials and introduced animals in Queensland, Australia. Epidemiol Infect 2012; 140: 1304–1308.
Abstract
Objectives: To estimate the prevalence of exposure to the causative agent of Q fever (Coxiella burnetii) and of current infections among blood donors in Australia.
Design, setting: Cross‐sectional study in metropolitan Sydney and Brisbane, and in non‐metropolitan regions with high Q fever notification rates (Hunter New England in New South Wales; Toowoomba in Queensland).
Participants: Blood donors attending Red Cross collection centres during October 2014 – June 2015 who provided sera and completed a questionnaire on Q fever vaccination status, diagnosis and knowledge, and exposure history.
Main outcome measures: Age‐ and sex‐standardised seroprevalence of phase II IgG antibodies to C. burnetii (indicating past exposure) and independent risk factors for seropositivity; presence of C. burnetii DNA (indicating current infection and risk of transmission by blood transfusion).
Results: 2740 donors (94.5% response rate) completed the questionnaire and supplied sera for analysis. Crude antibody seroprevalence was 3.6%. Standardised seroprevalence was higher in non‐metropolitan than metropolitan regions (NSW, 3.7% v 2.8%; Queensland, 4.9% v 1.6%; statistically significant only in Queensland). Independent predictors of antibody seropositivity were regular contact with sheep, cattle, or goats (adjusted odds ratio [aOR], 5.3; 95% CI, 2.1–14), abattoir work (aOR, 2.2; 95% CI, 1.2–3.9), and assisting at an animal birth (aOR, 2.1; 95% CI, 1.2–3.6). Having lived in a rural area but having only rare or no contact with sheep, cattle or goats was itself a significant risk factor (v never lived rurally: aOR, 2.5; 95% CI, 1.1–5.9). 40% of people in groups recommended for vaccination were aware of the vaccine; 10% of people in these groups had been vaccinated. C. burnetii DNA was not detected in 1681 non‐metropolitan samples, suggesting that transmission by blood donation is unlikely.
Conclusions: Given their exposure to multiple risk factors, vaccination against Q fever should be considered for all rural residents.