


The known Treatment of people infected with human immunodeficiency virus (HIV) soon after diagnosis reduces the risk of transmission and HIV‐related morbidity. The proportion and characteristics of people who receive early treatment are not well described.
The new The proportion of patients attending major Australian sexual health clinics who started treatment within 6 months of diagnosis increased during 2004–2015 from 17% to 53%. The rise reflected changes in CD4+ cell count thresholds in treatment guidelines.
The implications Our findings provide a baseline for assessing the impact of early treatment for all newly diagnosed patients, regardless of CD4+ cell count.
The United Nations has set itself the ambitious goal of eliminating the epidemic of acquired immunodeficiency syndrome (AIDS) by 2030. Many countries are aiming to achieve this by striving for the “90–90–90” treatment target: 90% of people living with the human immunodeficiency virus (HIV) should know their status, 90% of people diagnosed with HIV infection should receive treatment, and 90% of treated people should achieve virological suppression.1 The evidence base for this major shift in the focus of prevention was provided by the 2011 HPTN 052 multicentre randomised controlled trial, in which the risk of HIV transmission to partners of heterosexual people who started treatment early (at CD4+ cell counts of 350–550 cells/μL) was 96% lower than for people for whom treatment was delayed (CD4+ count below 250 cells/μL).2 Further, observational studies of cohorts of same and opposite sex couples have found that HIV was not transmitted by people with sustained viral suppression,2,3 and community‐level studies have reported that greater treatment coverage is associated with lower incidence of HIV infections.4
Starting treatment during the early stages of infection was also found to be beneficial in the international Strategic Timing of Antiretroviral Treatment (START) randomised clinical trial.5 The 2016 Australian HIV management guidelines6 recommend initiating treatment as soon as possible after diagnosis, regardless of CD4+ cell count, in order to reduce the risk of morbidity (including Pneumocystis jiroveci pneumonia, cerebral toxoplasmosis, pulmonary tuberculosis, Kaposi sarcoma, and HIV wasting syndrome), and some local recommendations (eg, in New South Wales7) encourage initiating therapy within 6 weeks of diagnosis.
Until 2012, US guidelines recommended delaying the initiation of therapy, balancing immune preservation and virological suppression on the one hand and treatment‐related morbidity and mortality on the other. Until late 2007, antiretroviral treatment was recommended when the CD4+ cell count fell below 200 cells/μL.8 This threshold was raised when concerns about the toxicity of treatment eased, supported by large cohort studies that found clinical outcomes were improved when treatment commenced earlier (2008, fewer than 350 cells/μL in asymptomatic people;9 after 2009, fewer than 500 cells/μL10).
To monitor progress towards the 90–90–90 target at the population level, most countries measure coverage of HIV testing, treatment, and viral suppression with the “HIV care cascade” model, in which data from several cross‐sectional administrative data sources are compiled.11 In countries such as Australia, where HIV treatment coverage for people diagnosed with HIV infection is good (84%),12 such cascades do not assess the uptake of recommendations for initiating HIV treatment as soon as possible after diagnosis.13 Cascades do not provide detail on determinants of the rate of progression through the continuum of care, nor on predictors of the early initiation of treatment.
Few countries have established national systems for monitoring early initiation of treatment for people newly diagnosed with HIV infection.11 We analysed data from a national network of publicly funded sexual health clinics to determine trends in and predictors of early treatment of people newly diagnosed with HIV infection.
Methods
Setting and data source
Australia has a concentrated HIV epidemic: 70% of the approximately 1000 HIV diagnoses each year are in homosexually or bisexually active men (men who have sex with men, MSM).12,14 Annual community survey data indicate that HIV prevalence among gay men exceeds 7%.12,15 About half the infections in MSM newly diagnosed with HIV in NSW are detected by testing in sexual health clinics.16
We analysed data from sexual health clinics participating in the Australian Collaboration for Coordinated Enhanced Sentinel Surveillance of Sexually Transmissible Infections and Blood‐borne Viruses (ACCESS) program.17 ACCESS includes 44 of the largest sexual health clinics in Australia, with centres in all states apart from South Australia.18 The clinics collect data in computerised medical record systems as part of routine care; de‐identified line‐listed data are regularly transferred to the Kirby Institute in Sydney.
Patient cohort
Patients were included if the ACCESS program recorded that they were newly diagnosed with HIV infection between 1 January 2004 and 30 June 2015 (cohort censoring date: 31 December 2015). Patients were followed for a maximum of 183 days (6 months) after diagnosis. Patients were excluded from the primary analysis if their initial CD4+ cell count was not recorded, there was a record of HIV management at another service, or their CD4+ cell count was not monitored further and antiretroviral therapy was not commenced at the service within 390 days (one year, consistent with the international definition of “retention in care”,19 plus one month).
Study outcome
The primary outcome was early treatment, defined as antiretroviral therapy initiated within 183 days (6 months) of diagnosis with HIV infection. Treatment initiated after 6 months was defined as late treatment.
Variables included in the analysis
-
Demographic: Age, sex, remoteness of residence according to standard classifications (major cities, regional or remote areas),20 and country of birth (Australia/New Zealand, other).
-
Clinical:
-
CD4+ cell counts were analysed in two ways. First, the parameters CD4+ cell count at diagnosis (first CD4+ count after and within 90 days of diagnosis but before treatment) and nadir CD4+ cell count prior to treatment (lowest CD4+ cell count after diagnosis and before cohort censoring date or commencement of treatment, whichever was earlier) enabled us to measure the stage of disease at presentation and the extent of immunologic decline before treatment. Second, CD4+ cell counts were categorised as < 350 cells/μL, 350–499 cells/μL, ≥ 500 cells/μL.
-
Viral load at diagnosis was based on the log10 of viral load between 30 days before and after diagnosis (< 3.70, 3.70–4.59, 4.60–4.99, ≥ 5.00 log10 cells/mL). The viral load categories were defined so as to include approximately equal numbers of patients; missing values were assumed to be missing at random and imputed by multivariate ordinal logistic regression.
-
Other clinical variables were diagnoses at any time with hepatitis B (positive hepatitis B virus surface antigen test result) or with hepatitis C (positive hepatitis C virus antibody test result).
-
-
Risk:
-
Mode of HIV exposure: male‐to‐male sex, injecting drug use without male‐to‐male sex, heterosexual sex, other/unknown.
-
Risk group: recent male‐to‐male sex (in preceding 12 months), recent injecting drug use (in preceding 12 months), frequent male‐to‐male sex (more than 20 partners in 12 months or more than five partners in any 3 months of preceding year). The partner number criteria were consistent with Australian MSM sexually transmitted infection testing guidelines.21
-
-
Time period: The date of HIV infection diagnosis was grouped into four periods — 2004–2006, 2007–2009, 2010–2012, 2013–2015 — corresponding to changes in clinical guidelines, and ensuring that there were adequate numbers of diagnoses in each period for our analyses.
Statistical methods
Patient characteristics were tabulated by period of diagnosis. Differences in categorical covariates were assessed in χ2 tests; trends in median values were assessed with the Cuzick method.22
The probability of early treatment was assessed in mixed effects logistic regression models with robust variance calculations; “clinic” was included as a random effect because of the clustering of patient data by clinic. Univariate models for the variables listed above were fitted. Potential interactions between CD4+ cell count at diagnosis and demographic, clinical, or risk characteristics with respect to time to treatment were assessed in sensitivity analyses. The associations of covariates with the primary outcome were assessed in Wald tests.
The multivariate model included variables significant in univariate analyses (P < 0.05). Interaction terms were included to evaluate time period‐specific variations in outcomes associated with CD4+ cell count. Goodness of fit was assessed by computing Anscombe residuals by ordered covariate category (not reported). A reduced interaction model including CD4+ cell count and period of diagnosis assessed the effect of changes in guidelines. Predicted probability of early treatment was plotted by CD4+ cell count at diagnosis and time period. In a sensitivity analysis assessing bias associated with excluding patients lost to follow‐up, these patients were re‐classified as receiving “late treatment”. Analyses were conducted in Stata 14.2 (StataCorp).
Ethics approval
Ethics approval for ACCESS was granted by the human research ethics committees of St Vincent's Hospital, Sydney (reference, 08/51) and the University of New South Wales (reference, 8076); site‐specific assessment approvals were obtained from local research governance offices as required.
Results
Patient characteristics
During 2004–15, 917 people were newly diagnosed with HIV infection; their median age was 34 years (interquartile range [IQR], 27–43 years), 841 (91.7%) were men, 732 (81.9%) lived in major cities, and 520 (56.8%) were born in Australia or New Zealand. Thirty‐nine (4.3%) had prior hepatitis B diagnoses, and the proportions were similar across time periods (P = 0.62); 22 people (2.4%) had prior hepatitis C diagnoses, and the proportions were also similar across time (P = 0.55). Most patients (725, 79.1%) reported recent male‐to‐male sex (251 [27.4%] reported high risk status), and 119 (13.0%) reported injecting drug use (Box 1).
CD4+ cell count and viral load
The median overall CD4+ cell count at diagnosis was 510 cells/μL (IQR, 350–674 cells/μL), and was consistent across the study period (P = 0.93) (Box 2). The median count at diagnosis for patients excluded because they were lost to follow‐up was 510 cells/μL (IQR, 355–680 cells/μL). The proportion of people with CD4+ cell counts under 350 cells/μL (late diagnosis) was 22% in 2004–06, 27% in 2010–12, and 25% in 2013–15 (P = 0.34); the proportion with counts of 350–499 cells/μL was 23% in 2004–06, 29% in 2007–09, and 23% in 2013–15 (P = 0.18). The median nadir CD4+ cell count was 420 cells/μL (IQR, 290–570 cells/μL) and was consistent across periods (P = 0.56). The proportion of patients with log10 viral loads of 5 or more was 40% in 2004–06 and 26% in 2013–15 (P = 0.08) (Box 2).
Time to treatment
The proportion of people who commenced treatment within 6 months of diagnosis increased from 17% (15 patients) in 2004–06 to 53% (197 patients) in 2013–15 (P < 0.001); the median time to treatment fell from 816 days (IQR, 238–1642 days) in 2004–06 to 82 days (IQR, 35–266 days) in 2013–15. The proportion of patients who commenced treatment later than 6 months but during the study period was 22% in 2004–06 and 18% in 2013–15 (P = 0.48) (Box 2).
Predictors of early treatment
The likelihood of early treatment was significantly higher for people with lower CD4+ cell counts or higher log10 viral loads at diagnosis, and for those diagnosed during later time periods. Recent injecting drug use was associated with lower likelihood of early treatment (Box 3). In sensitivity analyses, there were no significant interactions between demographic characteristics or risk factors and CD4+ cell count at diagnosis (data not shown). In multivariate analyses, CD4+ cell count, viral load, and period of diagnosis were significantly associated with early treatment (Box 3).
Probability of early treatment
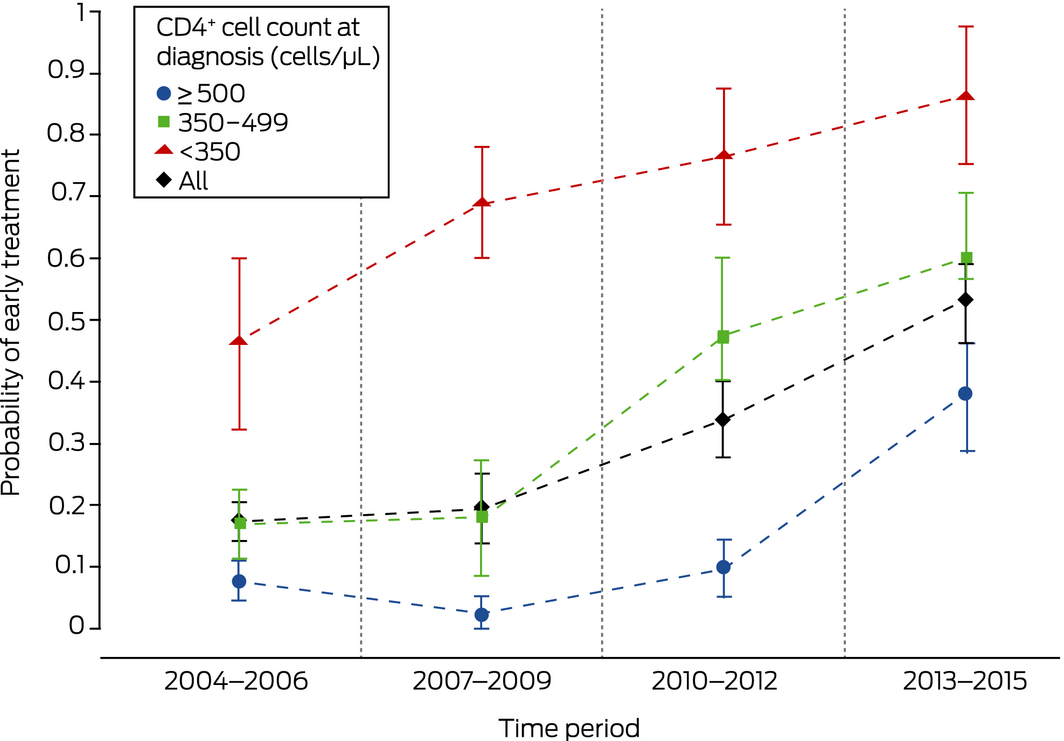
The probability of early treatment increased across time for all categories of CD4+ cell count at diagnosis: from the outset for people with counts below 350 cells/μL, from 2007–2009 for those with counts of 350–500 cells/μL, and from 2010–2012 for people with counts of at least 500 cells/μL. (Box 4). The results of a sensitivity analysis in which patients lost to follow‐up were classified as having started treatment late were similar (data not shown).
Discussion
The proportion of patients newly diagnosed at major Australian sexual health clinics with HIV infection for whom treatment commenced within 6 months of diagnosis increased during 2004–2015 from 17% to 53%. The probability of early treatment for patients presenting with CD4+ cell counts of 350–499 cells/μL increased steadily from 2007–2009, and the probability for patients with counts above 500 cells/μL increased rapidly during 2013–2015. These patterns are consistent with guideline changes during the 12‐year study period. In multivariate analyses, lower CD4+ cell count and higher viral load were associated with early treatment, as was being diagnosed more recently.
During 2004–2006, in keeping with then current treatment guidelines, patients with advanced infection (lower CD4+ cell count at diagnosis) were treated early, but treatment was deferred for those with less advanced disease. By 2013–2015, an increasing proportion of patients with higher CD4+ cell counts were receiving early treatment. Offering antiretroviral therapy to all patients with HIV infections has been recommended in Australia since June 2015.23 While the strength of evidence ratings for the influential US guidelines were upgraded in January 201624 and some Australian physicians will have anticipated the changes, the final period in our study included patients diagnosed before they were published. We therefore expect further increases in the median CD4+ cell count at diagnosis and the pre‐treatment nadir.
No socio‐demographic subgroups, risk factors, or comorbid condition included in our analysis were associated with early treatment after adjustment for CD4+ cell count, viral load and period of diagnosis. In Australia, HIV treatment is subsidised by the Pharmaceutical Benefits Scheme (PBS), relieving financial impediments to treatment, although co‐payments are required in some states. People who have recently migrated to Australia cannot routinely access the PBS; during the study period, an alternative access scheme that provided pharmaceutical company‐supported antiretroviral treatment to such individuals was established at certain sites.25 However, aspects not assessed by our study may have been associated with delayed treatment, such as stigma and other psychosocial factors that are associated with lower rates of treatment coverage and adherence.26,27
Limitations
First, the clinics in the ACCESS network may not be representative of all sexual health clinics in Australia, nor their clientele of all patients diagnosed in Australia with HIV infection. However, ACCESS includes most large Australian sexual health clinics, and therefore probably also most of the patients diagnosed at Australian sexual health clinics with HIV infections. Second, patients lost to follow‐up soon after diagnosis were excluded from analysis because of the insufficient data on treatment uptake. While loss to follow‐up can indicate disengagement from clinical care (and treatment not being initiated), some patients may have engaged with clinical care at other centres or returned to their home countries for care.28 The median CD4+ cell count of these patients was similar to that for the overall cohort, suggesting that their stage of disease at presentation was also similar. The results of a sensitivity analysis that regarded patients lost to follow‐up as not having received early treatment early were similar to those of the primary analysis.
Conclusion
The proportion of people newly diagnosed in sexual health clinics in Australia with HIV infection who received treatment within 6 months of diagnosis increased from 17% to 53% during 2004–2015, reflecting changes in the CD4+ cell count threshold in treatment guidelines. Our findings provide a baseline for assessing the impact of fully implementing the 2015 Australian guideline recommendations that all newly diagnosed patients should receive early treatment, regardless of CD4+ cell count. They also provide information that will help understand gaps in the cascade of care, including in the response to changes in guidelines, which was independent of patient socio‐demographic characteristics, risk factors, and clinical comorbidity.
Box 1 – Demographic characteristics of 917 patients newly diagnosed with HIV infections, 2004–2015, by period of diagnosis*
|
Characteristic |
2004–2006 |
2007–2009 |
2010–2012 |
2013–2015 |
Total |
||||||||||
|
|
|||||||||||||||
|
Number of patients |
88 |
174 |
283 |
372 |
917 |
||||||||||
|
Demographic characteristic |
|||||||||||||||
|
Age (years), median (IQR) |
37 (30–44) |
37 (29–44) |
33 (27–41) |
33 (26–42) |
34 (27–43) |
||||||||||
|
< 30 |
18 (20%) |
46 (26%) |
94 (33%) |
136 (37%) |
294 (32.1%) |
||||||||||
|
30–39 |
34 (39%) |
58 (33%) |
107 (38%) |
117 (32%) |
316 (34.5%) |
||||||||||
|
40–49 |
23 (26%) |
47 (27%) |
49 (17%) |
68 (18%) |
187 (20.4%) |
||||||||||
|
≥ 50 |
13 (15%) |
23 (13%) |
33 (12%) |
51 (14%) |
120 (13.1%) |
||||||||||
|
Sex (men) |
83 (94%) |
156 (89.7%) |
257 (90.8%) |
345 (92.7%) |
841 (91.7%) |
||||||||||
|
Remoteness |
|||||||||||||||
|
Major cities |
63 (72%) |
118 (69%) |
234 (84%) |
317 (88%) |
732 (81.9%) |
||||||||||
|
Regional/remote |
24 (28%) |
53 (31%) |
43 (16%) |
42 (12%) |
162 (18.1%) |
||||||||||
|
Missing data |
1 |
3 |
6 |
13 |
23 |
||||||||||
|
Place of birth |
|||||||||||||||
|
Australia or New Zealand |
67 (76%) |
106 (61%) |
157 (55.5%) |
190 (51.2%) |
520 (56.8%) |
||||||||||
|
Other |
21 (24%) |
68 (39%) |
126 (44.5%) |
181 (48.8%) |
396 (43.2%) |
||||||||||
|
Missing data |
0 |
0 |
0 |
1 |
1 |
||||||||||
|
Hepatitis B (ever; HBV surface antigen test) |
|||||||||||||||
|
No |
12 (14%) |
28 (16%) |
54 (19%) |
90 (24%) |
184 (20.1%) |
||||||||||
|
Yes |
4 (5%) |
8 (5%) |
15 (5.3%) |
12 (3.2%) |
39 (4.3%) |
||||||||||
|
No record |
72 (82%) |
138 (79%) |
214 (76%) |
270 (73%) |
694 (75.7%) |
||||||||||
|
Hepatitis C (ever; HCV antibody test) |
|||||||||||||||
|
No |
13 (15%) |
32 (18%) |
60 (21%) |
96 (26%) |
201 (21.9%) |
||||||||||
|
Yes |
3 (3%) |
4 (2%) |
9 (3%) |
6 (2%) |
22 (2.4%) |
||||||||||
|
No record |
72 (82%) |
138 (79%) |
214 (76%) |
270 (73%) |
694 (75.7%) |
||||||||||
|
Mode of exposure |
|||||||||||||||
|
Male‐to‐male sex |
48 (54%) |
75 (43%) |
82 (29%) |
102 (27%) |
307 (33.5%) |
||||||||||
|
Intravenous drug user |
14 (16%) |
25 (14%) |
31 (11%) |
45 (12%) |
115 (12.5%) |
||||||||||
|
Heterosexual |
9 (10%) |
26 (15%) |
38 (13%) |
44 (12%) |
117 (12.8%) |
||||||||||
|
Blood |
1 (1%) |
0 |
1 (0.4%) |
0 |
2 (0.2%) |
||||||||||
|
Missing data/other/unknown |
16 (18%) |
48 (28%) |
131 (46%) |
181 (49%) |
376 (41.0%) |
||||||||||
|
Risk group |
|||||||||||||||
|
Recent male‐to‐male sex |
66 (75%) |
131 (75%) |
227 (80%) |
301 (81%) |
725 (79.1%) |
||||||||||
|
Recent injecting drug use |
15 (17%) |
27 (16%) |
31 (11%) |
46 (12%) |
119 (13.0%) |
||||||||||
|
High risk status† |
4 (4%) |
40 (23%) |
91 (32%) |
116 (31%) |
251 (27.4%) |
||||||||||
|
|
|||||||||||||||
|
HBV = hepatitis B virus; HCV = hepatitis C virus; IQR = interquartile range. * Year category is based on year of first treatment or 183 days after diagnosis (whichever was earlier). † Defined as more than 20 partners over 12 months, or more than five partners over 3 months at any stage during preceding year. ◆ |
|||||||||||||||
Box 2 – Clinical characteristics of 917 patients newly diagnosed with HIV infections, 2004–2015, by period of diagnosis*
|
Characteristic |
2004–2006 |
2007–2009 |
2010–2012 |
2013–2015 |
Total |
||||||||||
|
|
|||||||||||||||
|
Number of patients |
88 |
174 |
283 |
372 |
917 |
||||||||||
|
CD4+ cell count at diagnosis (cells/μL), median (IQR)† |
520 (370–710) |
500 (370–694) |
510 (324–666) |
510 (350–659) |
510 (350–674) |
||||||||||
|
≥ 500 |
49 (56%) |
88 (51%) |
148 (52%) |
196 (53%) |
481 (52%) |
||||||||||
|
350–499 |
20 (23%) |
51 (29%) |
58 (20%) |
84 (23%) |
213 (23%) |
||||||||||
|
< 350 |
19 (22%) |
35 (20%) |
77 (27%) |
92 (25%) |
223 (24%) |
||||||||||
|
CD4+ cell count nadir (cells/μL), median (IQR) |
417 (295–571) |
440 (285–610) |
401 (270–550) |
430 (300–578) |
420 (290–570) |
||||||||||
|
Viral load at diagnosis (log10 cells/mL), median (IQR) |
4.93 (4.25–5.03) |
4.58(4.01–5) |
4.45(3.93–5.09) |
4.58(3.78–5.04) |
4.58(3.92–5.00) |
||||||||||
|
< 3.70 |
13 (18%) |
27 (19%) |
40 (17%) |
77 (23%) |
157 (20.1%) |
||||||||||
|
3.70–4.59 |
12 (16%) |
42 (29%) |
86 (37%) |
85 (25%) |
225 (28.8%) |
||||||||||
|
4.60–4.99 |
19 (26%) |
36 (25%) |
38 (16%) |
81 (25%) |
174 (22.3%) |
||||||||||
|
≥ 5.00 |
30 (40%) |
39 (27%) |
70 (30%) |
85 (26%) |
224 (28.7%) |
||||||||||
|
Missing data |
14 |
30 |
49 |
44 |
137 |
||||||||||
|
Time to treatment following diagnosis (days), median (IQR) |
816 (238–1642) |
592 (153–1243) |
266 (76–651) |
82 (35–266) |
216 (54–608) |
||||||||||
|
Within 6 months |
15 (17%) |
34 (20%) |
95 (34%) |
197 (53%) |
341 (37.2%) |
||||||||||
|
After 6 months but within study period |
19 (22%) |
48 (28%) |
61 (22%) |
68 (18%) |
196 (21.4%) |
||||||||||
|
Not started within study period |
54 (61%) |
92 (53%) |
127 (45%) |
107 (29%) |
380 (41.4%) |
||||||||||
|
|
|||||||||||||||
|
* Year category is based on year of first treatment or 183 days after diagnosis (whichever was earlier). † 139 patients were lost to follow‐up and therefore excluded from the analysis (median cell count at diagnosis, 510 cells/μL; IQR, 355–680 cells/μL). ◆ |
|||||||||||||||
Box 3 – Predictors of early treatment: mixed effects logistic regression models, with clinic as random effects covariate
|
Characteristic |
Univariate odds ratio (95% CI) |
P * |
P † |
Multivariate odds ratio (95% CI) |
P * |
P † |
|||||||||
|
|
|||||||||||||||
|
Age (v under 30 years) |
|
|
0.18 |
|
|
|
|||||||||
|
30–39 years |
0.93 (0.64–1.36) |
0.73 |
|
|
|
|
|||||||||
|
40–49 years |
0.81 (0.60–1.08) |
0.15 |
|
|
|
|
|||||||||
|
≥ 50 years |
1.01 (0.76–1.33) |
0.96 |
|
|
|
|
|||||||||
|
Sex (women) |
1.56 (0.97–2.50) |
0.06 |
0.06 |
|
|
|
|||||||||
|
Remoteness (v Major cities) |
|
|
0.16 |
|
|
|
|||||||||
|
Regional/remote |
0.93 (0.60–1.44) |
0.76 |
|
|
|
|
|||||||||
|
Missing |
0.52 (0.26–1.02) |
0.06 |
|
|
|
|
|||||||||
|
Born outside Australia or New Zealand |
1.34 (0.94–1.92) |
0.10 |
0.10 |
|
|
|
|||||||||
|
CD4+ cell count at diagnosis (v ≥ 500 cells/μL) |
|
|
< 0.001 |
|
|
< 0.001 |
|||||||||
|
350–499 cells/μL |
3.18 (2.29–4.41) |
< 0.001 |
|
2.30 (1.56–3.39) |
< 0.001 |
|
|||||||||
|
< 350 cells/μL |
14.2 (9.00–22.3) |
< 0.001 |
|
9.40 (3.81–23.2) |
< 0.001 |
|
|||||||||
|
Viral load at diagnosis (v log10 cells/mL < 3.7) |
|
|
< 0.001 |
|
|
0.007 |
|||||||||
|
3.70–4.59 |
1.17 (0.71–1.92) |
0.54 |
|
1.20 (0.69–2.08) |
0.52 |
|
|||||||||
|
4.60–4.99 |
1.49 (0.92–2.40) |
0.10 |
|
1.34 (0.96–1.87) |
0.09 |
|
|||||||||
|
≥ 5.00 |
2.36 (1.65–3.37) |
< 0.001 |
|
1.80 (1.23–2.65) |
0.003 |
|
|||||||||
|
Hepatitis B (ever)‡ |
1.27 (0.66–2.43) |
0.48 |
0.48 |
|
|
|
|||||||||
|
Hepatitis C (ever)§ |
0.98 (0.47–2.02) |
0.95 |
0.95 |
|
|
|
|||||||||
|
Mode of exposure (v male‐to‐male sex) |
|
|
0.11 |
|
|
|
|||||||||
|
Intravenous drug use |
0.63 (0.37–1.07) |
0.09 |
|
|
|
|
|||||||||
|
Heterosexual sex |
1.09 (0.64–1.86) |
0.76 |
|
|
|
|
|||||||||
|
Other |
1.50 (0.08–27.5) |
0.79 |
|
|
|
|
|||||||||
|
Missing data |
1.02 (0.70–1.49) |
0.91 |
|
|
|
|
|||||||||
|
Recent male‐to‐male sex |
0.71 (0.48–1.05) |
0.09 |
0.09 |
|
|
|
|||||||||
|
Recent intravenous drug use |
0.64 (0.45–0.92) |
0.017 |
0.017 |
|
|
|
|||||||||
|
High risk status¶ |
1.05 (0.84–1.30) |
0.69 |
0.69 |
|
|
|
|||||||||
|
Year of diagnosis (v 2004–06) |
|
|
|
|
|
< 0.001 |
|||||||||
|
2007–09 |
1.16 (0.83–1.61) |
0.40 |
|
0.29 (0.07–1.20) |
0.09 |
|
|||||||||
|
2010–12 |
2.46 (1.79–3.39) |
< 0.001 |
|
1.36 (0.78–2.37) |
0.27 |
|
|||||||||
|
2013–15 |
5.51 (3.86–7.88) |
< 0.001 |
|
8.01 (4.85–13.2) |
< 0.001 |
|
|||||||||
|
Interaction: year of diagnosis × CD4+ cell count at diagnosis |
|
|
|
|
|
0.001 |
|||||||||
|
2007–09 × 350–499 cells/μL |
|
|
|
9.34 (2.62–33.3) |
0.001 |
|
|||||||||
|
2007–09 × < 350 cells/μL |
|
|
|
3.85 (0.91–16.3) |
0.07 |
|
|||||||||
|
2010–12 × 350–499 cells/μL |
|
|
|
3.66 (1.74–7.68) |
0.001 |
|
|||||||||
|
2010–12 × < 350 cells/μL |
|
|
|
2.94 (1.37–6.31) |
0.006 |
|
|||||||||
|
|
|||||||||||||||
|
CI = confidence interval. * Wald test. † Wald test for homogeneity of categorical covariates. ‡ Based on hepatitis B surface antigen test or current diagnosis. § Based on hepatitis C virus antibody test or current diagnosis. ¶ Defined as more than 20 partners over 12 months, or more than five partners over 3 months at any stage during preceding year. Initial model included “missing data” as a category level (odds ratio, 0.82; 95% CI, 0.78–1.34), but was combined with “not high risk” category in final models. ◆ |
|||||||||||||||
Provenance: Not commissioned; externally peer reviewed.
Received 26 April 2018, accepted 1 November 2018
- Hamish McManus1
- Denton Callander1
- Basil Donovan1,2
- Darren B Russell3
- Catherine C O'Connor1
- Stephen C Davies4
- David A Lewis5
- Margaret E Hellard6
- Marcus Y Chen7
- Kathy Petoumenos1
- Rick Varma1,8
- Aaron Cogle9
- Mark Alastair Boyd10,11
- Andrew Grulich1
- James Pollard12
- Nick Medland1,7
- Christopher K Fairley7,13
- Rebecca J Guy1
- 1 The Kirby Institute, University of New South Wales, Sydney, NSW
- 2 Sydney Sexual Health Centre, Sydney Hospital, Sydney, NSW
- 3 Sexual Health Service Cairns, Cairns, QLD
- 4 Northern Sydney Sexual Health Service, Royal North Shore Hospital, Sydney, NSW
- 5 Western Sydney Sexual Health Centre, University of Sydney, Sydney
- 6 Centre for Population Health, Burnet Institute, Melbourne, VIC
- 7 Melbourne Sexual Health Centre, Alfred Health, Melbourne, VIC
- 8 Sydney Sexual Health Centre, South Eastern Sydney Local Health District, Sydney, NSW
- 9 National Association of People with HIV Australia, Melbourne, NSW
- 10 University of Adelaide, Adelaide, SA
- 11 Lyell McEwin Hospital, Adelaide, SA
- 12 University Hospital, Geelong, VIC
- 13 Melbourne Sexual Health Centre, Monash University Central Clinical School, Melbourne, VIC
No relevant disclosures.
- 1. UNAIDS. 2016 United Nations political declaration on ending AIDS sets world on the fast‐track to end of the epidemic by 2030 [media release]. 8 June 2016. http://www.unaids.org/en/resources/presscentre/pressreleaseandstatementarchive/2016/june/20160608_PS_HLM_PoliticalDeclaration (viewed June 2017).
- 2. Cohen MS, Chen YQ, McCauley M, et al. Prevention of HIV‐1 infection with early antiretroviral therapy. N Engl J Med 2011; 365: 493–505.
- 3. Bavinton BR, Jin F, Prestage G, et al. The Opposites Attract Study of viral load, HIV treatment and HIV transmission in serodiscordant homosexual male couples: design and methods. BMC Public Health 2014; 14: 917.
- 4. Das M, Chu PL, Santos GM, et al. Decreases in community viral load are accompanied by reductions in new HIV infections in San Francisco. PLoS One 2010; 5: e11068.
- 5. INSIGHT START Study Group; Lundgren JD, Babiker AG, Gordin F, et al. Initiation of antiretroviral therapy in early asymptomatic HIV infection. N Engl J Med 2015; 373: 795–807.
- 6. Australasian Society for HIV Medicine. HIV management in Australasia: a guide for clinical care. 2016. http://hivmanagement.ashm.org.au (viewed June 2017).
- 7. NSW Ministry of Health. NSW HIV strategy 2016–2020: quarter 4 and annual 2016 data report (NSW HIV Surveillance Data Reports). 2017. https://www.health.nsw.gov.au/endinghiv/Publications/q4-2016-annual-hiv-data-report.pdf (viewed June 2017).
- 8. DHHS Panel on Antiretroviral Guidelines for Adults and Adolescents. Guidelines for the use of antiretroviral agents in HIV‐1‐infected adults and adolescents. Oct 2006. Washington (DC): Department of Health and Human Services, 2006. https://aidsinfo.nih.gov/contentfiles/adultandadolescentgl000629.pdf (viewed June 2017).
- 9. DHHS Panel on Antiretroviral Guidelines for Adults and Adolescents. Guidelines for the use of antiretroviral agents in HIV‐1‐infected adults and adolescents. Dec 2007. Washington (DC): Department of Health and Human Services, 2007. http://aidsinfo.nih.gov/contentfiles/AdultandAdolescentGL000721.pdf (viewed June 2017).
- 10. DHHS Panel on Antiretroviral Guidelines for Adults and Adolescents. Guidelines for the use of antiretroviral agents in HIV‐1‐infected adults and adolescents. Dec 2009. Washington (DC): Department of Health and Human Services, 2009. https://aidsinfo.nih.gov/contentfiles/adultandadolescentgl001561.pdf (viewed June 2017).
- 11. Medland NA, McMahon JH, Chow EP, et al. The HIV care cascade: a systematic review of data sources, methodology and comparability. J Int AIDS Soc 2015; 18: 20634.
- 12. The Kirby Institute. HIV, viral hepatitis and sexually transmissible infections in Australia. Annual surveillance report 2016. Sydney: The Kirby Institute; UNSW Sydney, 2016. https://kirby.unsw.edu.au/report/annual-surveillance-report-hiv-viral-hepatitis-stis-2016 (viewed June 2017).
- 13. Medland NA, Chow EPF, McMahon JH, et al. Time from HIV diagnosis to commencement of antiretroviral therapy as an indicator to supplement the HIV cascade: dramatic fall from 2011 to 2015. PLoS One 2017; 12: e0177634.
- 14. Grulich AE, de Visser RO, Badcock PB, et al. Knowledge about and experience of sexually transmissible infections in a representative sample of adults: the Second Australian Study of Health and Relationships. Sex Health 2014; 11: 481–494.
- 15. Mao L, Holt M, Newman C, Treloar C. Annual report of trends in behaviour 2017: HIV and STIs in Australia. Sydney: Centre for Social Research in Health; UNSW Sydney, 2017. https://doi.org/10.4225/53/59faa5c891779 (viewed June 2018).
- 16. Callander D, Watchers‐Smith L, Moriera C, et al. The Australian Collaboration for Coordinated Enhanced Sentinel Surveillance of Sexually Transmissible Infections and Blood Borne Viruses. NSW HIV report 2007–2014. Sydney: UNSW Australia. https://kirby.unsw.edu.au/report/access-nsw-hiv-report-2007-2014 (viewed June 2017).
- 17. Callander D, Moreira C, El‐Hayek C, et al. Monitoring the control of sexually transmissible infections and blood‐borne viruses: protocol for the Australian Collaboration for Coordinated Enhanced Sentinel Surveillance (ACCESS). JMIR Res Protoc 2018; 7: e11028.
- 18. Australasian Chapter of Sexual Health Medicine; Royal Australasian College of Physicians. Register of public sexual health clinics in Australia and New Zealand. Sydney: RACP, 2016. https://www.racp.edu.au/docs/default-source/default-document-library/register-of-public-sexual-health-clinics.pdf?sfvrsn=e64a2d1a_10 (viewed June 2018).
- 19. Aberg JA, Gallant JE, Ghanem KG, et al. Primary care guidelines for the management of persons infected with HIV: 2013 update by the HIV Medicine Association of the Infectious Diseases Society of America. Clin Infect Dis 2014; 58: 1–10.
- 20. Australian Bureau of Statistics. 1270.0.55.006. Australian Statistical Geography Standard (ASGS): correspondences, July 2011: postcode 2012 to remoteness area 2011. June 2012. http://www.abs.gov.au/AUSSTATS/abs@.nsf/DetailsPage/1270.0.55.006July%202011?OpenDocument (viewed June 2017).
- 21. Templeton DJ, Read P, Varma R, Bourne C. Australian sexually transmissible infection and HIV testing guidelines for asymptomatic men who have sex with men 2014: a review of the evidence. Sex Health 2014; 11: 217–229.
- 22. Cuzick J. A Wilcoxon‐type test for trend. Stat Med 1985; 4: 87–90.
- 23. Australasian Society for HIV Medicine. When to start antiretroviral therapy in people with HIV. Aug 2015; updated Oct 2017. http://arv.ashm.org.au/clinical-guidance (viewed June 2018).
- 24. DHHS Panel on Antiretroviral Guidelines for Adults and Adolescents. Guidelines for the use of antiretroviral agents in HIV‐1‐infected adults and adolescents. Jan 2016. Washington (DC): Department of Health and Human Services, 2016. https://aidsinfo.nih.gov/contentfiles/adultandadolescentgl003412.pdf (viewed June 2017).
- 25. Petoumenos K, Watson J, Whittaker B, et al. Subsidized optimal ART for HIV‐positive temporary residents of Australia improves virological outcomes: results from the Australian HIV Observational Database Temporary Residents Access Study. J Int AIDS Soc 2015; 18: 19392.
- 26. Mocroft A, Lundgren JD, Sabin ML, et al. Risk factors and outcomes for late presentation for HIV‐positive persons in Europe: results from the Collaboration of Observational HIV Epidemiological Research Europe Study (COHERE). PLoS Med 2013; 10: e1001510.
- 27. Grierson J, Koelmeyer RL, Smith A, Pitts M. Adherence to antiretroviral therapy: factors independently associated with reported difficulty taking antiretroviral therapy in a national sample of HIV‐positive Australians. HIV Med 2011; 12: 562–569.
- 28. McMahon JH, Moore R, Eu B, et al. Clinic network collaboration and patient tracing to maximize retention in HIV care. PLoS One 2015; 10: e0127726.
Abstract
Objectives: To determine trends in and predictors of early treatment for people newly diagnosed with human immunodeficiency virus (HIV) infection in Australia.
Design, setting: Retrospective cohort analysis of routinely collected longitudinal data from 44 sexual health clinics participating in the Australian Collaboration for Coordinated Enhanced Sentinel Surveillance (ACCESS) program.
Participants: Patients diagnosed with HIV infections, January 2004 – June 2015.
Main outcome measures: Commencement of antiretroviral therapy within 6 months of HIV diagnosis (early treatment); demographic, clinical, and risk group characteristics of patients associated with early treatment; trends in early treatment, by CD4+ cell count at diagnosis.
Results: 917 people were diagnosed with HIV infections, their median age was 34 years (interquartile range [IQR]: 27–43 years), and 841 (92%) were men; the median CD4+ cell count at diagnosis was 510 cells/μL (IQR, 350–674 cells/μL). The proportion of patients who received early treatment increased from 17% (15 patients) in 2004–06 to 20% (34 patients) in 2007–09, 34% (95 patients) in 2010–12, and 53% (197 patients) in 2013–15 (trend, P < 0.001). The probability of early treatment, which increased with time, was higher for patients with lower CD4+ cell counts and higher viral loads at diagnosis.
Conclusions: The proportion of people newly diagnosed with HIV in sexual health clinics in Australia who received treatment within 6 months of diagnosis increased from 17% to 53% during 2004–2015, reflecting changes in the CD4+ cell count threshold in treatment guidelines. Nevertheless, further strategies are needed to maximise the benefits of treatment to prevent viral transmission and morbidity.