


The known The format, content and conduct of medical handovers by hospital doctors are receiving increasing attention from health care policymakers.
The new In the first study to formally document the frequency of references to patients’ cultural heritage during medical handovers and in hospital medical records, we found that, after adjusting for demographic, socio‐economic and medical factors, Aboriginal patients were significantly more frequently identified than patients with other ethnic–national backgrounds.
The implications In an era of increasing cultural awareness, our results highlight inconsistencies in identifying the cultural heritage of patients when transferring clinical information. Research and community consultation should assist understanding the reasons for this practice.
Ethnicity, national heritage, and religion are universal social concepts that are important for individual and societal identity. How these concepts should be integrated into modern medical practice, particularly during the time‐sensitive clinical handover, is contentious; the relevance of ethnicity — “shared identity or similarity of a group of people on the basis of one or more factors”1 — during medical handover or in case presentations has been challenged by some authors.2,3,4 The question is significant, given the estimated seven million clinical handovers each year in Australian hospitals5 and the increased interest of health care policymakers in determining what constitutes an appropriate clinical handover.6,7 The time constraints of clinical practice mean it is crucial that clinical handover is succinct and clinically pertinent. Clinicians have a duty of care to ensure that it is efficient, with the “transfer of information being irrelevant unless it results in action that is appropriate to the patients’ needs.”6
The frequency with which ethnicity, national heritage, and religious affiliation are identified during clinical handover or in patients’ medical records has not been investigated in Australia. The aim of our study was to document the incidence and function of these characteristics being identified by doctors in the medically self‐sufficient acute care unit (ACU) of a tertiary hospital during clinical handover and across the hospital by ward‐based doctors in hospital electronic medical records (EMRs).
Methods
Setting and design
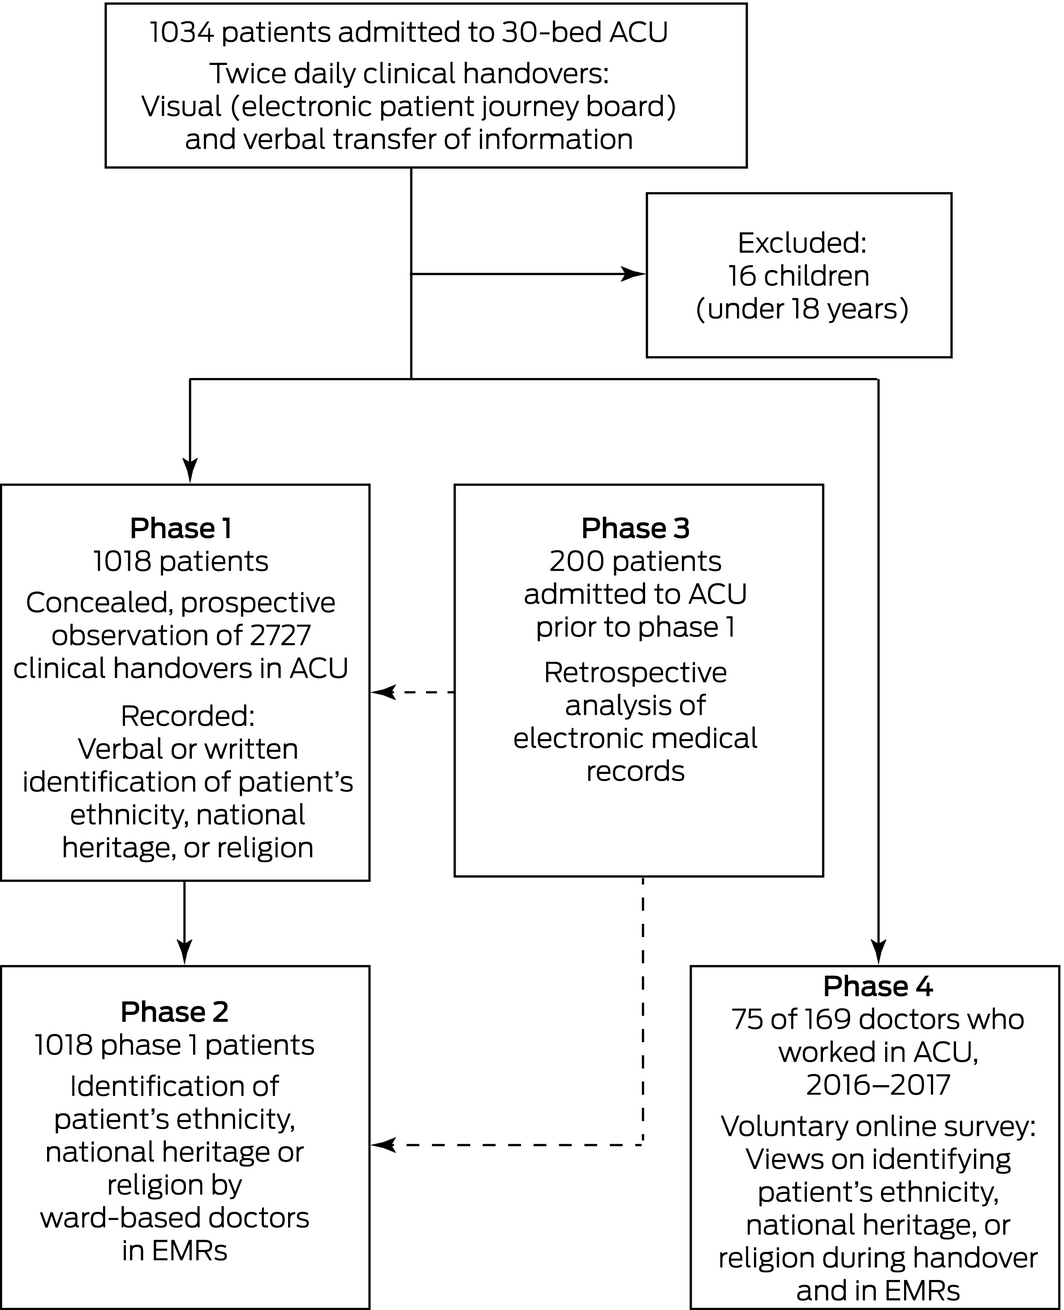
This study, conducted in a tertiary referral hospital in Western Australia between May 2016 and February 2018, consisted of four distinct phases (Box 1). To protect the privacy of participants, we have not identified the hospital in this article and have used “ACU” to describe the department involved, but their identities were disclosed to the MJA editors.
Phase 1, the central component, was a prospective, observational study of clinical handover in a 30‐bed ACU. The ACU doctors were covertly observed by a senior staff member working in the unit (author DM) during one of two daily multidisciplinary clinical handovers (8 am, 8 pm). Each handover involved 17–20 doctors; junior doctors rotate through the ACU for terms lasting between 10 weeks and 6 months. The observer recorded whether a patient's ethnicity, national heritage, or religion was identified in written form (on a regularly updated electronic patient journey board without a specific social history section) or verbally (binary outcome: yes or no), as was whether a reason was provided for mentioning this information. Observations were made only when DM was rostered for clinical duty in the ACU, and only once during a 24‐hour period. This made it possible to blind the staff to observation and to reduce skewing of results by long stay patients, as rostering across non‐consecutive weeks was independent of the investigators. Because our study was designed to assess medical communication at the institutional level, the cultural backgrounds of ACU and ward‐based doctors were not recorded. References to the cultural heritage of patients by staff other than doctors (eg, nursing and paramedical staff) were not assessed.
In phase 2, hospital EMRs for the patient cohort in phase 1 were reviewed for documentation of references to patients’ cultural heritage at any point during their admission by ward‐based doctors not directly associated with the ACU. In phase 3, hospital EMRs for 200 patients admitted to the ACU prior to phase 1 were reviewed for references to patients’ cultural heritage, and their frequency compared with that for phases 1 and 2 to test for the Hawthorne effect (behavioural change caused by knowledge that one is being observed). In phase 4, a voluntary post‐study online survey was distributed to the 169 doctors who had worked in the ACU during the preceding 2 years; it was not an implicit bias test (Box 1; Supporting Information, part 1).
Definitions
Definitions and the assignment of patient ethnic–national background and religious affiliation were adapted from Australian Bureau of Statistics classifications (Supporting Information, part 1). Aboriginal status was determined from demographic information supplied by patients or their families at admission. Other patients were allocated to groupings by author DM on the basis of their surname, country of birth, self‐reported religion, and physical appearance.
The socio‐economic status of a patient's place of residence was assessed with the Australian Bureau of Statistics’ Index of Relative Socio‐economic Advantage and Disadvantage (IRSAD; WA‐specific data),8 severity of acute illness with the Acute Physiology and Chronic Health Evaluation III (APACHE III), and comorbid illness with the Charlson Comorbidity Index.
Data sources
Patients’ surnames (current and previous), personal demographic data, religion, place of birth, and Aboriginal or Torres Strait Islander status were obtained from four semi‐integrated hospital clinical or administrational information systems (Supporting Information, part 1).
Outcomes
The primary outcome was the frequency of references to patients’ ethnic–national background by ACU doctors during clinical handover (written or verbal) or by ward‐based doctors in hospital EMRs (written only), by geographic ethnic–national group. We also examined whether a rationale for identifying the heritage of a patient was provided. Secondary outcomes were the rates at which patients’ ethnic–national backgrounds were mentioned by ACU (per 1000 handovers) and ward‐based doctors (per 1000 EMR pages), and the frequencies with which their religious affiliations were mentioned.
Statistical analysis
Categorical variables are reported as absolute numbers and proportions and were analysed in χ2 tests. Continuous variables were reported as means with standard deviations (SDs) or medians with interquartile ranges (IQRs). ACU handover and hospital EMR identification frequencies were reported as rates per 1000 events with 95% confidence intervals (CIs). The association of ethnic–national background with identification was analysed by logistic regression; multivariate analyses included variables for which P < 0.10 in univariate analyses. Outcomes of the regression analysis are reported as odds ratios (ORs) with 95% CIs. Patients for whom both ethnic and national background were identified were counted only once; similarly, if background was identified both verbally and in writing during a handover, only the first reference was counted. A separate analysis restricted to Aboriginal Australian patients assessed the effects of demographic, socio‐economic and medical factors on reference to their ethnic–national background. Analyses were performed in SPSS for Windows 24.0 (IBM); P < 0.05 was deemed statistically significant (further details: Supporting Information, part 1).
Community engagement
The peak advocacy body for patients’ rights in Western Australia, the Health Consumer Council of Western Australia, their Aboriginal Reference Group, and the hospital's Aboriginal Liaison Department were each consulted about the conduct of the study.
Ethics approval
Ethics approval was granted by the Western Australian Aboriginal Human Research Ethics Committee (reference, 765) and the local regional Metropolitan Health Service Human Research Ethics Committee (reference, EC00265). In both submissions, the authors paid particular attention to advice in the National Statement on Ethical Conduct in Human Research (chapter 2.3)9 regarding “limited disclosure to participants”. At the conclusion of the observation period, all relevant staff were informed about the study in an ethics committee‐approved debriefing statement (Supporting Information, part 2).
Results
The study encompassed 1018 adult patients with a mean age of 59.1 years (SD, 16.3 years); 626 (61.5%) were men, 387 (38.0%) were born overseas, 133 (13.1%) were born in Australia but outside Western Australia, and 13 (1.3%) were neither permanent residents nor citizens of Australia. During phase 1, 2727 clinical handovers (written and verbal components) were observed over 126 days; the median number of handovers per patient was 2 (IQR, 1–4), the mean handover time per patient was 104 seconds (SD, 26 seconds). A total of 142 cultural heritage identifications were made (ethnicity, 84; nationality, 41; religion, 17) during handovers. In phase 2, 14 505 EMR pages of ward‐based documentation were reviewed; 380 cultural heritage identifications (ethnicity, 257; nationality, 119; religion, 4) were recorded.
Phases 1 and 2: primary outcome
The ethnic or national (ethnic–national) background of 142 patients (14%) was cited by ACU or ward‐based doctors or both: ethnicity, 97 patients; nationality, 49 patients; both ethnicity and nationality, four patients. The ethnic–national background of 34 of 74 Aboriginal patients (46%) was specified during handover, and of 49 Aboriginal patients (66%) in hospital EMRs; these proportions were greater than for all other ethnic–national groups (exception: three of five sub‐Saharan Africans were identified during handover; Box 2). The rates with which the ethnic–national backgrounds of Aboriginal patients were identified by doctors at ACU handover (370 [95% CI, 293–460] identifications per 1000 handovers; Box 3) and in EMRs (176 [95% CI, 152–202] identifications per 1000 pages; Box 4) were correspondingly greater than for all other ethnic–national groups.
In the multivariate analysis — adjusted for demographic factors (age, sex) and socio‐economic status, acute severity of illness, and comorbid chronic disease — being an Aboriginal Australian was the most significant factor for ethnic–national background being identified during ACU clinical handover (adjusted OR [aOR], 21.7; 95% CI, 7.94–59.4) or in ward‐based hospital EMRs (aOR, 13.6; 95% CI, 5.03–36.5). Being born overseas was not associated with increased rates of identification during ACU clinical handover (OR, 1.33; 95% CI, 0.79–2.22) or in hospital EMRs (OR, 1.13; 95% CI; 0.76–1.67) (Box 5).
A rationale for mentioning the ethnic–national background of patients was provided on at least one occasion for 25 of the 142 patients (18%) whose background was identified at any point during their hospitalisation. The most common reasons were language barriers (11 patients), an infectious disease‐related travel history (five patients), social or welfare‐related reasons (four patients), and repatriation‐related reasons (three patients). A rationale was provided on at least one occasion for six of the 58 Aboriginal patients (10%) whose background was identified by doctors at handover or in EMRs.
Phases 1 and 2: Aboriginal Australian patients
The mean IRSAD for areas in which Aboriginal patients lived was lower than for other patients in the study (39%; SD, 29 percentage points v 53%; SD, 26 percentage points). Of the factors potentially associated with identifying the ethnicity of Aboriginal ACU patients, only acute severity of illness (OR, 1.02; 95% CI, 1.00–1.04) was statistically significant (Box 6; further details: Supporting Information, part 3).
Phases 1 and 2: religion
The identification of a patient's religion during ACU clinical handover was provided for six of nine Jehovah's Witnesses (Supporting Information, table 1), and in hospital EMRs for four patients (three of nine Jehovah's Witnesses, one of 14 Muslims). A rationale for recording religion was included for identified Jehovah's Witness patients, but not for the Muslim patient.
Phases 1, 2 and 3: Hawthorne effect
A retrospective analysis of 200 patients admitted to the ACU prior to phase 1 found no evidence of a Hawthorne effect; the differences between phases 1 and 3 in the numbers of patients for whom the ethnic–national background was identified during handover (on journey boards) and between phases 2 and 3 in identifications in EMRs were not statistically significant (Supporting Information, part 3).
Phase 4: Post‐study staff survey
The online survey was completed by 75 of 169 ACU doctors (44% response rate), of whom 29 (39%) were born in Australia and 49 (65%) had completed their medical degrees in Australia. Most respondents felt that identifying the cultural heritage of patients could be relevant during handover (nationality or country of birth, 72 [96%]; ethnicity, 75 [100%]; religion, 65 [87%]); that the cultural backgrounds of Jehovah's Witness (52, 69%) and Aboriginal patients (44, 59%) were most frequently mentioned was recognised by most repondents. Fifty respondents (67%) believed that a particular religion was mentioned more frequently during handovers and in EMRs because it directly affected the medical management of the patient. The reasons for mentioning the Aboriginal status of patients included the possibility of stereotyping or bias (35, 47%), aiming to connect a patient with additional support services (35, 47%), the greater likelihood of certain diseases (28, 37%), and the importance of cultural differences (32, 43%). Fewer than half the respondents (35, 47%) felt that the current level of cultural safety training in Western Australian Health was adequate (Supporting Information, part 4).
Discussion
Our study is the first to quantitate how often doctors identify the cultural heritage of patients when recording or handing over clinical information, and how often they provide an explanation for doing so. Our clearest finding was that doctors in the ACU and on the general ward identify the backgrounds of Aboriginal patients more frequently than those of other ethnic–national groups, including those of patients born overseas.
Identifying the cultural heritage of patients is controversial; while some authors regard it as irrelevant and perhaps subject to prejudice,2,3,4 others advocate collecting the information in order to identify disparities in health care.10,11,12 Among the patients whose ethnic–national background was identified in this study (142 of 1018, 14%), an explicit rationale was provided by the identifying doctors for fewer than 20% of identifications.
The proportion of Aboriginal patients in the ACU during the study period (7.3%) was greater than that of Aboriginal Australians in the Western Australian population (3.7%), and the socio‐economic status of their places of residence was generally lower than other ethnic–national groups. It is therefore unsurprising that survey respondents listed a greater disease burden (37%) and linking patients with support services (47%) as reasons for identifying Aboriginal patients. As Aboriginal status was more likely to be mentioned than other backgrounds, even after adjusting for severity of illness and socio‐economic status, other factors are probably important. Only 59% of respondents to our post‐study survey were aware that the backgrounds of Aboriginal patients were mentioned more frequently than other groups, and those who were aware acknowledged that stereotyping and bias (80%) and variations in cultural practice (73%) were important factors (Supporting Information, part 4, question 19). Governmental requirements that public servants identify Aboriginal people in official databases have perhaps unintentionally led to reinforcing this behaviour in other forms of work‐related communication.
The importance of cultural safety13 is now recognised by Australian health departments and many professional colleges by incorporating position statements and online educational modules, many focused on Aboriginal patients, into policy and training requirements. These actions may have positively influenced our findings, although there is no evidence that such programs improve health outcomes.14,15 The inconsistent reference to Aboriginal status by doctors may also reflect a lack of cultural awareness and appreciation of the diversity of Aboriginal communities. Most respondents to our survey (93%) believed that cultural awareness was pertinent to their training, but more than half (53%) felt that the level of cultural awareness training was inadequate.
Despite the multicultural face of Australian health care, only 0.5% of all medical practitioners in Australia are Aboriginal Australians.16 While 7% of our patients were Aboriginal, there were no Aboriginal ACU doctors during the study period. Our results provide information for promoting critical self‐reflection and improving cultural safety in the medical profession. The possibility that cultural bias among physicians contributes to disparities in health care is increasingly recognised, but remains poorly investigated.17 Most research into racial prejudice and health care inequality has relied on self‐reports by patients,18,19,20 while Aboriginal communities have reported experiencing prejudice when accessing health care.21,22 Investigations of bias from the health care providers’ perspective are limited to a few qualitative studies based on personal attitude questionnaires, clinical vignettes, or experimental situations.23,24 More pervasive are entrenched structural or institutional mechanisms that perpetuate cultural bias in health care.25 Structural biases that lead to discrepancies in health care delivery and poorer health outcomes for minorities have more often been linked with social policies and laws than with the attitudes of health care providers.26,27
Limitations
This was a single centre, observational study with the potential for confounding by the Hawthorne effect and other biases. The prospective, concealed study design in a real world practice nevertheless allows for a degree of generalisability. Further, the findings for ACU handovers and hospital EMRs were consistent. We attempted to explore the motives for identifying a patients’ cultural heritage in our post‐study survey, but comprehensive understanding of this question would require in depth, time‐consuming psychological testing. Finally, determining the ethnicity, national heritage, and religious affiliation of individuals is complex, requiring both individual and societal recognition (Supporting Information, part 5).
Conclusion
Explicit identification by doctors of the cultural heritage of patients in a diverse ACU cohort, during clinical handovers or in hospital EMRs, was uncommon, inconsistent and seldom explained. After adjusting for demographic, socio‐economic and medical factors, the cultural backgrounds of Aboriginal patients were substantially more likely to be mentioned than those of patients from other backgrounds, but explanations were provided for only 10% of these identifications. Further research and community consultation are needed to understand this practice.
Box 1 – Identifying the cultural heritage of acute care unit (ACU) patients during medical handovers and in hospital electronic medical records (EMRs): the four phases of our observational study
Box 2 – Identification of the ethnicity or national background of 1018 patients in a tertiary hospital acute care unit (ACU) by doctors at clinical handover or by ward‐based doctors in hospital electronic medical records (EMRs)*
|
Geographic |
Patients |
At least one identification |
At least one identification in hospital EMR |
Identified |
|||||||||||
|
Ethnicity |
Nationality |
Ethnicity or |
Ethnicity |
Nationality |
Ethnicity or |
||||||||||
|
|
|||||||||||||||
|
All patients |
1018 |
38 (3.7%) |
26 (2.6%) |
64 (6.3%) |
86 (8.5%) |
33 (3.2%) |
119 (11.7%) |
142 |
|||||||
|
Aboriginal Australian |
74 (7.3%) |
34 (46%) |
0 |
34 (46%) |
49 (66%) |
0 |
49 (66%) |
58 |
|||||||
|
Other Oceanian |
15 (1.5%) |
2 (13%) |
0 |
2 (13%) |
4 (27%) |
3 (20%) |
7 (47%) |
6 |
|||||||
|
United Kingdom or Ireland |
718 (70.5%) |
0 |
7 (1%) |
7 (1%) |
22 (3%) |
10 (1%) |
32 (4%) |
38 |
|||||||
|
Western European |
91 (8.9%) |
0 |
1 (1%) |
1 (1%) |
3 (3%) |
2 (2%) |
5 (5%) |
6 |
|||||||
|
Eastern European |
33 (3.2%) |
0 |
3 (9%) |
3 (9%) |
1 (3%) |
0 |
1 (3%) |
4 |
|||||||
|
East or South East Asian |
40 (3.9%) |
2 (5%) |
9 (22%) |
11 (28%) |
2 (5%) |
7 (18%) |
9 (22%) |
14 |
|||||||
|
Subcontinental Asian |
25 (2.5%) |
0 |
2 (8%) |
2 (8%) |
1 (4%) |
5 (20%) |
6 (24%) |
5 |
|||||||
|
Middle Eastern or North African |
12 (1.2%) |
0 |
1 (8%) |
1 (8%) |
3 (25%) |
3 (25%) |
6 (50%) |
7 |
|||||||
|
Sub‐Saharan African |
5 (0.5%) |
0 |
3 (60%) |
3 (60%) |
1 (20%) |
2 (40%) |
3 (60%) |
3 |
|||||||
|
Latin American |
5 (0.5%) |
0 |
0 |
0 |
0 |
1 (20%) |
1 (20%) |
1 |
|||||||
|
|
|||||||||||||||
|
* The ethnic or national background of 142 patients was cited by either ACU or ward‐based medical staff or both: ethnicity, 97 patients; nationality, 49 patients; ethnicity and nationality, four patients. †Total number of patients identified on at least one occasion either during the ACU clinical handover or in the hospital EMR by ward‐based doctors. Patients identified on more than one occasion are only counted once. |
|||||||||||||||
Box 3 – Identification of the ethnicity or national background of 1018 patients by acute care unit (ACU) doctors during one of 126 scheduled (twice daily) multidisciplinary clinical handovers
|
Geographic |
Clinical |
Ethnic identification |
National identification |
Ethnic or national identification |
P‡ |
||||||||||
|
Written† |
Verbal |
Written† |
Verbal |
Number |
Rate per 1000 |
||||||||||
|
|
|||||||||||||||
|
All patients |
2727 |
41 (1.5%) |
43 (1.6%) |
14 (0.5%) |
27 (1.0%) |
125 (4.5%) |
46 (38–54) |
— |
|||||||
|
Aboriginal Australian |
203 |
35 (17%) |
40 (20%) |
0 |
0 |
75 (37%) |
370 (293–460) |
— |
|||||||
|
Other Oceanian |
38 |
2 (5%) |
1 (3%) |
0 |
0 |
3 (8%) |
79 (169–231) |
0.001 |
|||||||
|
United Kingdom or Ireland |
1894 |
0 |
0 |
0 |
7 (0.4%) |
7 (0.4%) |
3.7 (1.5–7.6) |
< 0.001 |
|||||||
|
Western European |
255 |
0 |
0 |
0 |
1 (0.4%) |
1 (0.4%) |
3.9 (0.1–22) |
< 0.001 |
|||||||
|
Eastern European |
96 |
0 |
0 |
0 |
4 (4%) |
4 (4%) |
4.2 (1.1–11) |
< 0.001 |
|||||||
|
East or South East Asian |
100 |
4 (4%) |
2 (2%) |
7 (7%) |
8 (8%) |
21 (21%) |
210 (130–321) |
0.017 |
|||||||
|
Subcontinental Asian |
64 |
0 |
0 |
5 (8%) |
3 (5%) |
8 (12%) |
125 (54–246) |
0.010 |
|||||||
|
Middle Eastern or North African |
30 |
0 |
0 |
1 (3%) |
0 |
1 (3%) |
3.3 (0–18) |
< 0.001 |
|||||||
|
Sub‐Saharan African |
28 |
0 |
0 |
1 (4%) |
4 (14%) |
5 (18%) |
179 (58–417) |
0.09 |
|||||||
|
Latin American |
19 |
0 |
0 |
0 |
0 |
0 |
0 (0–19) |
0.001 |
|||||||
|
Born outside Australia§ |
1065 |
2 (0.2%) |
3 (0.3%) |
14 (1.3%) |
27 (2.5%) |
46 (4.3%) |
42 (32–58) |
< 0.001 |
|||||||
|
|
|||||||||||||||
|
CI = confidence interval. * Each handover comprised a written and a verbal component. † Displayed on a regularly updated electronic patient journey board used during clinical handover. ‡ Compared with Aboriginal Australian group. § 387 patients were born outside Australia. |
|||||||||||||||
Box 4 – Identification of the ethnicity or national background of 1018 patients of a tertiary hospital in the integrated in hospital electronic medical records (EMRs) by ward‐based doctorsstaff
|
Geographic ethnic–national group* |
Pages of EMR* |
Ethnic identification |
National identification |
Ethnic or national identification |
P† |
||||||||||
|
Number |
Rate per 1000 pages of EMR (95% CI) |
||||||||||||||
|
|
|||||||||||||||
|
All patients |
14 505 |
257 |
119 |
376 |
26 (23–29) |
— |
|||||||||
|
Aboriginal Australian |
1112 |
196 |
0 |
196 |
176 (152–203) |
— |
|||||||||
|
Other Oceanian |
317 |
20 |
5 |
25 |
79 (51–116) |
< 0.001 |
|||||||||
|
United Kingdom or Ireland |
10 151 |
27 |
41 |
68 |
6.7 (5.2–8.5) |
< 0.001 |
|||||||||
|
Western European |
1361 |
3 |
2 |
5 |
3.7 (1.2–8.6) |
< 0.001 |
|||||||||
|
Eastern European |
459 |
3 |
1 |
4 |
8.7 (2.3–22) |
< 0.001 |
|||||||||
|
East or South East Asian |
469 |
3 |
32 |
35 |
75 (52–104) |
< 0.001 |
|||||||||
|
Subcontinental Asian |
319 |
1 |
12 |
13 |
41 (22–70) |
< 0.001 |
|||||||||
|
Middle Eastern or North African |
121 |
3 |
8 |
11 |
91 (45–163) |
0.029 |
|||||||||
|
Sub‐Saharan African |
112 |
1 |
15 |
16 |
143 (82–232) |
0.50 |
|||||||||
|
Latin American |
84 |
0 |
3 |
3 |
36 (7.2–104) |
< 0.001 |
|||||||||
|
Born outside Australia‡ |
5401 |
38 |
119 |
157 |
29 (25–34) |
< 0.001 |
|||||||||
|
|
|||||||||||||||
|
CI = confidence interval. * Entries by doctors only. † Compared with Aboriginal Australian group. ‡ 387 patients were born outside Australia. |
|||||||||||||||
Box 5 – Univariate and multivariate analysis of the identification of the ethnicity or national background of 1018 patients of a tertiary hospital by acute care unit (ACU) doctors at clinical handover or by ward‐based doctors in hospital electronic medical records (EMRs)*
|
Covariates |
Ethnic or national identification |
Ethnic or national identification |
|||||||||||||
|
Unadjusted odds ratio |
Adjusted odds ratio |
P |
Unadjusted odds ratio |
Adjusted odds ratio |
P |
||||||||||
|
|
|||||||||||||||
|
Aboriginal Australian |
26.8 (14.9–48.3) |
21.7 (7.94–59.4) |
< 0.001 |
25.7 (14.9–44.1) |
13.6 (5.03–36.5) |
< 0.001 |
|||||||||
|
United Kingdom or Ireland |
0.04 (0.02–0.09) |
0.25 (0.08–0.75) |
0.013 |
0.12 (0.08–0.18) |
0.41 (0.16–1.03) |
0.06 |
|||||||||
|
Western European |
0.16 (0.02–1.13) |
— |
— |
0.43 (0.17–1.08) |
0.55 (0.16–1.91) |
0.34 |
|||||||||
|
Eastern European |
1.54 (0.46–5.20) |
— |
— |
0.24 (0.03–1.75) |
— |
— |
|||||||||
|
East or South East Asian |
5.82 (2.70–12.5) |
9.16 (3.02–27.8) |
< 0.001 |
2.36 (1.10–5.10) |
2.37 (0.76–7.39) |
0.14 |
|||||||||
|
Subcontinental Asian |
1.33 (0.31–5.77) |
— |
— |
1.99 (0.73–5.40) |
— |
— |
|||||||||
|
Other groupings‡ |
3.14 (1.26–7.83) |
4.97 (1.48–16.7) |
0.009 |
5.94 (2.99–11.82) |
5.66 (1.92–16.7) |
0.002 |
|||||||||
|
Born overseas§ |
1.33 (0.79–2.22) |
— |
— |
1.13 (0.76–1.67) |
— |
— |
|||||||||
|
Age (per year) |
0.98 (0.97–1.00) |
1.01 (0.99–1.03) |
0.63 |
0.97 (0.96–0.98) |
0.98 (0.97–1.00) |
0.036 |
|||||||||
|
Sex (women) |
1.59 (0.96–2.66) |
1.20 (0.65–2.20) |
0.56 |
1.64 (1.11–2.41) |
1.33 (0.83–2.12) |
0.24 |
|||||||||
|
Socio‐economic disadvantage (IRSAD, per decile)¶ |
0.89 (0.80–0.99) |
0.96 (0.86–1.08) |
0.50 |
0.90 (0.83–0.97) |
0.95 (0.87–1.04) |
0.30 |
|||||||||
|
Severity of disease (APACHE III, per point) |
1.01 (1.00–1.02) |
1.01 (1.00–1.02) |
0.09 |
1.00 (0.99–1.01) |
— |
— |
|||||||||
|
Charlson Comorbidity Index (per point) |
1.06 (0.94–1.20) |
— |
— |
1.08 (0.98–1.26) |
— |
— |
|||||||||
|
|
|||||||||||||||
|
APACHE III = Acute Physiology and Chronic Health Evaluation III; CI = confidence interval; IRSAD = Index of Relative Socio‐economic Advantage and Disadvantage. * Minimum requirement: 20 patients in geographic group. † Covariates included if P < 0.10 in univariate analysis. ‡ 12 Middle Eastern or North African, five Sub‐Saharan African, 15 other Oceanian, five Latin American patients. § 387 patients were born outside Australia. ¶ Based on postcode of home address; a higher decile indicates higher socio‐economic status. |
|||||||||||||||
Box 6 – Univariate analysis of the identification by doctors of the ethnicity of 74 Aboriginal patients during their hospitalisation in the acute care unit (ACU) of a tertiary hospital: demographic, socio‐economic, and medical factors
|
Risk factor |
Univariate odds ratio (95% CI) |
P |
|||||||||||||
|
|
|||||||||||||||
|
Age (per year) |
1.03 (0.99–1.06) |
0.14 |
|||||||||||||
|
Sex (women) |
1.55 (0.62–3.88) |
0.35 |
|||||||||||||
|
Living in remote Western Australia* |
1.97 (0.78–5.01) |
0.15 |
|||||||||||||
|
Socio‐economic disadvantage (IRSAD, per decile)† |
0.92 (0.78–1.08) |
0.32 |
|||||||||||||
|
Severity of disease (APACHE III, per point) |
1.00 (1.00–1.04) |
0.041 |
|||||||||||||
|
Charlson Comorbidity Index (per point) |
1.04 (0.85–1.27) |
0.71 |
|||||||||||||
|
Pre‐formatted electronic written admission template‡ |
0.65 (0.25–1.68) |
0.37 |
|||||||||||||
|
|
|||||||||||||||
|
APACHE III = Acute Physiology and Chronic Health Evaluation III; CI = confidence interval; IRSAD = Index of Relative Socio‐economic Advantage and Disadvantage. * Administrative regions of the Goldfields, Gascoyne, Pilbara, and Kimberley, at least 500 km from Perth. † Based on postcode of home address; a higher decile indicates higher socio‐economic status. ‡ Used only for selected patients in ACU documentation; not used by ward‐based doctors. |
|||||||||||||||
Received 18 July 2018, accepted 6 November 2018
- David JR Morgan1
- Tania Harris2
- Ron Gidgup1
- Martin Whitely3
- 1 South Metroplitan Health Service, Perth, WA
- 2 Health Consumers’ Council (WA), Perth, WA
- 3 John Curtin Institute of Public Policy, Curtin University, Perth, WA
We thank Jenny Thompson for assisting with the collection of the APACHE III data.
No relevant disclosures.
- 1. Australian Bureau of Statistics. 1249.0. Australian Standard Classification of Cultural and Ethnic Groups (ASCCEG), 2016. July 2016. http://www.abs.gov.au/ausstats/abs@.nsf/mf/1249.0 (viewed Nov 2018).
- 2. Caldwell SH, Popenoe R. Perceptions and misperceptions of skin colour. Ann Intern Med 1995; 122: 614–617.
- 3. Garcia RS. The misuse of race in medical diagnosis. Pediatrics 2004; 113: 1394–1395.
- 4. Bigby M, Thaler D. Describing patients’ “race” in clinical presentations should be abandoned. J Am Acad Derm 2006; 54: 1074–1076.
- 5. Jorm C, White S, Kaneen T. Clinical handover: critical communications. Med J Aust 2009; 190 (11 Suppl): S108–S109. https://www.mja.com.au/journal/2009/190/11/clinical-handover-critical-communications
- 6. Australian Commission on Safety and Quality in Health Care. Safety and quality improvement guide standard 6: clinical handover. Sydney: ACSQHC, 2012. https://www.safetyandquality.gov.au/wp-content/uploads/2012/10/Standard6_Oct_2012_WEB.pdf (viewed Apr 2017).
- 7. Australian Medical Association. Safe handover: safe patients. Guidance on clinical handover for clinicians and managers. Canberra: AMA, 2006. https://ama.com.au/sites/default/files/documents/Clinical_Handover_0.pdf (viewed Apr 2017).
- 8. Australian Bureau of Statistics. 2033.0.55.001. Census of population and housing: Socio‐Economic Indexes for Areas (SEIFA), Australia, 2011. IRSAD. Updated Mar 2013. http://www.abs.gov.au/ausstats/abs@.nsf/Lookup/by%20Subject/2033.0.55.001~2011~Main%20Features~IRSAD~10004 (viewed Mar 2018).
- 9. National Health and Medical Research Council, the Australian Research Council, Universities Australia. National Statement on Ethical Conduct in Human Research 2007 (updated 2018). Canberra: Commonwealth of Australia, 2018. https://nhmrc.gov.au/about-us/publications/national-statement-ethical-conduct-human-research-2007-updated-2018 (viewed Nov 2018).
- 10. López L, Green AR, Tan‐McGrory A, et al. Bridging the digital divide in health care: the role of health information technology in addressing racial and ethnic disparities. Jt Comm J Qual Patient Saf 2011; 37: 437–445.
- 11. Haider AH, Pronovost PJ. Health information technology and the collection of race, ethnicity, and language data to reduce disparities in quality of care. Jt Comm J Qual Patient Saf 2011; 37: 435–436.
- 12. Anderson I, Robson B, Connolly M, et al. Indigenous and tribal peoples’ health (The Lancet–Lowitja Institute Global Collaboration): a population study. Lancet 2016; 388: 131–157.
- 13. Coffin J. Rising to the challenge in Aboriginal health by creating cultural security. Aboriginal and Islander Health Worker Journal 2007; 31: 22–24.
- 14. Laverty M, McDermott DR, Calma T. Embedding cultural safety in Australia's main health care standards. Med J Aust 2017; 207: 15–16. https://www.mja.com.au/journal/2017/207/1/embedding-cultural-safety-australias-main-health-care-standards
- 15. Horvat L, Horey D, Romios P, Kis‐Rigo J. Cultural competence education for health professionals. Cochrane Database Syst Rev 2014; CD009405.
- 16. Australian Institute of Health and Welfare. Medical practitioners workforce 2015 (Cat. No. WEB 140). https://www.aihw.gov.au/reports/workforce/medical-practitioners-workforce-2015/contents/who-are-medical-practitioners (viewed Oct 2017).
- 17. Sukhera J, Watling C. A framework for integrating implicit bias recognition into health professions education. Acad Med 2018; 93: 35–40.
- 18. Shepherd CCJ, Li J, Cooper MN, et al. The impact of racial discrimination on the health of Australian Indigenous children aged 5–10 years: analysis of national longitudinal data. Int J Equity Health 2017; 16: 116.
- 19. Mellor D, McCabe M, Ricciardelli L, et al. Toward an understanding of the poor health status of Indigenous Australian men. Qual Health Res 2016; 26: 1949–1960.
- 20. Baba JT, Brolan CE, Hill PS. Aboriginal medical services cure more than illness: a qualitative study of how Indigenous services address the health impacts of discrimination in Brisbane communities. Int J Equity Health 2014; 13: 56.
- 21. Australian Bureau of Statistics. 4704.0. The health and welfare of Australia's Aboriginal and Torres Strait Islander Peoples, Oct 2010. Social and emotional wellbeing: discrimination. Feb 2011. http://www.abs.gov.au/AUSSTATS/abs@.nsf/lookup/4704.0Chapter450Oct+2010 (viewed Dec 2017).
- 22. Ziersch AM, Gallaher G, Baum F, Bentley M. Responding to racism: insights on how racism can damage health from an urban study of Australian Aboriginal people. Soc Sci Med 2011; 73: 1045–1053.
- 23. Hall WJ, Chapman MV, Lee KM, et al. Implicit racial/ethnic bias among health care professionals and its influence on health care outcomes: a systematic review. Am J Public Health 2015; 105: e60–e76.
- 24. Paradies Y, Truong M, Priest N. A systematic review of the extent and measurement of healthcare provider racism. J Gen Intern Med 2014; 29: 364–387.
- 25. Bonilla‐Silva E. Rethinking racism: toward a structural interpretation. American Sociological Review 1997; 62: 465–480.
- 26. Bailey ZD, Krieger N, Agénor M, et al. Structural racism and health inequities in the USA: evidence and interventions. Lancet 2017; 389: 1453–1463.
- 27. Gee GC, Ford CL. Structural racism and health inequities: old issues, new directions. Du Bois Rev 2011; 8: 115–132.
Abstract
Objective: To examine the frequency of and rationale for hospital doctors mentioning a patient's cultural heritage (ethnicity, national heritage, religion) during medical handovers and in medical records.
Design: Four‐phase observational study, including the covert observation of clinical handovers in an acute care unit (ACU) and analysis of electronic medical records (EMRs) of ACU patients after their discharge to ward‐based care.
Setting, participants: 1018 patients and the doctors who cared for them at a tertiary hospital in Western Australia, May 2016 – February 2018.
Main outcome measure: References to patients’ cultural heritage by ACU doctors during clinical handover (written or verbal) and by ward‐based doctors in hospital EMRs (written only), by geographic ethnic–national group.
Results: In 2727 ACU clinical handovers of 1018 patients, 142 cultural heritage identifications were made (ethnicity, 84; nationality, 41; religion, 17); the rate was highest for Aboriginal patients (370 [95% CI, 293–460] identifications per 1000 handovers). 14 505 EMR pages were reviewed; 380 cultural heritage identifications (ethnicity, 257; nationality, 119; religion, 4) were recorded. A rationale for identification was documented for 25 of 142 patients (18%) whose ethnic–national background was mentioned during handover or in their EMR. Multivariate analysis (adjusted for demographic, socio‐economic and medical factors) indicated that being an Aboriginal Australian was the most significant factor for identifying ethnic–national background (handovers: adjusted odds ratio [aOR], 21.7; 95% CI, 7.94–59.4; hospital EMRs: aOR, 13.6; 95% CI, 5.03–36.5). 44 of 75 respondents to a post‐study survey (59%) were aware that Aboriginal heritage was mentioned more frequently than other cultural backgrounds.
Conclusions: Explicitly mentioning the cultural heritage of patients is inconsistent and seldom explained. After adjusting for other factors, Aboriginal patients were significantly more likely to be identified than patients with other backgrounds.