


The known: Clinicians need accurate and reliable tools to help identify people at increased risk of a cardiovascular event.
The new: Analysis of data for a contemporary Australian cohort indicate that the performance of the Pooled Cohort Risk Equation model and, to a lesser extent, that of the 1991 Framingham cardiovascular disease risk prediction model are superior to those of the two 2008 Framingham models in terms of discrimination, calibration, and clinical utility, both in men and women.
The implications: The 2013 Pooled Cohort Risk Equation and 1991 Framingham models are appropriate for estimating cardiovascular disease risk in Australia.
Primary prevention of cardiovascular disease (CVD) requires effectively implementing targeted individual‐level preventive strategies, including lifestyle and pharmacological interventions. Clinicians therefore need accurate, reliable tools for identifying people at increased risk of cardiovascular events. CVD risk prediction models use information on a number of risk factors to estimate the absolute risk of a cardiovascular event within a given period.1 Several models have been recommended for clinical use. In Australia, the National Vascular Disease Prevention Alliance (NVDPA) guidelines2 for managing absolute CVD risk recommend the established and widely used 1991 Framingham risk model.3 However, this model is based on data from the Framingham Heart Study, which investigated predominantly white people aged 30–74 years in a small United States town, and may not be applicable to the Australian population. Two updated versions of the 1991 Framingham risk model have been developed for predicting CVD risk in primary care without laboratory predictors: the 2008 Framingham and 2008 office‐based Framingham models.4 In validation studies, Framingham‐derived risk models have overestimated CVD risk in different populations.5,6
In 2013, the American College of Cardiology and the American Heart Association (ACC/AHA) released the Pooled Cohort Risk Equation for estimating atherosclerotic CVD risk (2013 PCE‐ASCVD), based on data from several prospective cohort studies in the US.7 Validation studies found that 2013 PCE‐ASCVD systematically overestimates CVD risk,8,9 and it has not been validated in an Australian cohort.
The authors of a recent systematic review of 212 articles on prediction models for CVD risk in general populations concluded that many models have not been externally evaluated or directly compared.10 External validation of a risk prediction model is essential for providing sufficient evidence to evaluate its performance in a contemporary population and to determine its applicability.11 Further, most validation studies have not accounted for the effects of treatment, which may explain the overestimation of predicted risk.
We evaluated the performance (calibration and discrimination) of the 2013 PCE‐ASCVD in an Australian population, and compared its performance with that of three frequently used Framingham‐derived CVD risk prediction models (1991 Framingham,3 2008 Framingham,4 2008 office‐based Framingham4).
Methods
Study population
We analysed data from the Australian Diabetes, Obesity and Lifestyle (AusDiab) study, a national, longitudinal, population‐based cohort study undertaken in 42 randomly selected urban and non‐urban areas of the six Australian states and the Northern Territory. The AusDiab study methods have been previously described.12 The study included three rounds of data collection: baseline (May 1999 – December 2000); phase 2 (June 2004 – November 2005); and phase 3 (August 2011 – June 2012). Data were collected during a household interview and at subsequent biomedical examinations (including blood analyses, anthropometric measurements, and questionnaires). Of 20 347 eligible people, 11 247 adults over 25 years of age completed the household interview and underwent biomedical examination (response rate, 55%). All living baseline participants were invited to attend follow‐up assessments during phases 2 and 3.
For this analysis, we limited the study population to the 6956 participants aged 40–74 years without a history of CVD. We also excluded 521 participants for whom data required for risk model calculations were missing and 982 for whom information on outcome events was missing. The final sample included 5453 participants (complete case analysis).
Risk models calculations
We calculated the 10‐year predicted CVD risk for each participant in the AusDiab cohort from their baseline data with four CVD risk prediction models: 1991 Framingham,3 2008 Framingham,4 2008 office‐based Framingham,4 and 2013 PCE‐ASCVD7 (Supporting Information, table 1).
Predictor variables for the risk models included age, sex, systolic blood pressure, high‐density lipoprotein cholesterol, total cholesterol, smoking status, diabetes status, blood pressure medication, and electrocardiographic evidence of left ventricular hypertrophy status. Age, sex, and smoking status were based on self‐report. We defined systolic blood pressure as the mean of the second and third of three sequential measurements. A medication audit determined whether participants were taking blood pressure‐ or lipid‐lowering medications. Diabetes status was defined by current treatment with oral anti‐diabetic medications or insulin, a fasting blood glucose level of at least 7.0 mmol/L, or a 2‐hour post‐load glucose level of at least 11.1 mmol/L.
Cardiovascular outcome measures
We defined the primary outcome measure separately for each model, matching those for the original derivation cohorts. For 1991 Framingham, the outcome measures were myocardial infarction, fatal or non‐fatal coronary heart disease, stroke, and fatal or non‐fatal CVD (including congestive heart failure and peripheral vascular disease). The primary outcome measures for the 2008 Framingham models were similar to those of the 1991 Framingham. For the 2013 PCE‐ASCVD, events were defined as acute myocardial infarction, death caused by coronary heart disease, and fatal or non‐fatal ischaemic stroke.
Events were recorded between enrolment (1999–2000) and 30 November 2011, the most recent date for which data were available. Self‐reported CVD events were collected with an interviewer‐administered questionnaire and adjudicated by an expert committee that reviewed medical records.13 The accuracy of self‐reporting of CVD events has been established.14 Cause‐specific mortality was determined from International Classification of Diseases, tenth revision, Australian modification (ICD‐10‐AM) codes in death certificates. Mortality status and causes of death were determined by linkage of data with the Australian National Death Index.
Statistical analysis
We did not impute missing data because most were for outcome events; complete case analysis was therefore not biased.15
We calculated the predicted and observed 10‐year cardiovascular risks for each participant in the AusDiab cohort for each decile of predicted risk and each 5‐year age group.
We adjusted the predicted 10‐year CVD risk for treatment with lipid‐lowering medication, as suggested by other investigators,16,17 by reducing the estimate by 20% for people who had commenced lipid‐lowering treatment before phase 2 data collection (2004–05) but were not receiving it at baseline (1999–2000).18 We did not adjust risk estimates for participants taking lipid‐lowering medication at both baseline and phase 2, as the medication effect should be reflected by total and high‐density lipoprotein cholesterol levels at baseline.
We assessed the clinical performance of each model by examining their discrimination and calibration for predicting risk in men and women separately. Calibration (agreement of predicted with observed 10‐year CVD risk) was assessed by plotting observed proportions against predicted probabilities (Loess calibration plots) for each decile of predicted risk for each risk model and for each 5‐year age group; a linear relationship with a gradient of one indicates perfect calibration. We also calculated the Brier score (mean square of the deviation between predicted and observed risks) as a measure of the accuracy of prediction.
Discrimination (the ability of the model to differentiate between patients who experience a cardiovascular event and those who do not) was assessed by calculating for each risk model the area under the receiver operating characteristic curve statistic (C statistic; 1 = perfect discrimination) and Somers D statistic (ranging from –1 = all pairs disagree to 1 = all pairs agree).
For the Framingham risk models, we collated participants into low (10‐year predicted CVD risk < 20%) and high risk groups (≥ 20%); for the 2013 PCE‐ASCVD risk model, we applied a threshold of 7.5%. We present scaled rectangular diagrams to illustrate the discrimination performance of the four CVD risk models.
Finally, we applied decision curve analysis19 to evaluate the clinical usefulness of the four models. At any given threshold probability (ie, the threshold for dividing individuals into low and high risk groups), the model with the greatest net benefit — defined as the difference between the numbers of true and false positives, weighted by the probability of disease — was deemed to have the highest clinical value.
Statistical analyses were conducted in R 3.4.2 (R Foundation for Statistical Computing), using the DCA, Hmisc, scoring, ggplot2, ggpubr, pROC, reshape2, and modEvA packages.
Ethics approval
The AusDiab study was approved by the Alfred Human Research Ethics Committee (reference, 2011/13). Permission to link AusDiab cohort data with Australian National Death Index data was provided by the Australian Institute of Health and Welfare Ethics Committee (reference, EO2018/2/453).
Results
Study population and baseline characteristics
A total of 6956 eligible adults aged 40–74 years who reported not having a history of CVD were identified; data for 5453 were complete for all predictors and outcomes and therefore included in the analysis (Supporting Information, figure 1). The median follow‐up time was 11.1 years (interquartile range, 10.6–11.5 years). At baseline, the mean age of participants was 53.9 years (standard deviation, 9.3 years); 3067 (56.2%) were women, 791 (14.5%) were current smokers, 1226 (22.5%) were obese, 822 (15.1%) were taking medication for hypertension, and 456 (8.4%) were taking lipid‐lowering medication at baseline (Box 1). An incident cardiovascular event during the study period was recorded for 310 participants. The observed 10‐year risk of a cardiovascular event in men aged 40–74 years was 9.2% (219 CVD events), and 3.0% in women (91 CVD events). The distributions of predicted CVD risk for each model are depicted in Supporting Information, figure 2.
Calibration
The 2013 PCE‐ASCVD model provided the most accurate estimates of 10‐year CVD risk for both men and women; the two 2008 Framingham models consistently overestimated risk. The absolute discordance between mean observed and predicted risks was greater for people with higher CVD risk, particularly in the Framingham models (Box 2).
Agreement between the mean observed predicted risks by decile of risk was greater for the 2013 PCE‐ASCVD and 1991 Framingham models than for the two 2008 Framingham models (Box 3). The 2013 PCE‐ASCVD and, to a lesser extent, 1991 Framingham models provided more accurate CVD risk estimates for all age groups than the two 2008 Framingham models (Box 4). Brier scores were slightly lower for the 2013 PCE‐ASCVD model, both in men and women, than for the three Framingham models, indicating slightly better predictive accuracy (Box 5).
Discrimination
The C‐ and Somers D statistics were each slightly larger for the 2013 PCE‐ASCVD model, both in men and women, than for the three Framingham models (that is, slightly better discrimination) (Box 5).
Decision curve analysis
The 2013 PCE‐ASCVD model was superior to the other models for risk threshold probabilities of up to 35% for men and 45% for women (Supporting Information, figure 3). At the usual 10‐year CVD risk thresholds of 20% (moderate risk) and 30% (high risk of CVD), the 2013 PCE‐ASCVD model was therefore superior to the other models.
Risk classification
Of 2386 men included in our analysis, 404 (16.9%), 708 (29.7%), 780 (32.7%), and 1106 (46.4%) were identified as being at high risk by the 1991 Framingham, 2008 Framingham, 2008 office‐based Framingham, and 2013 PCE‐ASCVD models respectively. Of 3067 women, 54 (1.8%), 220 (7.2%), 273 (8.9%), and 565 (18.4%) were identified as being at high risk by the four models.
The proportions of men and women classified as being at high risk by the four prediction models who subsequently had a cardiovascular event (defined as any event for any of the four models) are reported in Box 6 and in the Supporting Information, table 2. Together, the four models predicted 183 of 219 observed cardiovascular events in men (84%); 36 men (16%) who experienced a cardiovascular event were not identified by any model as being at high risk. The 2013 PCE‐ASCVD model captured the largest proportion of cardiovascular events (179 of 219, 82%), but also classified 927 men who did not experience a CVD event as being at high risk (84% of men in high risk group). The four models captured 63 of 91 observed cardiovascular events in women (69%); 28 women (31%) who experienced a cardiovascular event were not identified by any model as being at high risk. The 2013 PCE‐ASCVD model captured most cardiovascular events (61 of 91, 67%), but also classified 504 participants who did not experience a CVD event as being at high risk (89% of women in high risk group).
Discussion
Our external evaluation of the performance of the 2013 PCE‐ASCVD model and three frequently used Framingham‐based CVD risk models in a contemporary Australian cohort indicate that none are ideal, but the performance of the 2013 PCE‐ASCVD and, to a lesser extent, of the 1991 Framingham risk models was better in both men and women than that of the two 2008 Framingham CVD risk models in terms of calibration, discrimination, and clinical utility. All four CVD risk models overestimated CVD risk, predominantly for participants in higher deciles of estimated risk. Using the 2013 PCE‐ASCVD model with a 7.5% high risk threshold identified 46% of men and 18% of women as being at high risk; however, only 16% of men and 11% of women classified as being at high risk by the 2013 PCE‐ASCVD model experienced a cardiovascular event within 10 years. The 1991 Framingham risk model, recommended by the NVDPA, classified 17% of men and 2% of women as being at high risk with its threshold of 20%.
Our finding that the 2013 PCE‐ASCVD overestimates CVD risk is consistent with reports of previous investigations in cohorts from the United States,8,9,19,20 Europe,21 and Asia22 for externally validating the model. The discrepancies between actual and predicted CVD risk may be attributable to the availability of more effective cardiovascular preventive interventions (such as lipid‐lowering medications). However, we adjusted our risk estimates for statin treatment, and it has been reported that interventions such as statin use and revascularisation procedures do not explain the large discrepancy between observed and predicted rates of CVD.17
Although the 2013 PCE‐ASCVD model was superior to the other risk models, the 7.5% 10‐year CVD risk threshold for identifying people at high risk is very low. Applying this criterion to a contemporary Australian cohort considerably increased the number of people classified as being at high risk, only a minority of whom developed CVD. The balance between the benefits and harms associated with treating people at low risk of developing CVD may not be acceptable to many individuals.3
Limitations
Despite analysing data for an independent contemporary cohort of Australian adults, there are some limitations to our external validation of the four risk prediction models. CVD outcome events were ascertained by self‐report and adjudication; however, this approach has been found to be accurate.14 The degree of loss of AusDiab participants to follow‐up was considerable, and we also excluded participants with missing data; these factors may have influenced our estimates, particularly as most missing data were related to observed CVD event rates. Further, the AusDiab participants comprise a relatively healthy cohort with very low CVD event rates, a consequence of healthy volunteer bias. The models’ performance might be improved by recalibration, although the Framingham model recommended by the NVDPA has not been recalibrated.2
Conclusion
We found that the recently developed AHA/ACA PCE‐ASCVD risk prediction model is slightly better than the currently recommended 1991 Framingham risk model for predicting CVD; each of these models outperform the two 2008 Framingham CVD risk models, both in men and women, and are therefore more appropriate risk models for Australia. However, the 10‐year CVD risk threshold of 7.5% recommended by the ACC/AHA for initiating CVD primary preventive treatment may be too low, identifying a large proportion of the population as being at high risk of a cardiovascular event.
Box 1 – The characteristics of the included participants, from the baseline dataset for the Australian Diabetes, Obesity and Lifestyle (AusDiab) study
|
|
Men |
Women |
Total |
||||||||||||
|
|
|||||||||||||||
|
Total number of participants |
2386 (43.8%) |
3067 (56.2%) |
5453 |
||||||||||||
|
Age (years), mean (SD) |
53.9 (9.2) |
54.0 (9.4) |
53.9 (9.3) |
||||||||||||
|
Systolic blood pressure (mmHg), mean (SD) |
132.9 (16.4) |
127.5 (18.2) |
129.8 (17.7) |
||||||||||||
|
Total serum cholesterol (mmol/L), mean (SD) |
5.66 (1.00) |
5.67 (1.03) |
5.67 (1.01) |
||||||||||||
|
HDL cholesterol (mmol/L), mean (SD) |
1.25 (0.31) |
1.56 (0.39) |
1.42 (0.39) |
||||||||||||
|
Total serum cholesterol:HDL ratio, mean (SD) |
3.6 (1.4) |
4.9 (1.5) |
4.1 (1.5) |
||||||||||||
|
Body mass index (kg/m2), mean (SD) |
27.3 (4.0) |
27.1 (5.5) |
27.2 (4.9) |
||||||||||||
|
Current smoker |
396 (16.6%) |
395 (12.9%) |
791 (14.5%) |
||||||||||||
|
Anti‐hypertensive treatment |
347 (14.5%) |
475 (15.5%) |
822 (15.1%) |
||||||||||||
|
Lipid‐lowering treatment |
201 (8.4%) |
255 (8.3%) |
456 (8.4%) |
||||||||||||
|
Type 2 diabetes |
229 (9.6%) |
191 (6.2%) |
420 (7.7%) |
||||||||||||
|
Previously diagnosed |
121 (5.1%) |
92 (3.0%) |
213 (3.9%) |
||||||||||||
|
Newly diagnosed |
108 (4.5%) |
99 (3.2%) |
207 (3.8%) |
||||||||||||
|
|
|||||||||||||||
|
HDL = high‐density lipoprotein; SD = standard deviation. |
|||||||||||||||
Box 2 – Comparison of predicted and observed 10‐year cardiovascular disease (CVD) risks, by decile of predicted risk, for the four risk prediction models
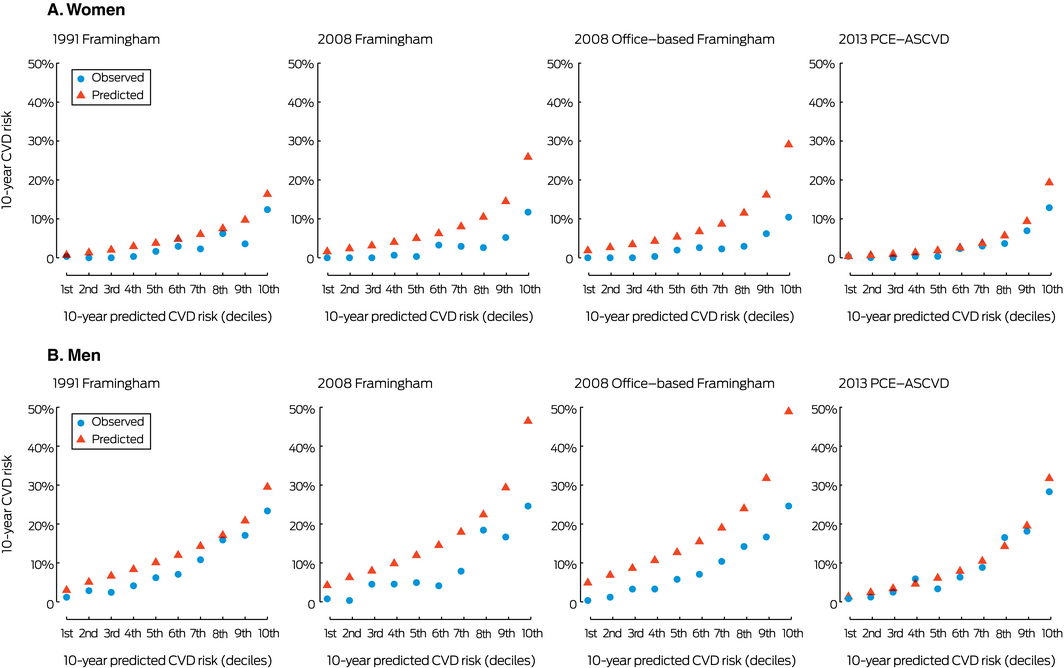
PCE‐ASCVD = Pooled Cohort Risk Equation for atherosclerotic cardiovascular disease.
Box 3 – Loess calibration plots of observed and predicted 10‐year cardiovascular disease (CVD) risk for four risk prediction models, by decile of baseline predicted risk*
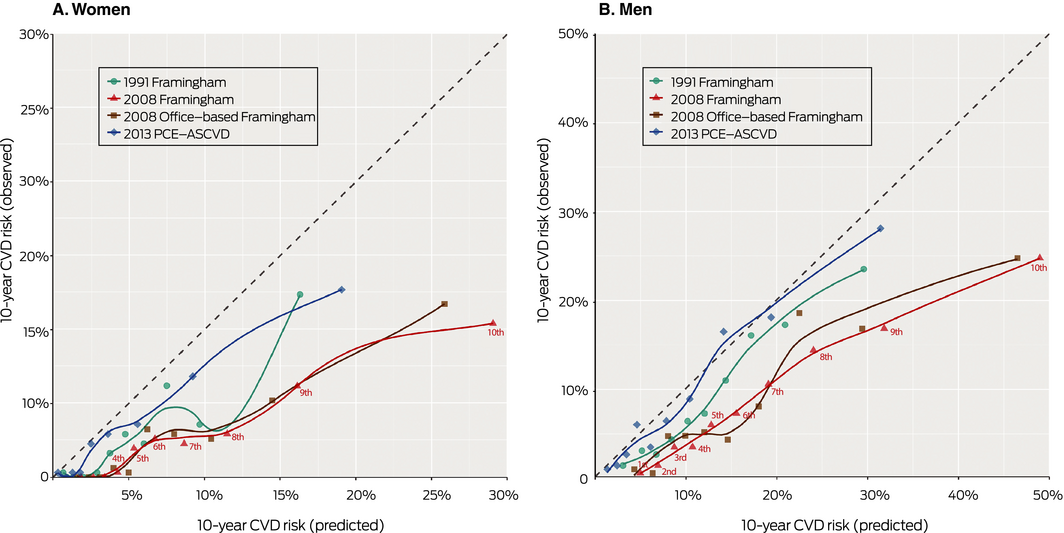
PCE‐ASCVD = Pooled Cohort Risk Equation for atherosclerotic cardiovascular disease. * Labelled for 2008 Framingham. The Loess‐based method for obtaining the smooth curved lines is a non‐parametric local regression approach.
Box 4 – Loess calibration plots of observed and predicted 10‐year cardiovascular disease (CVD) risk for four risk prediction models, by 5‐year age band*
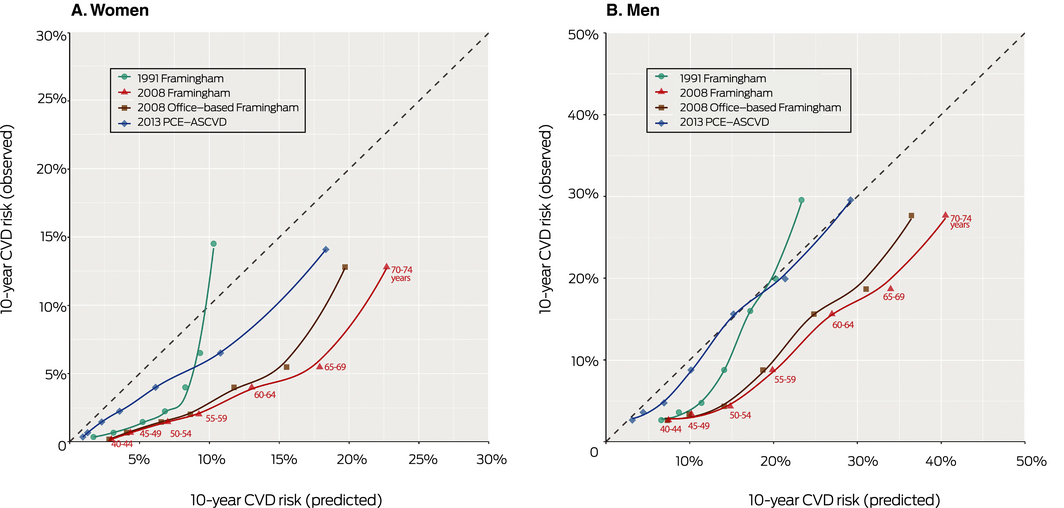
PCE‐ASCVD = Pooled Cohort Risk Equation for atherosclerotic cardiovascular disease. * Labelled for 2008 Framingham. The Loess‐based method for obtaining the smooth curved lines is a non‐parametric local regression approach.
Box 5 – Clinical performance indicators for the four 10‐year cardiovascular disease risk prediction models, based on data for the Australian Diabetes, Obesity and Lifestyle (AusDiab) study cohort
|
|
1991 Framingham |
2008 Framingham |
2008 Office‐based Framingham |
2013 PCE‐ASCVD |
|||||||||||
|
|
|||||||||||||||
|
Women |
|
|
|
|
|||||||||||
|
Brier score |
0.028 |
0.029 |
0.031 |
0.027 |
|||||||||||
|
C‐statistic (95% CI) |
0.80 (0.76–0.84) |
0.82 (0.79–0.86) |
0.81 (0.77–0.85) |
0.84 (0.80–0.87) |
|||||||||||
|
Somers D statistic |
0.567 |
0.647 |
0.618 |
0.675 |
|||||||||||
|
Men |
|
|
|
|
|||||||||||
|
Brier score |
0.078 |
0.084 |
0.087 |
0.076 |
|||||||||||
|
C‐statistic (95% CI) |
0.74 (0.71–0.78) |
0.76 (0.73–0.79) |
0.75 (0.72–0.79) |
0.77 (0.74–0.80) |
|||||||||||
|
Somers D statistic |
0.536 |
0.515 |
0.508 |
0.540 |
|||||||||||
|
|
|||||||||||||||
|
CI = confidence interval; PCE‐ASCVD = Pooled Cohort Risk Equation for atherosclerotic cardiovascular disease. |
|||||||||||||||
Box 6 – Scaled rectangular diagrams of the proportions of women and men identified as being at high 10‐year risk of cardiovascular disease (CVD) events by the 2013 PCE‐ASCVD* and the three Framingham models† and of participants who subsequently had a cardiovascular event
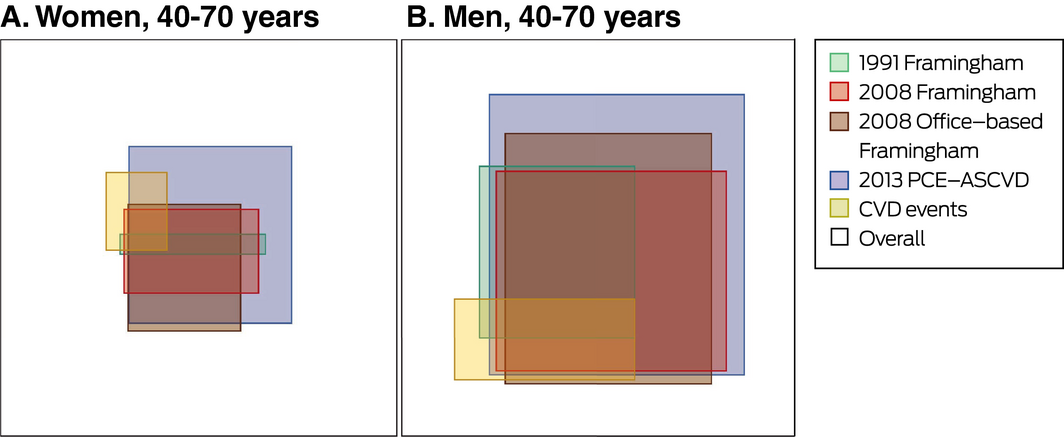
PCE‐ASCVD = Pooled Cohort Risk Equation for atherosclerotic cardiovascular disease. * Threshold for high risk: 7.5%. †Threshold for high risk: 20%.
Received 18 June 2018, accepted 13 November 2018
- Loai Albarqouni1
- Jennifer A Doust1
- Dianna Magliano2
- Elizabeth LM Barr2,3
- Jonathan E Shaw2
- Paul P Glasziou1
- 1 Centre for Research in Evidence‐Based Practice, Bond University, Gold Coast, QLD
- 2 Baker IDI Heart and Diabetes Institute, Melbourne, VIC
- 3 Menzies School of Health Research, Darwin, NT
The AusDiab study was coordinated by the Baker Heart and Diabetes Institute, and we gratefully acknowledge the support and assistance of the AusDiab Steering Committee and the study participants. The AusDiab study was funded by the National Health and Medical Research Council (grants 233200 and 1007544), the Australian Government Department of Health and Ageing, the Northern Territory Department of Health and Community Services, the Tasmanian Department of Health and Human Services, the New South Wales, Western Australian, and South Australian Departments of Health, the Victorian Department of Human Services, Queensland Health, City Health Centre Diabetes Service (Canberra), Diabetes Australia, Diabetes Australia Northern Territory, the estate of the late Edward Wilson, the Jack Brockhoff Foundation, Kidney Health Australia, the Marian and FH Flack Trust, the Menzies Research Institute, the Pratt Foundation, Royal Prince Alfred Hospital (Sydney), the Victorian Government OIS Program, Abbott Australasia, Alphapharm, Amgen Australia, AstraZeneca, Bristol‐Myers Squibb, Eli Lilly Australia, GlaxoSmithKline, Janssen‐Cilag, Merck Sharp & Dohme, Novartis Pharmaceuticals, Novo Nordisk Pharmaceuticals, Pfizer, Roche Diagnostics Australia, Sanofi Aventis, and Sanofi‐Synthelabo. Elizabeth Barr is supported by a Heart Foundation post‐doctoral fellowship (101291).
No relevant disclosures.
- 1. Jackson R, Lawes CM, Bennett DA, et al. Treatment with drugs to lower blood pressure and blood cholesterol based on an individual's absolute cardiovascular risk. Lancet 2005; 365: 434–441.
- 2. National Vascular Disease Prevention Alliance. Guidelines for the management of absolute cardiovascular disease risk. 2012. http://cvdcheck.org.au/pdf/Absolute_CVD_Risk_Full_Guidelines.pdf (viewed Nov 2018).
- 3. Anderson KM, Wilson PW, Odell PM, et al. An updated coronary risk profile. A statement for health professionals. Circulation 1991; 83: 356–362.
- 4. D'Agostino RB, Vasan RS, Pencina MJ, et al. General cardiovascular risk profile for use in primary care: the Framingham Heart Study. Circulation 2008; 117: 743–753.
- 5. Brindle P, Emberson J, Lampe F, et al. Predictive accuracy of the Framingham coronary risk score in British men: prospective cohort study. BMJ 2003; 327: 1267.
- 6. Zomer E, Owen A, Magliano DJ, et al. Validation of two Framingham cardiovascular risk prediction algorithms in an Australian population: the “old” versus the “new” Framingham equation. Eur J Cardiovasc Prev Rehabil 2011; 18: 115–120.
- 7. Goff DC, Lloyd‐Jones DM, Bennett G, et al. 2013 ACC/AHA guideline on the assessment of cardiovascular risk: a report of the American College of Cardiology/American Heart Association Task Force on Practice Guidelines. Circulation 2014; 129 (Suppl 2): S49–S73.
- 8. DeFilippis AP, Young R, Carrubba CJ, et al. An analysis of calibration and discrimination among multiple cardiovascular risk scores in a modern multiethnic cohort. Ann Intern Med 2015; 162: 266–275.
- 9. Cook NR, Ridker PM. Calibration of the pooled cohort equations for atherosclerotic cardiovascular disease: an update. Ann Intern Med 2016; 165: 786–794.
- 10. Damen JA, Hooft L, Schuit E, et al. Prediction models for cardiovascular disease risk in the general population: systematic review. BMJ 2016; 353: i2416.
- 11. Altman DG, Vergouwe Y, Royston P, et al. Prognosis and prognostic research: validating a prognostic model. BMJ 2009; 338: b605.
- 12. Dunstan DW, Zimmet PZ, Welborn TA, et al. The Australian Diabetes, Obesity and Lifestyle Study (AusDiab): methods and response rates. Diabetes Res Clin Pract 2002; 57: 119–129.
- 13. Barr EL, Cameron AJ, Balkau B, et al. HOMA insulin sensitivity index and the risk of all‐cause mortality and cardiovascular disease events in the general population: the Australian Diabetes, Obesity and Lifestyle Study (AusDiab) study. Diabetologia 2010; 53: 79–88.
- 14. Barr EL, Tonkin AM, Welborn TA, et al. Validity of self‐reported cardiovascular disease events in comparison to medical record adjudication and a statewide hospital morbidity database: the AusDiab study. Intern Med J 2009; 39: 49–53.
- 15. Sterne JA, White IR, Carlin JB, et al. Multiple imputation for missing data in epidemiological and clinical research: potential and pitfalls. BMJ 2009; 338: b2393.
- 16. Liew SM, Doust J, Glasziou P. Cardiovascular risk scores do not account for the effect of treatment: a review. Heart 2011; 97: 689–697.
- 17. Cook NR, Ridker PM. Further insight into the cardiovascular risk calculator: the roles of statins, revascularizations, and underascertainment in the Women's Health Study. JAMA Intern Med 2014; 174: 1964–1971.
- 18. Cholesterol Treatment Trialists’ Collaboration; Fulcher J, O'Connell R, Voysey M, et al. Efficacy and safety of LDL‐lowering therapy among men and women: meta‐analysis of individual data from 174 000 participants in 27 randomised trials. Lancet 2015; 385: 1397–1405.
- 19. Vickers AJ, Elkin EB. Decision curve analysis: a novel method for evaluating prediction models. Med Dec Making 2006; 26: 565–574.
- 20. Muntner P, Colantonio LD, Cushman M, et al. Validation of the atherosclerotic cardiovascular disease Pooled Cohort risk equations. JAMA 2014; 311: 1406–1415.
- 21. Rana JS, Tabada GH, Solomon MD, et al. Accuracy of the atherosclerotic cardiovascular risk equation in a large contemporary, multiethnic population. J Am Coll Cardiol 2016; 67: 2118–2130.
- 22. Kavousi M, Leening MJ, Nanchen D, et al. Comparison of application of the ACC/AHA guidelines, Adult Treatment Panel III guidelines, and European Society of Cardiology guidelines for cardiovascular disease prevention in a European cohort. JAMA 2014; 311: 1416–1423.
- 23. Jung KJ, Jang Y, Oh DJ, et al. The ACC/AHA 2013 pooled cohort equations compared to a Korean Risk Prediction Model for atherosclerotic cardiovascular disease. Atherosclerosis 2015; 242: 367–375.
- 24. Albarqouni L, Doust J, Glasziou P. Patient preferences for cardiovascular preventive medication: a systematic review. Heart 2017; 103: 1578–1586.
Abstract
Objectives: To evaluate the performance of the 2013 Pooled Cohort Risk Equation (PCE‐ASCVD) for predicting cardiovascular disease (CVD) in an Australian population; to compare this performance with that of three frequently used Framingham‐based CVD risk prediction models.
Design: Prospective national population‐based cohort study.
Setting: 42 randomly selected urban and non‐urban areas in six Australian states and the Northern Territory.
Participants: 5453 adults aged 40–74 years enrolled in the Australian Diabetes, Obesity and Lifestyle study and followed until November 2011. We excluded participants who had CVD at baseline or for whom data required for risk model calculations were missing.
Main outcome measures: Predicted and observed 10‐year CVD risks (adjusted for treatment drop‐in); performance (calibration and discrimination) of four CVD risk prediction models: 1991 Framingham, 2008 Framingham, 2008 office‐based Framingham, 2013 PCE‐ASCVD.
Results: The performance of the 2013 PCE‐ASCVD model was slightly better than 1991 Framingham, and each was better the two 2008 Framingham risk models, both in men and women. However, all four models overestimated 10‐year CVD risk, particularly for patients in higher deciles of predicted risk. The 2013 PCE‐ASCVD (7.5% high risk threshold) identified 46% of men and 18% of women as being at high risk; the 1991 Framingham model (20% threshold) identified 17% of men and 2% of women as being at high risk. Only 16% of men and 11% of women identified as being at high risk by the 2013 PCE‐ASCVD experienced a CV event within 10 years.
Conclusions: The 2013 PCE‐ASCVD or 1991 Framingham should be used as CVD risk models in Australian. However, the CVD high risk threshold for initiating CVD primary preventive therapy requires reconsideration.