




Medical education
Key research skills
Volume 210 - Issue 4
Cluster randomised trials
Author: Michael J Campbell
Med J Aust 2019; 210 (4): 154-156. || doi: 10.5694/mja2.13001
Published online: 4 March 2019
Published online: 4 March 2019
Cluster randomised trials randomise groups of individuals rather than individuals themselves to interventions. The groups might be communities, schools, workplaces, hospitals, or patients treated by a particular doctor. There are a number of reasons for the use of cluster trials as opposed to individually randomised trials. They may be the only available choice, as when a city is randomised to a mass intervention.
Cluster randomised trials randomise groups of individuals rather than individuals themselves to interventions. The groups might be communities, schools, workplaces, hospitals, or patients treated by a particular doctor. There are a number of reasons for the use of cluster trials as opposed to individually randomised trials. They may be the only available choice, as when a city is randomised to a mass intervention. Another reason is that the investigators may wish to reduce the risk of contamination (Box 1), or it may be more effective, more convenient or cheaper to deliver an intervention to a group rather than to an individual. For example, patients in the same education program will interact with each other and may learn better together than on their own, making a course more effective and economical than one‐on‐one tuition.
Cluster randomised trials are now well described in a number of books1,2,3,4 and a recent review.5 A video describing cluster randomisation is available online.6
Types of cluster trials
Cluster trials are used widely in the evaluation of interventions in health services research. They can be divided into two main types: community trials where intact communities are randomised and random samples from the community are taken; and trials where groups of individuals are randomised and are then followed over time.
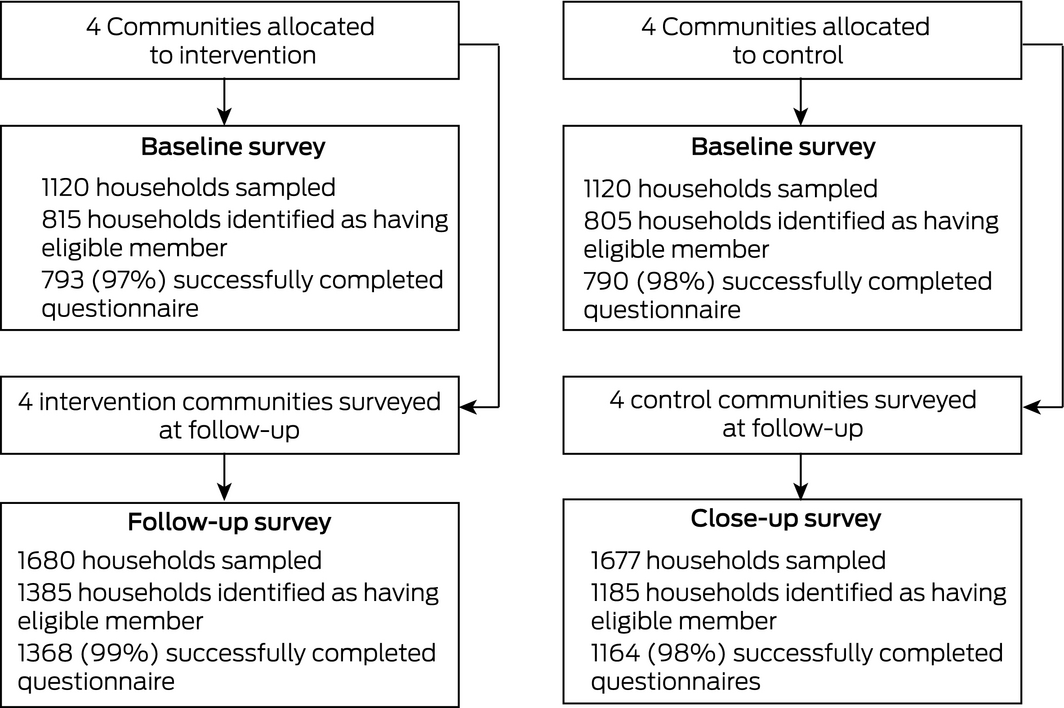
Community randomised trials are generally characterised by a relatively small number of clusters each enrolling a large number of participants. These types of trials are sometimes known as cross‐sectional designs, in that a cross‐sectional sample from each cluster is chosen for analysis. The key point is that the participants in the sample at baseline are not the same as those in the same cluster after the intervention. Often these trials lend themselves to simple summary measures, which can be analysed using simple statistics.7 The SASA! trial8 (Box 2) is an example of a community trial, which randomised eight communities in matched pairs to intervention or control in Kampala, Uganda. The communities were matched by urban/not urban and stability/mobility of the local population, to improve efficiency with such a small number of clusters. The control communities were promised the intervention after the study.
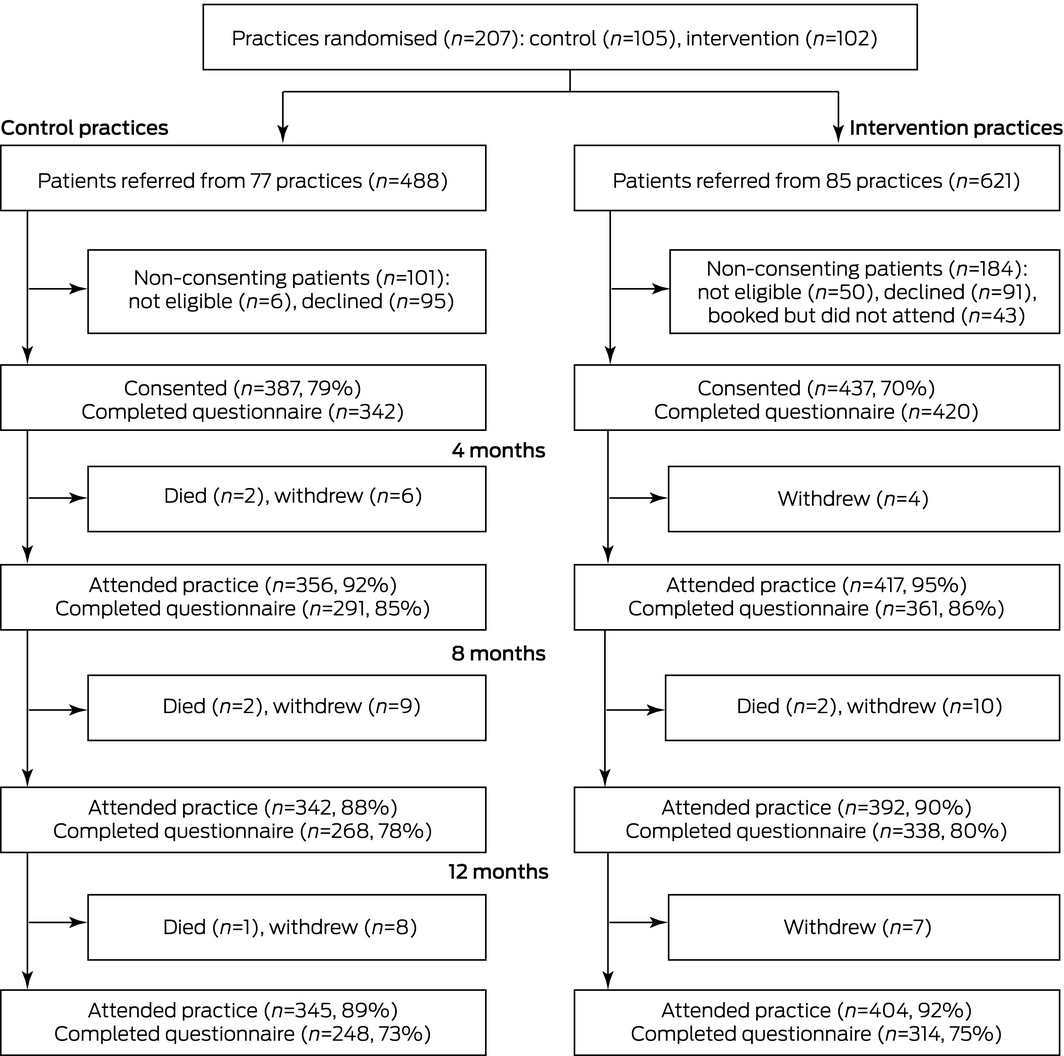
The second type of cluster trial is often known as a cohort design and is closer in design to an individually randomised trial. Typically, participants are grouped by doctor, surgeon, family practice or hospital. The intervention is aimed at the cluster, such as a family practice, and so all relevant patients in a practice will experience the new intervention. These groups are randomised at the start of the study, and individuals within the group are measured before and after the intervention. This design typically uses more clusters and relatively smaller cluster sizes than a cross‐sectional design. A key advantage of measuring the same variable at baseline and outcome is that if the baseline and outcome are correlated then an analysis of covariance which utilises the baseline has better power than one that does not. As with individual trials, cluster trials can also have repeated outcome measures, and they can be factorial trials or cross‐over trials. The DESMOND trial9 (Box 3) is an example of a cohort design. The outcome measure was glycated haemoglobin (HbA1c) measured at baseline and at 3, 6 and 12 months following randomisation. Thus, the trial examined changes in HbA1c levels in individuals over time and was more powerful than a trial which simply measured HbA1c levels at 12 months, albeit at the cost of more measurements.
Design and analysis
A cluster trial always requires more participants than an equivalent individually randomised study. In addition to the usual requirements for a sample size calculation, an investigator requires the design effect (Box 1) to inflate the sample size given by an individually randomised trial. The important point about analysis is that observations from individuals in the same cluster are no longer independent, since the cluster itself influences the observation, and so this structure must be reflected in the model, either explicitly with a random effects model or implicitly with a summary measures or population average model (Box 4). This correlation may be weak, but it will increase the estimate of the variance and can have a major effect on the planning and analysis of these trials, and an analysis that ignores clustering will tend to have erroneously smaller P values. The models can now be fitted in all the major statistical packages.
Recruitment bias
Cluster trials are usually not blinded; that is, participants and investigators know which arm of the trial they are in because the trials involve active participation, unlike a drug trial, where active and control tablets can be made identical. However, it may be possible to blind the outcome assessors, to achieve some level of robustness. In many circumstances, the people who are recruiting patients are also those who are treating them, so there is a potential bias if the recruiters in the intervention arm behave differently from the recruiters in the control arm — this is known as recruitment bias. As can be seen in Box 3, the DESMOND trial9 recruited 437 patients in the intervention group and only 387 in the control group, and the HbA1c levels (a primary outcome measure) were 8.3% and 7.9%, respectively, suggesting that because the investigators were aware of the arm to which a prospective patient was to be allocated, they were more likely to recruit patients to the new intervention arm, and these patients were slightly less well controlled than the control.
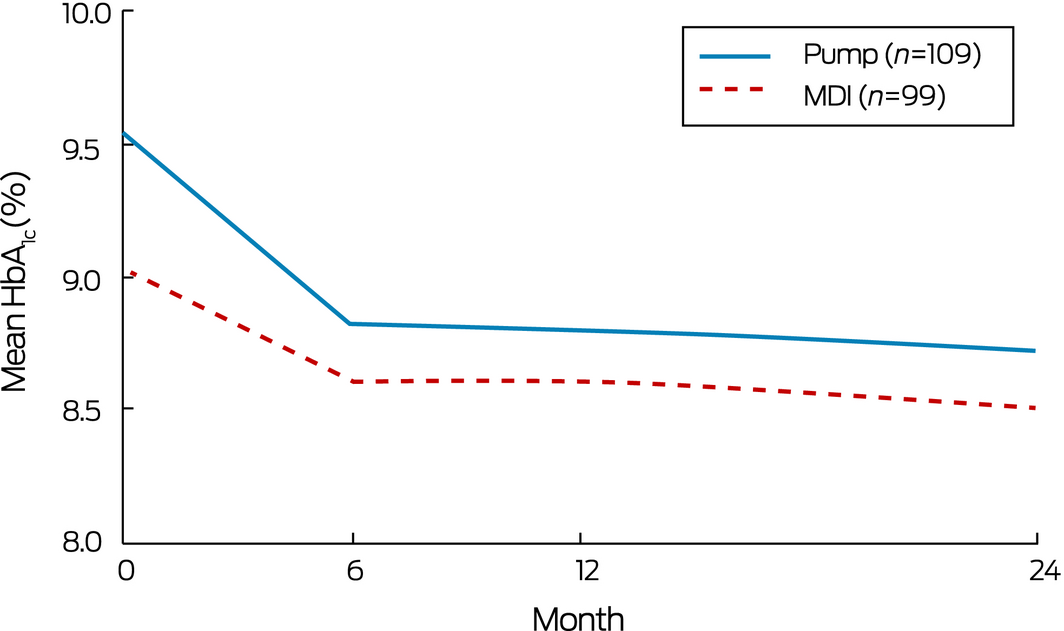
To reduce the possibility of recruitment bias, one solution would be to recruit and obtain consent from participants before randomisation, so that there is no possibility that knowledge of the intervention group will influence the chance of being recruited. This was implemented in the REPOSE trial,10 where participants with type 1 diabetes were recruited and provided consent to either receive insulin pumps or multiple dose injections, the results of which are shown in Box 5. The training intervention usually required a course of eight people, so 16 people were recruited and allocated to one of two courses. The courses were then randomised to receive pumps or multiple dose injections. In this way, the only source of bias might occur if people drop out when they do not receive their preferred intervention. There is no complete solution to the possibility of bias by preferential dropout, since one does not know how this subgroup might have responded. At a minimum, the numbers should be reported by trial arm, and the characteristics of the participants reported and contrasted with the complying population. Small numbers of dropouts, lacking in obvious differences, will reassure the reader that bias due to dropout is likely to be small.
An alternative is to ensure that the personnel who recruit the patients are masked to the study allocations.
Other sources of bias
Cluster trials are subject to the usual sources of bias that individual trials suffer, exacerbated by the usually limited number of clusters. For example, in the SASA! trial,8 there were only eight clusters, so one might question how representative they are of the population. Also, randomisation is limited in its ability to achieve balance in important prognostic factors with few clusters. This can be seen in the REPOSE trial10 (Box 5), where the mean baseline HbA1c level was 9.6% for the pump group and 9.0% for the multiple dose injection group, the difference being more than the expected effect size of 0.5%. We know that this is not due to recruitment bias, and so is likely to be a chance imbalance. If the clusters vary greatly in size, a sensible option is to carry out stratified randomisation on the median cluster size, to ensure about equal numbers of participants in each arm of the trial.
Conclusion
Cluster trials are less powerful than individually randomised trials. Therefore, the general advice is that if you can avoid using cluster trials and use an individually randomised trial, without fear of contamination, then you should do so. However, if a cluster trial is the design of choice, it is hoped that this article alerts the reader to the main issues.
Key terms
- Intra‐class correlation is the ratio of the between cluster variance to the total variance of an outcome variable and is denoted by ρ. Note that unlike a conventional correlation coefficient, ρ must be non‐negative.
- The design effect (DE) is the ratio of the variance of an outcome measure when clustering is accounted for to the variance of the outcome measure when clustering is not accounted for. It is often referred to as the variance inflation factor because it measures the amount that one should increase a variance estimate obtained by ignoring clustering to allow for the clustering effect. Since for a continuous outcome the required sample size is proportional to the variance of the estimate, it may also be called the sample size inflation factor.
- For clusters of equal size m, for a single outcome with no covariates, it can be shown that DE = 1 + (m − 1)ρ. Thus, if the clusters were of size m = 21 and ρ = 0.05, which is quite common for cluster trials in family practice,1 the DE would be 2. This means that for the same power, significance level and effect size, a cluster trial will require twice as many subjects as a corresponding individually randomised trial with no clusters.
- Contamination occurs when subjects in the control group are exposed to the intervention. Thus people living in the same community could not fail to notice a mass education program delivered on the television or local newspaper. Doctors trained in a new technique will find it difficult to revert to an old technique and so may not deliver the standard treatment as they used to do before being trained to deliver the new treatment.
Models for cluster analysis
-
The usual model for a cluster trial allows a random effect for the clusters. Essentially what this means is that we imagine the clusters are selected from a larger population of clusters. If the trial were to be repeated we would not expect to use the same clusters, so the effect of the clusters is to add to the variability of the treatment estimate. This is in contrast to a fixed effect (such as a treatment effect), where one would expect the same effect on a repeat occasion. For a fixed effect, one might fit a dummy variable to the clusters, effectively removing the cluster effect and giving a spuriously low estimate of the variance of the treatment estimate if the clusters are in fact random.
-
The model has various names: a random effects model, a mixed model (mixture of random and fixed effects), a cluster‐specific model and a hierarchical cluster model. The latter allows more than one level of clustering, such as patients within consultants within hospitals.
-
A different (and older) approach treats the random terms as nuisance parameters. It asks what the effect of a treatment is, averaged over clusters, and adjusts the variance of the estimate for the correlation structure. It is known as a population average model and can be analysed using generalised estimating equations.1 For continuous outcomes, the results from the two approaches will be similar, but for binary outcomes, where a logistic model is used, the approaches are estimating different population parameters and will differ to an extent dependent on the intra‐class correlation.
-
A simpler approach is to find summary measures for the clusters and then analyse the summary measures using ordinary linear models.7
Competing interests
No relevant disclosures.
References
- Campbell MJ. Walters SJ. How to design, analyse and report cluster randomized trials in medicine and health services research. Chichester: Wiley, 2014.
- Donner A, Klar N. Design and analysis of cluster randomized trials in health research. London: Arnold, 2000.
- Eldridge S, Kerry S. A practical guide to cluster randomized trials in health services research. Chichester: Wiley, 2012.
- Hayes RJ, Moulton LH. Cluster randomized trials. Boca Raton: Chapman and Hall/CRC, 2009.
- Campbell MJ. Challenges of cluster randomized trials. J Comp Eff Res 2014; 3: 271–281.
- Campbell MJ. Randomisation in cluster trials. Scharrvids, May 2015. https://www.youtube.com/watch?v=PD4_DFiwg3E&index=3&list=PL1mJ7IZ3qFxiYlJ-jGZ1cf__ZVC08mymM (accessed Mar 2018).
- Matthews JN, Altman DG, Campbell MJ, Royston P. Analysis of serial measurements in medical research. BMJ 1990; 300: 230–235.
- Abramsky T, Devries K, Kiss L, et al. Findings from the SASA! study: a cluster randomized controlled trial to assess the impact of a community mobilization intervention to prevent violence against women and reduce HIV risk in Kampala, Uganda. BMC Med 2014; 12: 12.
- Davies MJ, Heller S, Skinner TC, et al. Effectiveness of the diabetes education and self‐management for ongoing and newly diagnosed (DESMOND) programme for people with newly diagnosed type 2 diabetes: cluster randomized controlled trial. BMJ 2008; 336: 491–495.
- REPOSE Study Group. Relative effectiveness of insulin pump treatment over multiple daily injections and structured education during flexible intensive insulin treatment for type 1 diabetes: cluster randomized trial (REPOSE). BMJ 2017; 30; 356: j1285.
Provenance: Commissioned; externally peer reviewed.
Interpreting Australian Stillbirth Rate Trends: Implications for Surveillance and Continuous Quality Improvement
Aleena M. Wojcieszek, Kirstine Sketcher-Baker, Christine Andrews, Michael Coory, Imogen Kettle, Melissa Malivoire, David Ellwood, Vicki Flenady
Paracetamol in Pregnancy: Uncertain Evidence, Certain Consequences
David J. Tunnicliffe, Miranda Cumpston, Debra Kennedy, Margie Danchin, Armando Teixeira-Pinto
Fatty Liver Disease in Australia: A Narrative Review on the Epidemiology, Natural History, Prognostication and Management in People With Metabolic Dysfunction
Karl Vaz, Daniel Clayton-Chubb, William W. Kemp, Stuart K. Roberts, Ammar Majeed
Birth prevalence, clinical sequelae, and management of congenital cytomegalovirus infections in Australia, 1999–2023: a national prospective study
Ece Egilmezer, Suzy M Teutsch, Carlos Nunez, Stuart T Hamilton, Adam W Bartlett, Pamela Palasanthiran, Elizabeth J Elliott, William D Rawlinson
The number of cancer‐related deaths that could be attributable to spatial disparities in survival in Australia, 2010–2019: a retrospective population‐based cohort study
Charlotte K Bainomugisa, Jessica Cameron, Paramita Dasgupta, Peter Baade
Mandatory research projects during medical specialist training in Australia and New Zealand
Paulina Stehlik, Caitlin Brandenburg, David A Henry