


The known There are no systematically reported national data on the structure and characteristics of general medical practice in Australia.
The new Network analysis of 21 years of Medicare claims indicates that general practice communities have generally increased in size, continuity of care and patient loyalty have remained stable, and greater sharing of patients by GPs is associated with greater patient loyalty.
The implications Our new approach to analysing routinely collected data allows continuous monitoring of the characteristics of Australian general practices and how these characteristics affect patient care.
A strong primary care system that delivers appropriate care at the right time and in the right place is the bedrock of the Australian health care system. General practitioners are the major providers of primary care and serve as gatekeepers to specialist care and other components of the health care system. Almost all GP services are provided privately on a fee-for-service basis. Rebates are provided to patients by the national health insurance scheme according to the Medicare Benefits Schedule (MBS), and patients may seek care from several providers and at multiple locations. However, there is a dearth of information on the organisation and characteristics of Australian general practice. For example, the proportion of general practices that are accredited has not been reported since 2011,1 as the total number of practices is not known.
Since the final Annual Survey of Divisions (ASD) in 2011–12,2 national data on the structure and characteristics of general practices have not been systematically reported. The Bettering the Evaluation and Care of Health (BEACH) survey3 was the only national study of general practice activity, describing the characteristics and activity of a representative sample (13% of practising GPs), but the program ended in 2016. The Medical Directory of Australia (MDA), published by the Australian Medical Publishing Company (http://www.ampco.com.au/mda-online), publishes estimates of the size of the GP workforce, but their data are based on mailing addresses, which do not necessarily match practice location. The National Health Workforce Dataset (NHWDS) includes data based on a survey voluntarily completed by practitioners during their annual registration, but it focuses on practitioners, not practices.4 Claims for subsidised services in the MBS are made on the basis of Medicare provider numbers, but, as practice location is not routinely linked, MBS data provide no information about practice activities.
Efforts to understand the complex determinants of the quality of and variations in health care have led to the emergence of a new research approach, the application of data-driven methods to identifying and characterising networks of health care providers. A network is a set of people or groups of individuals, organisations, or other entities (“nodes”) with a pattern of interactions (“edges”).5 Administrative claims data have been analysed in the United States to investigate variations in the characteristics of patient-sharing networks,6,7 how these naturally occurring networks of providers are related to variations in health care costs, and quality of care.8,9
In this article, we report the first study to apply network analysis of national Medicare claims data in Australia to derive provider practice communities (PPCs); that is, groups of providers who share patients with each other to a greater extent than with other provider groups, as in group general practices (although a PPC does not necessarily correspond directly with a specific group practice). Using Medicare claims for the 21-year period 1994–2014 and a novel graph-partitioning algorithm, we examined trends in the number of PPCs and their characteristics, including size, bulk-billing rate, continuity of care, patient loyalty, and patient sharing.
Methods
Data source
We analysed data drawn from publicly released datasets of all MBS claims during the 21-year period 1994–2014 for a random sample of Australian residents (downloaded from www.data.gov.au on 26 August 2016). These datasets were constructed by selecting patients with a Medicare patient identification number ending in the same digit, resulting in an unbiased sample comprising 10% of patients who claimed Medicare services during the reference period.10 Claims for unreferred visits to GPs in consulting rooms during normal hours (MBS items 3, 23, 36, 44, 52, 53, 54, 5711) for each year were used for constructing networks.
Network construction and identifying provider practice communities
We constructed bipartite provider–patient networks, including two node types (providers and patients), with edges indicating at least one consultation of a patient with a provider.5 Locations of providers who worked at multiple locations were treated separately for the process of finding communities. PPCs were identified after network construction by graph partitioning or cluster identification.5 We identified PPCs with hierarchical stochastic block modelling,12 clustering GPs and patients into blocks using likelihood maximisation. In comparison with the traditional method of modularity maximisation, this technique is more robust for a very large graph and can overcome the problem of resolution limit, allowing small blocks to be detected.13 Further details on our methods are included in the online Appendix.
Statistical analyses
We calculated descriptive statistics for claims, patients, providers, and PPCs for each calendar year, but present full results only for the years 1994, 1999, 2004, 2009 and 2014. Statistics related to claims and patients per provider or PPC were inflated by a factor of 10 to account for the sampling of the claims data.
Short (items 3, 52), standard (items 23, 53), and long and prolonged consultations (items 36, 44, 54, 57) were classified by MBS item numbers. Bulk-billed claims were defined as those that attracted 100% direct payment; all other claims were defined as privately billed. “Continuity of care” was defined as the proportion of a patient’s claims that were for services provided by their most frequently visited GP (usual provider continuity of care) or PPC (usual PPC continuity of care). “Shared patient fraction” was defined as the mean proportion of patients of an individual GP shared with other GPs in the same PPC; “community patient degree” was defined as the mean number of GPs in the PPC seen by individual patients.
Network construction and graph partitioning were performed with the Python package graph-tool (https://graph-tool.skewed.de/); other analyses were performed in R 3.3.2 (R Foundation for Statistical Computing).
Ethics approval
Ethics approval was not required for our analysis of de-identified MBS data.
Results
During 1994–2014, an average 9.7 million claims for unreferred visits to GPs by 1.7 million patients were processed by Medicare each year. The numbers of claims and patients increased from 9 million claims for 1.5 million patients in 1994 to 11.2 million claims for almost 2 million patients in 2014. The mean age of patients increased from 35 years (standard deviation [SD], 22 years) in 1994 to 39 years (SD, 23 years) in 2014. Throughout the study period, 53% of patients were female; the median number of claims per patient was stable at four per year for consultations with a median two GPs (Box 1).
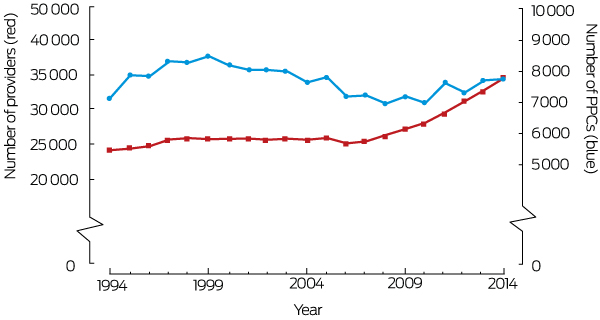
The number of providers increased from 24 265 in 1994 to 34 590 in 2014 (Box 2), and the numbers of claims and patients per provider were lower in 2014 than in 1994 (Box 1). Throughout the study period, the median number of practice locations per provider was one. The proportion of providers who did not share patients with other providers declined from 0.65% in 1994 to 0.21% in 2014. While the median number of shared patients per provider was stable, the median number of peers with whom a provider shared patients decreased from 131 (interquartile range [IQR], 56–232) to 92 (IQR, 50–158) (Box 1).
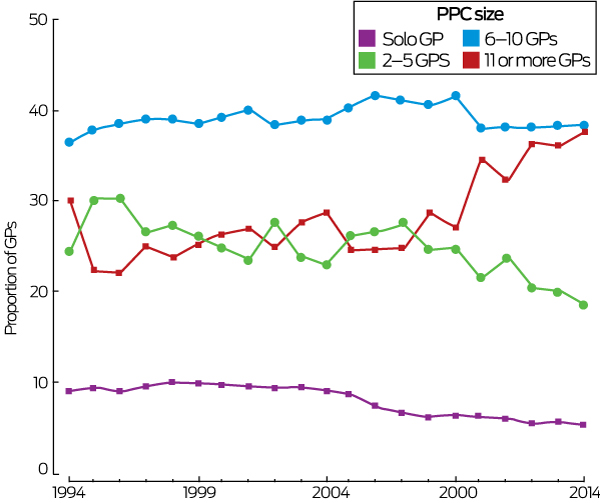
The number of PPCs fluctuated between 7000 and 8500 during the study period (1994, 7147 PPCs; 2014, 7747 PPCs) (Box 2). The estimated median number of claims for in-hours consultations per PPC increased from 5000 in 1994 to 9980 in 2014; the estimated number of patients per PPC rose from 1450 patients to 2520 (Box 1). The median number of providers per PPC increased from two (IQR, 1–7) to four providers (IQR, 1–10) (Box 1). The proportion of PPCs with only one provider decreased from 50% in 1994 to 39% in 2014, and the proportion of larger PPCs (six or more providers) increased from 32% in 1994 to 43% in 2014 (Box 1). Similarly, the numbers of providers working in sole provider (from 9% to 5%) and small PPCs (2–5 providers; from 24% to 18%) declined, and the number of providers working in large PPCs (more than 11 providers) increased from 30% in 1994 to 38% in 2014; the proportion working in PPCs of 6–10 providers was fairly constant (38–40%) (Box 3).
Box 4 depicts examples of PPC structures and corresponding metrics related to continuity of care and patient sharing. Both the shared patient fraction (r = 0.54; P < 0.001) and community patient degree (r = 0.47; P < 0.001) were positively correlated with the usual PPC continuity of care proportion (patient loyalty).
The proportions of claims for brief consultations (less than 5 minutes: 1.4–2.8%) and long and prolonged consultations (at least 30 minutes: 8–14%) fluctuated (Box 5). The proportions of patients who saw the same provider for at least 75% of their consultations (50–55%) or who saw providers in the same PPC for 75% of their consultations (75–78%) were fairly stable (Box 5).
The proportion of claims that were bulk-billed declined from 78% in 1994 to 70% in 2004, but increased to 82% in 2014. There were corresponding changes in the proportions of patients whose consultations were all bulk-billed and of providers who bulk-billed all patients. As expected, the proportions of young (under 13 years of age) and older patients (75 years or older) whose claims were bulk-billed were larger than for the overall population (Box 5).
The proportion of PPCs in which all providers bulk-billed all consultations ranged from 22% in 1994 to 29% in 2014. The proportion of PPCs where all providers privately billed all claims declined from 19% in 1994 to 8% in 2014 (Box 5).
Discussion
Our study is the first to analyse Australian Medicare claims data — and internationally the first to analyse a whole-of-population national sample — to construct real world GP provider–patient networks, to identify communities of GP providers, and to explore the characteristics of these communities, including novel metrics for describing patient sharing that can be generated only by network analysis.
Ours is also the first study of medical provider networks to apply a novel hierarchical block modelling algorithm that can effectively overcome the structural and computational hurdles associated with large scale data. For example, common modularity-based methods of network construction may have limited capacity to detect small communities when using large samples; as a result, previous network analyses of physicians have created “communities” of hundreds or thousands of practitioners.6,9 Moreover, studies of provider communities in the United States have included only a subset of the population (eg, US Medicare beneficiaries aged 65 or more),8,9 while Australian studies have been limited to private health insurance claims for in-hospital care.14,15
No contemporary data for the number of general practices in Australia have been published with which we could compare our findings. The total number of PPCs for 2009 generated by our analysis (7192) was similar to the estimated number of practices reported by the ASD for 2009 (7123, based on unique locations).16 However, the number of providers in our data (27 303 in 2009) exceeded the ASD estimate (23 518).16 The number of providers in our 2014 data was also slightly higher than published by the Department of Health17 and the Royal Australian College of General Practitioners,18 possibly reflecting our inclusion of some specialists who claimed GP-like consultation items.
Similarly, there are no recent comparable data on the sizes of general practices in Australia. The distribution of PPCs in 2009 according to number of providers differed from the ASD estimates: in our data, the proportions of PPCs with one, 2–5, or 6 or more providers were 41%, 21% and 38% respectively, compared with 35%, 44% and 21% of ASD practices.16 These differences underscore the fact that PPCs are constructs based on the patterns of interaction between providers and patient populations, rather than representing employment or business relationships. For example, locums who see substantial numbers of patients may be included in a PPC but not be included in a practice survey.
Our data indicate that GP PPCs in Australia have grown in size, while the median number of claims per patient per year has remained stable over the past 20 years. These findings probably reflect a growing preference for flexible working hours, a higher proportion of part-time medical providers, and increasing corporatisation of practice ownership.19 Our findings on trends in bulk-billing are consistent with the reported drop in the number of bulk-billed claims to a record low in 2003–04,20 before increasing after bulk-billing incentives were introduced (“Strengthening Medicare”) in 2004.21
Usual provider continuity of care and patient loyalty were both stable during 1994–2014; earlier population-level data for Australia are not available. The proportions of patients who saw the same provider for at least 75% of consultations (2014: 50%) or a provider in the same PPC for at least 75% of consultations (78%) were lower than estimates based on survey self-report; for example, in 2014–15, 98% of Australian patients aged 45 or more indicated that they had a usual GP or usual place of care.22 However, differences in methods mean that these figures are not directly comparable.
We found that the density of patient sharing within a PPC was positively correlated with patient loyalty. The relationships between such metrics and patient outcomes could be investigated with the aim of informing practice design; for example, for developing team-based GP care models. Further, the high level of patient loyalty we found has implications for the design of incentive programs for encouraging quality primary care if their success relies on the patients’ choice of practice.
Limitations
The analysed data covered only the claims of 10% of all patients for the most commonly used GP item numbers; some providers (especially those with very few claims) may have been omitted. Moreover, there were no external standard data with which we could compare our findings. Including some specialists who claimed GP-like consultation items may have inflated the number of practitioners included in our analysis. PPCs may not be identical with bricks-and-mortar medical practices or business entities, as they are constructed solely according to patterns of patient sharing. Comparison of our PPCs with provider and practice locations in the Department of Health database would be enlightening. However, we analysed real world data, and our study can be readily replicated and was not subject to selection and non-response bias, in contrast to Australian surveys of general practice activity.2-4 Further, PPCs offer a new approach to detailed exploration of our general practice system while preserving GP and practice confidentiality.
Conclusion
The novel data-driven methods we have developed provide a new toolkit for primary care research in Australia that maximises the power of big data analysis. These methods will allow ongoing exploration of the structure and characteristics of general practice, and of medical provider communities more broadly, as well as of how both PPC- and provider-level factors influence the care that patients receive. Priorities for future analyses include exploring how PPC characteristics are related to the quality and quantity of care received by the PPC patient population, and to measures of unnecessary clinical variation.23
Box 1 – Characteristics of patients, general practitioner providers, and provider practice communities (PPCs) recorded in a 10% sample of Medicare beneficiary data, 1994–2014
|
|
1994 |
1999 |
2004 |
2009 |
2014 |
||||||||||
|
|
|||||||||||||||
|
Patients |
|
|
|
|
|
||||||||||
|
Number |
1 507 673 |
1 595 388 |
1 637 557 |
1 802 039 |
1 963 538 |
||||||||||
|
Age (years), mean (SD) |
35 (22) |
36 (22) |
38 (22) |
39 (23) |
39 (23) |
||||||||||
|
Sex (women) |
52.7% |
52.8% |
53.2% |
52.9% |
52.7% |
||||||||||
|
Claims per patient, median (IQR) |
4 (2–8) |
4 (2–8) |
4 (2–7) |
4 (2–7) |
4 (2–7) |
||||||||||
|
Providers per patient, median (IQR) |
2 (1–3) |
2 (1–3) |
2 (1–3) |
2 (1–3) |
2 (1–3) |
||||||||||
|
Providers |
|
|
|
|
|
||||||||||
|
Number |
24 265 |
25 840 |
25 754 |
27 303 |
34 590 |
||||||||||
|
Practice locations per provider, median (IQR) |
1 (1–2) |
1 (1–2) |
1 (1–2) |
1 (1–2) |
1 (1–2) |
||||||||||
|
Patients per provider (estimated),* median (IQR) |
1260 (380–2110) |
1240 (350–2110) |
1210 (450–1980) |
1290 (615–2070) |
1140 (520–1870) |
||||||||||
|
Claims per provider (estimated),* median (IQR) |
3130 (660–5670) |
3110 (630–5690) |
3000 (840–5270) |
3160 (1220–5370) |
2730 (990–4760) |
||||||||||
|
Providers with no shared patients |
158 (0.65%) |
150 (0.58%) |
152 (0.59%) |
80 (0.29%) |
73 (0.21%) |
||||||||||
|
Shared patients per provider (estimated),* median (IQR) |
1000 (340–1720) |
990 (320–1710) |
940 (380–1560) |
1010 (500–1690) |
930 (440–1560) |
||||||||||
|
GPs with whom a provider had shared patients, median (IQR) |
131 (56–232) |
117 (48–215) |
94 (45–166) |
93 (51–159) |
92 (50–158) |
||||||||||
|
Provider practice communities (PPCs) |
|
|
|
|
|
||||||||||
|
Number of constructed PPCs |
7147 |
8484 |
7640 |
7192 |
7747 |
||||||||||
|
Claims per PPC (estimated),* median (IQR) |
5000 (40–19 940) |
2990 (30–19 020) |
4655 (30–19 460) |
9570 (160–22 480) |
9980 (190–23 800) |
||||||||||
|
Patients per PPC (estimated),* median (IQR) |
1450 (30–5420) |
870 (20–4980) |
1235 (20–5192) |
2510 (100–5932) |
2520 (120–6015) |
||||||||||
|
Providers per PPC,† median (IQR) |
2 (1–7) |
1 (1–7) |
1 (1–8) |
3 (1–9) |
4 (1–10) |
||||||||||
|
PPC size† |
|
|
|
|
|
||||||||||
|
One provider |
49.9% |
52.8% |
50.1% |
41.1% |
39.4% |
||||||||||
|
2–5 providers |
17.9% |
16.5% |
16.8% |
20.5% |
17.4% |
||||||||||
|
6–10 providers |
17.0% |
16.7% |
17.6% |
20.8% |
20.7% |
||||||||||
|
11 or more providers |
15.2% |
14.0% |
15.6% |
17.6% |
22.5% |
||||||||||
|
|
|||||||||||||||
|
IQR = interquartile range; SD = standard deviation. * Inflated by a factor of 10 to account for sampling of the claims data. † Providers within a PPC are unique. |
|||||||||||||||
Box 2 – Numbers of general practitioner providers and numbers of provider practice communities (PPCs) recorded in a 10% sample of Medicare beneficiary data, 1994–2014
Box 3 – Proportions of general practitioners working in provider practice communities (PPCs) of different sizes, according to most common practice location, 1994–2014
Box 4 – Visualisation of six provider practice communities (PPCs) differing in size and the extent of shared patient care*
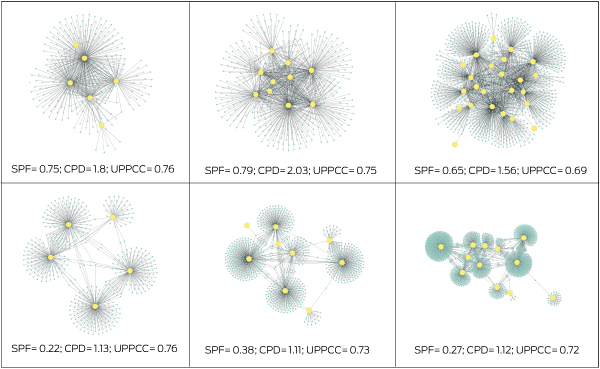
* Yellow dots represent general practitioner providers; blue dots represent patients; grey lines represent patients having one or more consultations with a GP. CPD = community patient degree; SPF = shared patient fraction; UPPCC = usual PPC continuity of care.
Box 5 – Characteristics of the services provided to patients by general practitioner providers and in provider practice communities (PPCs) in a 10% sample of Medicare beneficiary data, 1994–2014
|
|
1994 |
1999 |
2004 |
2009 |
2014 |
||||||||||
|
|
|||||||||||||||
|
Claims |
|
|
|
|
|
||||||||||
|
Number |
9 010 940 |
9 564 465 |
9 109 690 |
9 975 863 |
11 234 155 |
||||||||||
|
Bulk-billed claims |
77.5% |
78.7% |
69.8% |
77.6% |
81.5% |
||||||||||
|
Length of consultation |
|
|
|
|
|
||||||||||
|
Brief |
2.2% |
1.6% |
1.4% |
2.8% |
2.6% |
||||||||||
|
Standard |
89.8% |
87.0% |
84.7% |
86.5% |
82.9% |
||||||||||
|
Long or prolonged |
7.9% |
11.4% |
13.9% |
10.7% |
14.5% |
||||||||||
|
Patients |
|
|
|
|
|
||||||||||
|
All consultations bulk-billed |
|
|
|
|
|
||||||||||
|
All ages |
60.2% |
61.2% |
47.6% |
57.9% |
63.3% |
||||||||||
|
Under 13 years |
61.3% |
63.4% |
58.2% |
74.5% |
80.4% |
||||||||||
|
75 years or older |
80.0% |
75.6% |
60.9% |
77.6% |
78.8% |
||||||||||
|
Continuity of care: usual provider |
|
|
|
|
|
||||||||||
|
< 0.75 |
47.7% |
48.2% |
45.4% |
47.3% |
49.8% |
||||||||||
|
0.75–0.99 |
14.3% |
14.3% |
14.0% |
14.0% |
13.8% |
||||||||||
|
1.0 |
38.0% |
37.5% |
40.6% |
38.7% |
36.4% |
||||||||||
|
Continuity of care: usual PPC |
|
|
|
|
|
||||||||||
|
< 0.75 |
25.3% |
24.9% |
22.0% |
21.6% |
22.0% |
||||||||||
|
0.75–0.99 |
15.2% |
14.9% |
13.5% |
13.2% |
13.7% |
||||||||||
|
1.0 |
59.5% |
60.2% |
64.5% |
65.1% |
64.3% |
||||||||||
|
GP providers |
|
|
|
|
|
||||||||||
|
Bulk-billed all claims |
|
|
|
|
|
||||||||||
|
All ages |
22.7% |
23.2% |
17.0% |
22.4% |
30.1% |
||||||||||
|
Under 13 years |
36.0% |
37.7% |
31.1% |
50.7% |
59.9% |
||||||||||
|
75 years or older |
66.2% |
63.6% |
48.2% |
62.0% |
66.2% |
||||||||||
|
Provider practice communities |
|
|
|
|
|
||||||||||
|
All GPs: for all patients |
|
|
|
|
|
||||||||||
|
All bulk-billed |
22.2% |
24.8% |
20.5% |
25.4% |
29.1% |
||||||||||
|
All privately billed |
18.6% |
22.2% |
22.4% |
9.8% |
7.6% |
||||||||||
|
Other |
59.2% |
53.0% |
57.1% |
64.8% |
63.3% |
||||||||||
|
All GPs: for patients under 13 |
|
|
|
|
|
||||||||||
|
All bulk-billed |
26.3% |
30.5% |
24.7% |
39.1% |
43.8% |
||||||||||
|
All privately billed |
8.9% |
9.8% |
8.6% |
4.8% |
4.2% |
||||||||||
|
Other |
64.7% |
59.7% |
66.7% |
56.1% |
52.0% |
||||||||||
|
All GPs: for patients 75 or older |
|
|
|
|
|
||||||||||
|
All bulk-billed |
49.1% |
49.7% |
36.9% |
47.0% |
49.3% |
||||||||||
|
All privately billed |
5.9% |
7.7% |
7.6% |
4.3% |
4.4% |
||||||||||
|
Other |
45.0% |
42.6% |
55.5% |
48.7% |
46.3% |
||||||||||
|
|
|||||||||||||||
|
|
|||||||||||||||
Received 12 December 2017, accepted 15 May 2018
- Bich Tran1
- Peter Straka2
- Michael O Falster1
- Kirsty A Douglas3
- Thomas Britz2
- Louisa R Jorm1
- 1 Centre for Big Data Research in Health, UNSW Sydney, Sydney, NSW
- 2 UNSW Sydney, Sydney, NSW
- 3 Australian National University Medical School, Canberra, ACT
We thank Tim Churches (the Ingham Institute), Vivien Nguyen (the Australasian Medical Publishing Company, AMPCo) and Elena Keller for helpful discussions. This investigation includes computations undertaken on the Linux computational cluster Katana, supported by the Faculty of Science at UNSW Sydney. Michael Falster is supported by a National Health and Medical Research Council Early Career Fellowship (1139133).
No relevant disclosures.
- 1. Australian Government Productivity Commission. Report on Government Services 2018. Part E (Health), Chapter 10: Primary and community health. Jan 2018. https://www.pc.gov.au/research/ongoing/report-on-government-services/2018/health/primary-and-community-health (viewed Apr 2018).
- 2. Primary Health Care Research and Information Service. Annual Survey of Divisions (ASD): 1993–2012. Archived: https://web.archive.org/web/20171016101008/http://www.phcris.org.au/products/asd/ (viewed Apr 2018).
- 3. Britt H, Miller GC, Henderson J, et al. General practice activity in Australia 2015–16 (General Practice series no. 40). Sydney: Sydney University Press, 2016. https://ses.library.usyd.edu.au/bitstream/2123/15514/5/9781743325148_ONLINE.pdf (viewed Apr 2018).
- 4. Australian Government Department of Health. Health workforce data. Updated Jan 2017. http://www.health.gov.au/internet/main/publishing.nsf/content/health_workforce_data (viewed Apr 2018).
- 5. Scott J. Social network analysis. London: SAGE, 2013.
- 6. Landon BE, Keating NL, Barnett ML, et al. Variation in patient-sharing networks of physicians across the United States. JAMA 2012; 308: 265-273.
- 7. Landon BE, Onnela JP, Keating NL, et al. Using administrative data to identify naturally occurring networks of physicians. Med Care 2013; 51: 715-721.
- 8. Barnett ML, Christakis NA, O’Malley J, et al. Physician patient-sharing networks and the cost and intensity of care in US hospitals. Med Care 2012; 50: 152-160.
- 9. Casalino LP, Pesko MF, Ryan AM, et al. Physician networks and ambulatory care-sensitive admissions. Med Care 2015; 53: 534-541.
- 10. Australian Government Department of Health. Public release of linkable 10% sample of Medicare Benefits Scheme (Medicare) and Pharmaceutical Benefits Scheme (PBS) data [media release]. Pharmaceutical Benefits Scheme (PBS) 11 Aug 2016. http://www.pbs.gov.au/info/news/2016/08/public-release-of-linkable-10-percent-mbs-and-pbs-data (viewed Apr 2018).
- 11. Australian Government Department of Health. Medicare Benefits Schedule book. Category 1. Operating from 01 January 2015. http://www.health.gov.au/internet/mbsonline/publishing.nsf/Content/9B067E48C350D16BCA257DAA007C462D/%24File/201501-Cat1.pdf (viewed Mar 2018).
- 12. Peixoto TP. Nonparametric Bayesian inference of the microcanonical stochastic block model. Phys Rev E 2017; 95: 012317.
- 13. Fortunato S, Barthelemy M. Resolution limit in community detection. Proc Natl Acad Sci U S A 2007; 104: 36-41.
- 14. Wang F, Srinivasan U, Uddin S, Chawla S. Application of network analysis on healthcare. In: IEEE/ACM Conference on Advances in Social Networks Analysis and Mining, Beijing, 2014; pp. 596-603. https://ieeexplore.ieee.org/document/6921647/ (viewed May 2018).
- 15. Uddin S, Hossain L, Kelaher M. Effect of physician collaboration network on hospitalization cost and readmission rate. Eur J Public Health 2012; 22: 629-633.
- 16. Carne A, Howard S, Bywood P. Summary data report of the 2010–2011 Annual Survey of Divisions of General Practice. Adelaide: Primary Health Care Research and Information Service, Flinders University; Australian Government Department of Health and Ageing, 2012. https://dspace.flinders.edu.au/xmlui/bitstream/handle/2328/36266/SDR%202010-2011.pdf?sequence=1&isAllowed=y (viewed May 2018).
- 17. Australian Government Department of Health. GP workforce statistics: 2001–02 to 2015–16. Updated Oct 2017. http://health.gov.au/internet/main/publishing.nsf/Content/General+Practice+Statistics-1 (viewed Mar 2018).
- 18. Royal Australian College of General Practitioners. A strong professional home: the RACGP annual report 2014–15. https://www.racgp.org.au/download/Documents/AnnualReports/annual-report-2014-15.pdf (viewed May 2018).
- 19. Erny-Albrecht K, Bywood P. Corporatisation of general practice — impact and implications. PHCRIS policy issue review. Adelaide: Primary Health Care Research and Information Service, 2016. https://www.researchgate.net/publication/317399834_Corporatisation_of_general_practice_-_impact_and_implications_PHCRIS_Policy_Issue_Review_Adelaide_Primary_Health_Care_Research_Information_Service (viewed May 2018).
- 20. Elliot A. The decline in bulk billing: explanations and implications (Current Issues Brief no. 3 2002-2003). Sept 2002. http://www.aph.gov.au/About_Parliament/Parliamentary_Departments/Parliamentary_Library/Publications_Archive/CIB/cib0203/03CIB03#howmuchhasitdeclined (viewed Sept 2017).
- 21. Day SE, Alford K, Dunt D, et al. Strengthening Medicare: will increasing the bulk-billing rate and supply of general practitioners increase access to Medicare-funded general practitioner services and does rurality matter? Aust New Zealand Health Policy 2005; 2: 18.
- 22. Australian Bureau of Statistics. Usual general practitioner and usual place of care. In: Survey of health care. Australia 2016 (Cat. No. 4343.0). Canberra: ABS, 2017; pp. 9-10.
- 23. Australian Commission on Safety and Quality in Health Care; Australian Institute of Health and Welfare. The second Australian atlas of healthcare variation. 2017. https://www.safetyandquality.gov.au/atlas/atlas-2017/ (viewed Sept 2017).
Abstract
Objectives: To investigate the organisation and characteristics of general practice in Australia by applying novel network analysis methods to national Medicare claims data.
Design: We analysed Medicare claims for general practitioner consultations during 1994–2014 for a random 10% sample of Australian residents, and applied hierarchical block modelling to identify provider practice communities (PPCs).
Participants: About 1.7 million patients per year.
Main outcome measures: Numbers and characteristics of PPCs (including numbers of providers, patients and claims), proportion of bulk-billed claims, continuity of care, patient loyalty, patient sharing.
Results: The number of PPCs fluctuated during the 21-year period; there were 7747 PPCs in 2014. The proportion of larger PPCs (six or more providers) increased from 32% in 1994 to 43% in 2014, while that of sole provider PPCs declined from 50% to 39%. The median annual number of claims per PPC increased from 5000 (IQR, 40–19 940) in 1994 to 9980 (190–23 800) in 2014; the proportion of PPCs that bulk-billed all patients was lowest in 2004 (21%) and highest in 2014 (29%). Continuity of care and patient loyalty were stable; in 2014, 50% of patients saw the same provider and 78% saw a provider in the same PPC for at least 75% of consultations. Density of patient sharing in a PPC was correlated with patient loyalty to that PPC.
Conclusions: During 1994–2014, Australian GP practice communities have generally increased in size, but continuity of care and patient loyalty have remained stable. Our novel approach to the analysis of routinely collected data allows continuous monitoring of the characteristics of Australian general practices and their influence on patient care.