


The known Otitis media is common in children, especially in indigenous populations, but accurate diagnosis is difficult. Access to otolaryngologists, experts in diagnosing the condition, is particularly limited in the disadvantaged areas where it is more prevalent. Audiology services are generally more readily available.
The new Otolaryngologists diagnosed otitis media in 251 of 989 Aboriginal children (29%). There was substantial agreement (greater than 90%) between diagnoses by audiologists and otolaryngologists, and no tympanic perforations were missed by the audiologists.
The implications In settings where access to otolaryngologists is limited, audiologists may appropriately triage children and select those requiring specialist review for otitis media.
Otitis media (OM) is very common in children,1 but is more severe and disabling in indigenous populations. The onset of OM in Australian Aboriginal and Torres Strait Islander children is frequently earlier and the disorder has a more prolonged and complicated course than in non-Indigenous children.
Chronic or recurrent OM is the leading cause of hearing loss in children, with long term educational and psychosocial impacts.2 Early detection is critical, but there is no single reference diagnostic test, and expert clinical judgement is required. Such expertise may be limited in the primary health care setting, where most diagnoses of OM are made, particularly in the rural and remote settings in which the OM burden is greatest.3,4 Despite OM being one of the most common childhood illnesses and having important, long term health consequences,3 diagnostic inaccuracy is common,5-7 leading to delayed treatment, under- or overtreatment, and an increased risk of complications, including hearing loss8,9 and antibiotic resistance.3
In many countries, general practitioners manage children with OM, some of whom are referred to audiologists. Otolaryngologists are specialists in the diagnosis and treatment of OM, but access to their services is limited, especially outside major urban centres.4 Audiologists are usually more readily available, and could provide an initial assessment before the child is referred to an otolaryngologist. Whether audiologists can reliably triage at risk children for specialist otolaryngology management, however, is unclear.
The Study of Environment on Aboriginal Resilience and Child Health (SEARCH)10 is a cohort study of urban and regional Australian Aboriginal children in New South Wales designed to determine predictors of health and wellbeing and the critical time points for intervention. SEARCH evolved from extensive engagement with Aboriginal communities, during which ear health was identified as a health care priority. In the investigation reported in this article, we sought to determine the level of agreement between OM diagnoses by audiologists and otolaryngologists, and to evaluate whether the triage of children by audiologists could be an effective referral and care strategy in settings with limited access to otolaryngology services.
Methods
Study design
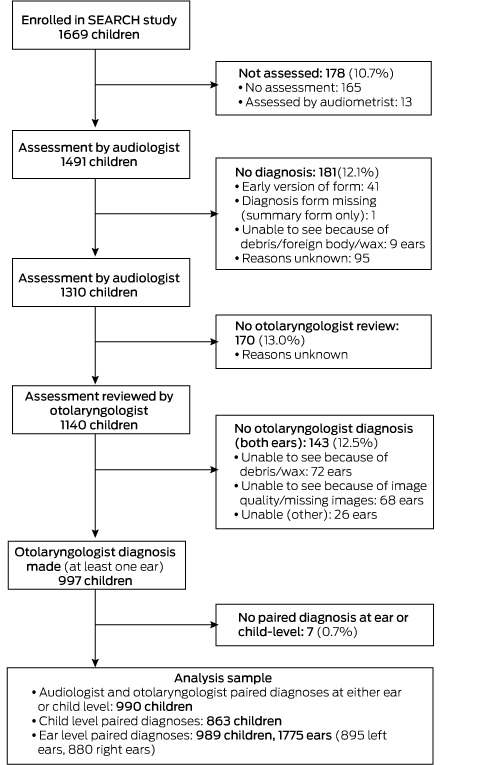
We applied the Standards for Reporting of Diagnostic Accuracy Studies (STARD).11 The entire SEARCH cohort of 1669 children (0–17 years of age) from four participating Aboriginal Community Controlled Health Services (ACCHSs) across New South Wales (three metropolitan, one regional centre) were eligible to participate.10 Between 2008 and 2012, the four ACCHSs cooperated with investigators to recruit and enrol children in SEARCH. Each child was included in this study only once. All children and their caregivers were interviewed by Aboriginal research officers; a range of clinical measures were recorded as part of baseline assessment, including results of ear assessments. The main reason for missing ear assessments (165 children) was refusal of permission by caregivers.
Ear assessment
Each participating child was assessed by one of five audiologists using age-appropriate audiometry (Interacoustics AD226/AC30 audiometer), tympanometry (Earscan tympanometers), and standard and pneumatic video-otoscopy (Inline Systems otoscopes). No manufacturer was involved in the assessments or analyses. Audiologists recorded diagnoses for each ear. The otoscopy images, pneumatic videos, and tympanometry results, but not the diagnosis or clinical history, were then forwarded electronically to one of three otolaryngologists for review at their convenience, sometimes several months after the assessment (online Appendix, figure 1). We used the otolaryngologists’ diagnoses as the reference standard, both to be consistent with earlier studies,12-15 and because it is usually otolaryngologists who determine how children will be managed.
At the beginning of this study, the audiologist who conducted 59% of the assessments had 26 years’ experience; the other four had 1–14 years’ experience. The three otolaryngologists, including the first Aboriginal surgeon in Australia, had extensive experience in treating ear disease in Aboriginal Australians.
Statistical analysis
As we deemed tympanic membrane perforations to be the most important clinical ear-related problem, the nine possible audiologist diagnoses were reduced to three categories for analysis at the child and ear levels (online Appendix, table 1): OM with perforation (acute OM with perforation, dry perforation, or chronic suppurative OM); OM without perforation (acute OM without perforation, recurrent acute OM, OM with effusion, chronic OM with effusion, or undifferentiated OM); and no middle ear pathology (“normal”). Child-level diagnoses were based on the highest order finding in either ear; if one ear was classified as normal and a finding for the other was not recorded, the child-level diagnosis was classified as “missing” data. We excluded 13 assessments performed by audiometrists or training audiologists.
Differences between the characteristics of those included in or excluded from the analysis, and between audiologist diagnoses for children with and without an otolaryngologist review were assessed in χ2 tests (categorical variables) or Wilcoxon rank sum test (ordinal variables). We calculated the observed agreement of ear- and child-level diagnoses by audiologists and otolaryngologists. We performed Stuart–Maxwell tests of marginal homogeneity to assess whether there were systematic differences between audiologists’ and otolaryngologists’ diagnoses.
Inter-rater agreement of diagnoses (OM with perforation, OM without perforation, normal) by audiologists and otolaryngologists was expressed as linearly weighted κ values (proportion of agreement beyond chance). Comparisons were made between all audiologists and all otolaryngologists, and for each audiologist–otolaryngologist pair with a sufficient sample size (at least 32 diagnosis pairs for 80% power, 2-tailed).16 Prevalence- and bias-adjusted linearly weighted κ values were calculated to assess the impact on the level of agreement of imbalances in the prevalence of the diagnoses and bias (ie, difference in the frequency of diagnoses in audiologists’ and otolaryngologists’ assessments);17 low or high proportions of responses for one or more diagnoses can reduce the magnitude of κ. We adjusted for bias by calculating chance agreement, assuming that the marginal distributions of audiologists’ and otolaryngologists’ diagnoses were equivalent. We applied standard κ interpretations of observer agreement (< 0.21, slight agreement; 0.21–0.40, fair agreement; 0.41–0.60, moderate agreement; 0.61–0.80, substantial agreement; > 0.80, almost perfect agreement).18
To assess accuracy, we calculated the sensitivity, specificity, positive predictive value (PPV), and negative predictive value (NPV) of the audiologists’ diagnoses at the ear and child levels (normal v OM).12-15 To assess whether there was a learning effect for use of study equipment, we compared agreement between audiologists and otolaryngologists for the first 100 ear assessments by each audiologist, and separately for all subsequent assessments. We also compared agreement between diagnoses for left and right ears.
We performed sensitivity analyses by excluding ears or children if there was any uncertainty about the matching of the audiologist assessments to the otolaryngologist review. This arose when more than one audiology assessment was conducted for a child (ear level, 84; child level, 43) or any doubts about the identity of the child for the audiology assessment or the otolaryngologist review (ear level, 8, child level, 4). For all analyses, we used bootstrap methods with 1000 replications to estimate standard errors, accounting for ears within children and children within families as appropriate. All analyses were conducted in Stata 14 (StataCorp).
Ethics approval
The Aboriginal Health and Medical Research Council of New South Wales (reference, 568/06) and the University of Sydney Human Research Ethics Committee (reference, 8506) provided ethics approval for this study.
Results
Participant characteristics
Of the 1669 children enrolled in SEARCH, 1310 (78.5%) received an ear health assessment leading to an audiologist diagnosis (Box 1). Our sample included 990 children (59.3%) with paired audiologist and otolaryngologist diagnoses available at the ear or child levels; 55.0% were boys, 49.4% were under 6 years of age (mean, 7.0 years; standard deviation [SD], 4.4 years). The sex distribution of children included in the analysis was similar to that of those not included, but their age distribution was different (mean, 7.7 years [SD, 4.3] v 6.0 years [SD, 4.4]) and they had a higher proportion of normal audiology findings (69.8% vs 58.1% of children) (Box 2). The distributions of audiology diagnoses for children with and without an otolaryngologist diagnosis were similar (online Appendix, table 2).
Otitis media findings: diagnostic agreement between audiologists and otolaryngologists
The diagnoses by otolaryngologists by ears (n = 1775) were 12 of OM with perforation (0.7%), 384 of OM without perforation (21.6%) and 1379 normal (77.7%); their diagnoses by child (n = 863) were 11 of OM with perforation (1.3%), 240 of OM without perforation (27.8%); and 612 normal (70.9%) (Box 3).
There was 92.2% agreement between all audiologists and all otolaryngologists at the ear level and 91.7% at the child level; the false negative rates were 3.0% (child level) and 3.7% (ear level), the false positive rates were 4.5% (child level) and 3.6% (ear level) (Box 3). For individual audiologist–otolaryngologist pairs, concordance ranged between 88.8% and 98.3% at the ear level, and between 85.5% and 98.2% at the child level (online Appendix, tables 3 and 4). Marginal homogeneity analysis indicated that otolaryngologists were less likely to diagnose OM with perforation than audiologists (1.3% v 2.2% at the child level, 0.7% v 1.3% at the ear level).
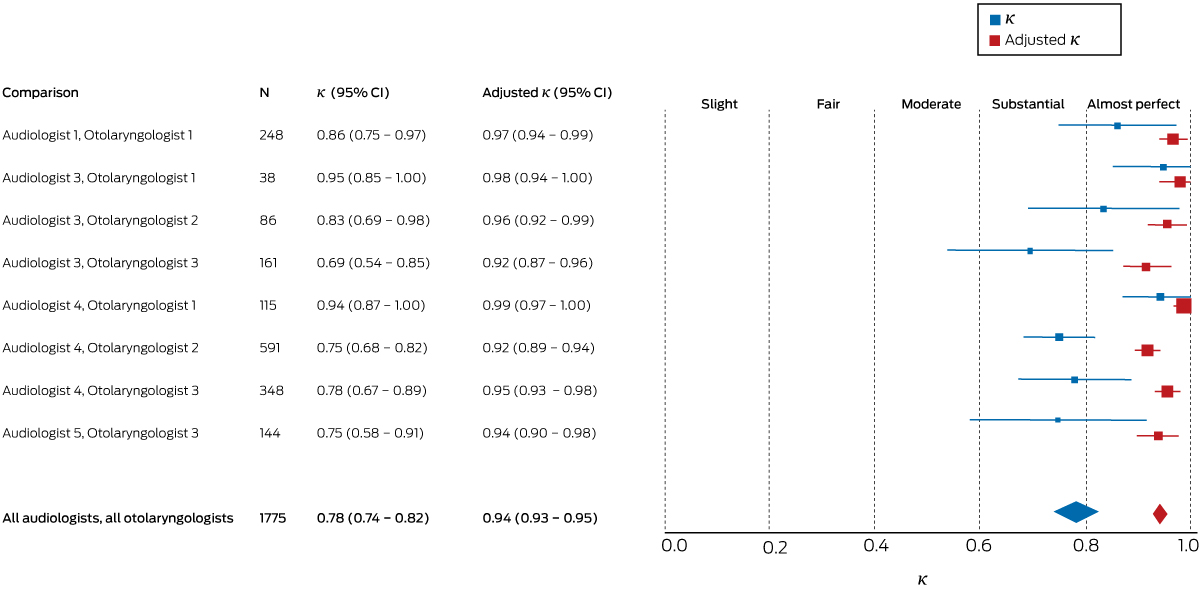
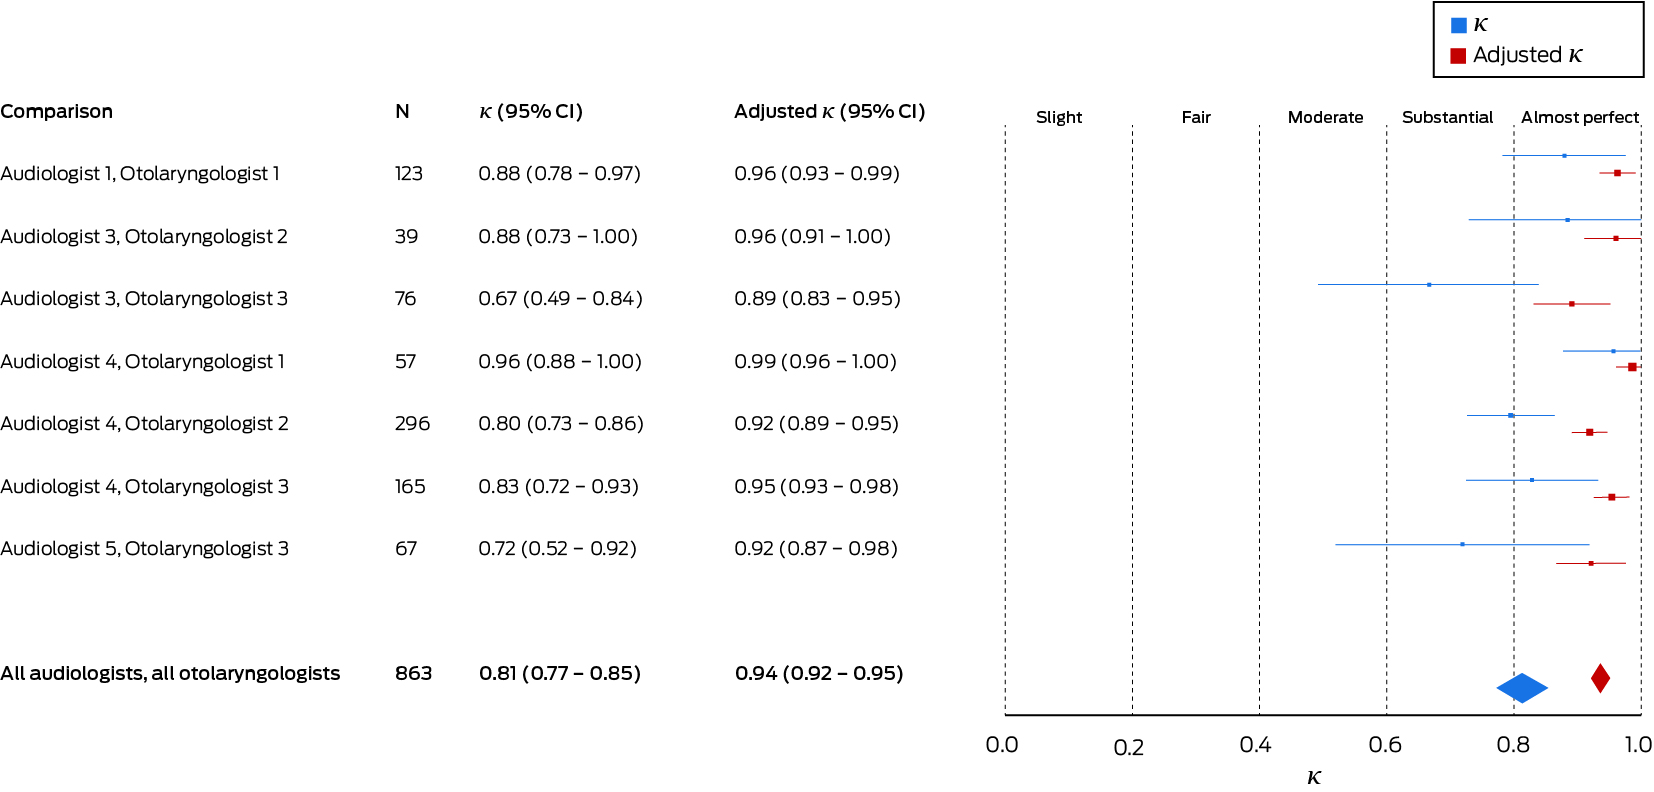
The overall agreement between all audiologists and all otolaryngologists was substantial at the ear level (κ = 0.78; 95% confidence interval [CI], 0.74–0.82; Box 4), and almost perfect (κ = 0.81; 95% CI, 0.77–0.85) at the child level (Box 5). There was no difference between agreement for right (κ = 0.79; 95% CI, 0.74–0.84) and left ears (κ = 0.78; 95% CI, 0.73–0.82). Agreement for individual audiologist–otolaryngologist pairs ranged from substantial to almost perfect at both the ear and child levels; κ values ranged from 0.69 (95% CI, 0.54–0.85) to 0.95 (95% CI, 0.85–1.00) at the ear level, and from 0.67 (95% CI, 0.49–0.84) to 0.96 (95% CI, 0.88–1.00) at the child level (online Appendix, tables 3 and 4).
The prevalence- and bias-adjusted κ values for all audiologists and all otolaryngologists were 0.94 (95% CI, 0.93–0.95) at the ear level and 0.94 (95% CI, 0.92–0.95) at the child level (Box 4, Box 5). Adjusted κ values for individual audiologist–otolaryngologist pairs are included in the online Appendix, tables 3 and 4. Agreement at the child level for audiologist–otolaryngologist pairs is included in the online Appendix, table 5.
Sensitivity and specificity
For comparisons of normal and abnormal diagnoses at the ear level for all audiologists and all otolaryngologists, sensitivity was 83.3% (95% CI, 78.9–87.8%), specificity 95.4% (95% CI, 94.1–96.6%), PPV 83.8% (95% CI, 79.5–88.0%), and NPV 95.2% (95% CI, 93.8–96.6%). For comparisons of normal and abnormal diagnoses at the child level, sensitivity was 89.6% (95% CI, 85.8–93.5%), specificity 93.6% (95% CI, 91.7–95.5%), PPV 85.2% (95% CI, 80.9 to 89.5%), and NPV 95.7% (95% CI, 94.0–97.3%) (online Appendix, table 6).
Learning effect
We found a lower level of crude agreement at the ear level for the first 100 audiology assessments by each audiologist compared with the crude agreement for subsequent assessments (first 100 [n = 422 ears]: κ = 0.66; 95% CI, 0.54–0.78; subsequent [n = 1353 ears]: κ = 0.81; 95% CI, 0.77–0.86; κ difference, 0.15 [95% CI, 0.03–0.28]; P = 0.016). However, after adjusting for prevalence and bias, there was no difference (first 100: adjusted κ = 0.92; 95% CI, 0.88–0.96; subsequent: adjusted κ = 0.95; 95% CI, 0.93–0.96; adjusted κ difference, 0.03 [95% CI, 0.02–0.07]; P = 0.23). Results were similar at the child level (not shown).
Sensitivity analysis
Excluding ears or children with any uncertainty about the matching of the audiologist’s assessment to the otolaryngologist’s review did not alter our findings: at the ear level, κ = 0.79 (95% CI, 0.75–0.83) and adjusted κ = 0.94 (95% CI, 0.93–0.96); at the child level, κ = 0.82 (95% CI, 0.77–0.86) and adjusted κ = 0.93 (95% CI, 0.91–0.96).
Discussion
For almost 1000 NSW Aboriginal children living in metropolitan and regional centres and with a high prevalence of OM (29%), we found substantial agreement between diagnoses by audiologists and otolaryngologists; agreement was almost complete after adjusting for prevalence and bias, and was consistent across audiologist–otolaryngologist pairings. Overall, OM would have been missed in only 3% of children were an audiologist triage strategy in place; no perforations would have been missed.
Although the prevalence of OM in this sample of urban Aboriginal children was higher than in other populations of children,19 we expect that our finding of diagnostic agreement between audiologists and otolaryngologists would apply in other settings of comparable diagnostic expertise. Differences in diagnostic expertise, seasonal fluctuations, and child characteristics may have affected prevalence estimates, but are unlikely to have substantially affected diagnostic agreement. As the distributions of audiologist diagnoses for children with and without an otolaryngologist diagnosis were similar, selection bias in the included assessments is unlikely. We used the otolaryngologist diagnosis as our reference standard, but, given the possibility that not everything the audiologist saw was clearly captured in the images and videos they received, audiologists may have been correct in the cases in which they diagnosed tympanic membrane perforation and the otolaryngologist did not. A minor degree of overdiagnosis of perforation would be clinically preferable to underdiagnosis.
This is the first published study to assess agreement between audiologists and otolaryngologists in the diagnosis of OM. A few studies have compared diagnoses of OM by other specialists, with sample sizes ranging from 23 to 171.6,20,21 With our larger sample size, we could perform analyses of agreement by individual clinician pairs, at both the ear and child levels, and adjust for OM prevalence and bias. Our agreement level (κ = 0.81) was comparable with the level found by a Finnish study20 that examined diagnoses for 58 children by one audiologist and ten doctors (for 242 tympanograms: κ = 0.77). We found higher levels of agreement than investigators who compared diagnoses by paediatric residents and otolaryngologists (κ = 0.38)21 or by primary health care practitioners and otologists κ = 0.68–0.74).22 Researchers who compared different diagnostic techniques applied by different health care professionals found much lower levels of agreement, including Roberts and colleagues23 (κ = 0.09–0.46) and Steinbach and his co-authors (κ = 0.32).21 Others have reported that agreement between audiologist and otolaryngologist diagnoses was validated, but without providing supporting data.24,25 The sensitivity we found was lower than in two earlier, smaller studies — one comparing diagnoses by an audiologist and a nurse practitioner (171 children)26 and another comparing acoustic admittance by audiologists with tympanometry (50 children)27 — but our calculated specificity (95.4% at the ear level, 93.6% at the child level) was higher than reported for those studies.
Limitations
We analysed agreement at both the ear and child levels because referrals are based on the child level diagnosis, and an error in transcribing which ear had middle ear disease may affect ear-level, but not child-level, diagnoses. On the basis of our findings, and assuming 29% prevalence of OM, about 925 of 1000 children screened by an audiologist would be correctly triaged, 45 would receive a false positive diagnosis, and 30 would have OM but be incorrectly diagnosed as normal (false negative); no perforations, however, would be missed. We found lower diagnostic agreement for the initial 100 assessments by individual audiologists than for subsequent assessments (crude but not adjusted κ). Although we found high levels of diagnostic agreement, it may have been higher had we provided detailed clinical information to the otolaryngologist, as would happen were this work translated into clinical practice. It was beyond the scope of our study for the otolaryngologist to independently examine all children personally, but had they done so they may have identified perforations they missed in the supplied material. It is also possible that an audiologist and otolaryngologist both made incorrect diagnoses, but, given the clinical experience of the participants, this should have been rare. The degree of diagnostic agreement we found may not have been seen with less experienced assessors.
A key unanswered problem is how to appropriately weight the results of individual tests used for diagnosing OM. SEARCH will investigate this question by providing limited information (eg, tympanometry results) to otolaryngologists before they make their diagnoses, then serially providing further information to determine whether they change their diagnoses.
Conclusion
When access to otolaryngologists is limited, review by an audiologist in the primary health care setting may facilitate the identification of OM and subsequent referral to an otolaryngologist. Our findings could inform investigation of the value of tele-otology and tele-health in regions with limited access to otolaryngologists.
Box 2 – Baseline characteristics of the children in the Study of Environment on Aboriginal Resilience and Child Health, by inclusion or non-inclusion in the otitis media diagnosis study analysis
|
|
Participants in the otitis media analysis |
Non-participants in the otitis media analysis |
Total |
P |
|||||||||||
|
|
|||||||||||||||
|
Number of children |
990 |
679 |
1669 |
|
|||||||||||
|
Aboriginal Community Controlled Health Service |
< 0.001* |
||||||||||||||
|
Service 1 |
286 (28.9%) |
143 (21.1%) |
429 (25.7%) |
|
|||||||||||
|
Service 2 |
226 (22.8%) |
216 (31.8%) |
442 (26.5%) |
|
|||||||||||
|
Service 3 |
238 (24.0%) |
164 (24.2%) |
402 (24.1%) |
|
|||||||||||
|
Service 4 |
240 (24.2%) |
156 (23.0%) |
396 (23.7%) |
|
|||||||||||
|
Sex |
|
|
|
0.06* |
|||||||||||
|
Boys |
546 (55.2%) |
343 (50.5%) |
889 (53.3%) |
|
|||||||||||
|
Girls |
444 (44.8%) |
336 (49.5%) |
780 (46.7%) |
|
|||||||||||
|
Age (years) |
|
|
|
< 0.001† |
|||||||||||
|
Under 4 |
225 (22.7%) |
279 (41.1%) |
504 (30.2%) |
|
|||||||||||
|
4–6 |
264 (26.7%) |
160 (23.6%) |
424 (25.4%) |
|
|||||||||||
|
7–12 |
363 (36.7%) |
174 (25.6%) |
537 (32.2%) |
|
|||||||||||
|
13 or older |
138 (13.9%) |
66 (9.7%) |
204 (12.2%) |
|
|||||||||||
|
Assessment season |
|
|
|
< 0.001* |
|||||||||||
|
Summer |
83 (8.4%) |
138 (20.3%) |
221 (13.2%) |
|
|||||||||||
|
Autumn |
248 (25.1%) |
160 (23.6%) |
408 (24.4%) |
|
|||||||||||
|
Winter |
376 (38.0%) |
198 (29.2%) |
574 (34.4%) |
|
|||||||||||
|
Spring |
283 (28.6%) |
183 (27.0%) |
466 (27.9%) |
|
|||||||||||
|
Diagnosis by audiologist (child level)‡ |
< 0.001† |
||||||||||||||
|
Otitis media with perforation |
19/926 (2.1%) |
6/298 (2.0%) |
25/1224 (2.0%) |
|
|||||||||||
|
Otitis media without perforation |
261/926 (28.2%) |
119/298 (39.9%) |
380/1224 (31.0%) |
|
|||||||||||
|
Normal in both ears |
646/926 (69.8%) |
173/298 (58.1%) |
819/1224 (66.9%) |
|
|||||||||||
|
Diagnosis by audiologist (ear level) |
< 0.001† |
||||||||||||||
|
Otitis media with perforation |
23/1775 (1.3%) |
10/702 (1.4%) |
33/2477 (1.3%) |
|
|||||||||||
|
Otitis media without perforation |
371/1775 (20.9%) |
223/702 (31.8%) |
594/2477 (24.0%) |
|
|||||||||||
|
Normal |
1381/1775 (77.8%) |
469/702 (66.8%) |
1850/2477 (74.7%) |
|
|||||||||||
|
|
|||||||||||||||
|
* χ2 test. † Wilcoxon rank sum test. ‡ Diagnosis of highest order in either ear (ie, normal means both ears had no middle ear pathology). |
|||||||||||||||
Box 3 – Diagnostic agreement between all audiologists and all otolaryngologists, at ear and child levels
|
Audiologist diagnosis |
Otolaryngologist diagnosis |
||||||||||||||
|
Otitis media with perforation |
Otitis media without perforation |
Normal |
Total |
||||||||||||
|
|
|||||||||||||||
|
Ear level |
|
|
|
|
|||||||||||
|
Otitis media with perforation |
12 |
9 |
2 |
23 (1.3%) |
|||||||||||
|
Otitis media without perforation |
0 |
309 |
62 |
371 (20.9%) |
|||||||||||
|
Normal |
0 |
66 |
1315 |
1381 (77.8%) |
|||||||||||
|
Total |
12 (0.7%) |
384 (21.6%) |
1379 (77.7%) |
1775 (100%) |
|||||||||||
|
Agreement |
|
|
|
|
|||||||||||
|
Marginal homogeneity (Stuart–Maxwell test) |
|
|
P = 0.004 |
||||||||||||
|
Overall agreement |
|
|
|
92.2% |
|||||||||||
|
κ (95% CI)† |
|
|
|
0.78 (0.74–0.82) |
|||||||||||
|
Prevalence-, bias-adjusted κ (95% CI) |
|
|
|
0.94 (0.93–0.95) |
|||||||||||
|
Child level* |
|
|
|
|
|||||||||||
|
Otitis media with perforation |
11 |
7 |
1 |
19 (2.2%) |
|||||||||||
|
Otitis media without perforation |
0 |
207 |
38 |
245 (28.4%) |
|||||||||||
|
Normal in both ears |
0 |
26 |
573 |
599 (69.4%) |
|||||||||||
|
Total |
11 (1.3%) |
240 (27.8%) |
612 (70.9%) |
863 (100%) |
|||||||||||
|
Agreement |
|
|
|
|
|||||||||||
|
Marginal homogeneity (Stuart–Maxwell test) |
|
|
P = 0.008 |
||||||||||||
|
Overall agreement |
|
|
|
91.7% |
|||||||||||
|
κ (95% CI)† |
|
|
|
0.81 (0.77–0.85) |
|||||||||||
|
Prevalence-, bias-adjusted κ (95% CI) |
|
|
|
0.94 (0.92–0.95) |
|||||||||||
|
|
|||||||||||||||
|
CI = confidence interval. * Highest order diagnosis in either ear; ie, “normal” means neither ear had middle ear pathology. † Linearly weighted κ, with bootstrap methods used to estimate standard errors, taking into account ears within children and children within families as appropriate. |
|||||||||||||||
Received 9 March 2018, accepted 10 May 2018
- Hasantha Gunasekera1,2
- Hilary M Miller3
- Leonie Burgess4
- Shingisai Chando3
- Simone L Sheriff4
- Julie D Tsembis4
- Kelvin M Kong5
- Harvey LC Coates6
- John Curotta2
- Kathleen Falster7,8
- Peter B McIntyre9
- Emily Banks8
- Natasha J Peter10
- Jonathan C Craig11
- 1 University of Sydney, Sydney, NSW
- 2 Children's Hospital at Westmead, Sydney, NSW
- 3 Sydney School of Public Health, University of Sydney, NSW
- 4 Sax Institute, Sydney, NSW
- 5 Newcastle Private Hospital medical suites, Newcastle, NSW
- 6 University of Western Australia, Perth, WA
- 7 Centre for Big Data in Health, University of New South Wales, Sydney, NSW
- 8 National Centre for Epidemiology and Population Health, Australian National University, Canberra, ACT
- 9 National Centre for Immunisation Research and Surveillance, Sydney Children's Hospital Network, Sydney, NSW
- 10 Tharawal Aboriginal Medical Service, Sydney, NSW
- 11 Flinders University, Adelaide, SA
SEARCH was funded by Australian National Health and Medical Research Council (NHMRC) grants (358457, 512685, 1023998, 1035378), the NSW Ministry of Health, the Australian Primary Care Research Institute, beyondblue, and the Rio Tinto Aboriginal Fund. Kathleen Falster was supported by an NHMRC Early Career Fellowship (1016475) and an NHMRC Capacity Building Grant (573122). Emily Banks was supported by an NHMRC Senior Research Fellowship (1042717). We thank the participating families and SEARCH study research officers for collecting the data.
No relevant disclosures.
- 1. Rovers MM, Schilder AGM, Zielhuis GA, Rosenfeld RM. Otitis media. Lancet 2004; 363: 465-473.
- 2. Yiengprugsawan V, Hogan A, Strazdins L. Longitudinal analysis of ear infection and hearing impairment: findings from 6-year prospective cohorts of Australian children. BMC Pediatr 2013; 13: 28.
- 3. Gunasekera H, Knox S, Morris P, et al. The spectrum and management of otitis media in Australian Indigenous and Nonindigenous children: a national study. Pediatr Infect Dis J 2007; 26: 689-692.
- 4. Gunasekera H, Morris PS, Daniels J, et al. Otitis media in Aboriginal children: the discordance between burden of illness and access to services in rural/remote and urban Australia. J Paediatr Child Health 2009; 45: 425-430.
- 5. Blomgren K, Pitkäranta A. Is it possible to diagnose acute otitis media accurately in primary health care? Fam Pract 2003; 20: 524-527.
- 6. Blomgren K, Pohjavuori S, Poussa T, et al. Effect of accurate diagnostic criteria on incidence of acute otitis media in otitis-prone children. Scand J Infect Dis 2004; 36: 6-9.
- 7. Garbutt J, Jeffe DB, Shackelford P. Diagnosis and treatment of acute otitis media: an assessment. Pediatrics 2003; 112: 143-149.
- 8. World Health Organization. Millions of people in the world have hearing loss that can be treated or prevented. Geneva: World Health Organization, 2013. http://www.who.int/pbd/deafness/news/Millionslivewithhearingloss.pdf (viewed May 2018).
- 9. Lieberthal AS, Carroll AE, Chonmaitree T, et al. The diagnosis and management of acute otitis media. Pediatrics 2013; 131: e964-e999.
- 10. The SEARCH Investigators. The Study of Environment on Aboriginal Resilience and Child Health (SEARCH): study protocol. BMC Public Health 2010; 10: 287.
- 11. Cohen JF, Korevaar DA, Altman DG, et al. STARD 2015 guidelines for reporting diagnostic accuracy studies: explanation and elaboration. BMJ Open 2016; 6: e012799.
- 12. Swanepoel de W, Hall JW. A systematic review of telehealth applications in audiology. Telemed J 2010; 16: 181-200.
- 13. Lundberg T, Westman G, Hellstrom S, Sandstrom H. Digital imaging and telemedicine as a tool for studying inflammatory conditions in the middle ear — evaluation of image quality and agreement between examiners. Int J Pediatr Otorhinolaryngol 2008; 72: 73-79.
- 14. Eikelboom RH, Mbao MN, Coates HL, et al. Validation of tele-otology to diagnose ear disease in children. Int J Pediatr Otorhinolaryngol 2005; 69: 739-744.
- 15. Smith AC, Perry C, Agnew J, Wootton R. Accuracy of pre-recorded video images for the assessment of rural Indigenous children with ear, nose and throat conditions. J Telemed Telecare 2006; 12 (Suppl 3): 76-80.
- 16. Sim J, Wright CC. The kappa statistic in reliability studies: use, interpretation, and sample size requirements. Phys Ther 2005; 85: 257-268.
- 17. Byrt T, Bishop J, Carlin JB. Bias, prevalence and kappa. J Clin Epidemiol 1993; 46: 423-429.
- 18. Landis JR, Koch GG. The measurement of observer agreement for categorical data. Biometrics 1977; 33: 159-174.
- 19. Homøe P, Kværner K, Casey JR, et al. Research conference report from the 18th International Conference on Recent Advances in Otitis Media. Panel 1: Epidemiology and diagnosis. Otolaryngol Head Neck Surg 2017; 156 (4 Suppl): S1-S21.
- 20. Palmu A, Rahko T, Puhakka H, Takala AK. Interrater agreement on tympanometry in infants. Scand Audiol 2000; 29: 260-265.
- 21. Steinbach WJ, Sectish TC, Benjamin DK, et al. Pediatric residents’ clinical diagnostic accuracy of otitis media. Pediatrics 2002; 109: 993-998.
- 22. Biagio L, Swanepoel De W, Laurent C, Lundberg T. Video-otoscopy recordings for diagnosis of childhood ear disease using telehealth at primary health care level. J Telemed Telecare 2014; 20: 300-306.
- 23. Roberts DG, Johnson CE, Carlin SA, et al. Resolution of middle ear effusion in newborns. Arch Pediatr Adolesc Med 1995; 149: 873-877.
- 24. Boswell JB, Nienhuys TG. Patterns of persistent otitis media in the first year of life in Aboriginal and non-Aboriginal infants. Ann Otol Rhinol Laryngol 1996; 105: 893-900.
- 25. Boswell J. Presentation of early otitis media in “Top End” Aboriginal infants. Aust N Z J Public Health 1997; 21: 100-102.
- 26. Nozza RJ, Bluestone CD, Kardatzke D, Bachman R. Identification of middle ear effusion by aural acoustic admittance and otoscopy. Ear Hear 1994; 15: 310-323.
- 27. Fields MJ, Allison RS, Corwin P, et al. Microtympanometry, microscopy and tympanometry in evaluating middle ear effusion prior to myringotomy. N Z Med J 1993; 106: 386-387.
Abstract
Objectives: To determine the degree of agreement of diagnoses by audiologists and otolaryngologists of otitis media (OM) in Aboriginal children.
Design: Cross-sectional study of agreement between diagnoses.
Setting: Study of Environment on Aboriginal Resilience and Child Health (SEARCH), a prospective cohort study of Aboriginal children attending four Aboriginal Community Controlled Health Services in New South Wales (three metropolitan, one regional) during 2008–2012.
Participants: 1310 of 1669 SEARCH participants (78.5%; mean age, 7.0 years; SD, 4.4 years) were assessed and received a diagnosis from one of five experienced audiologists. Test results (but not case histories) were forwarded to one of three otolaryngologists for blinded independent assessment.
Main outcome measures: Agreement of OM diagnoses by audiologists and otolaryngologists at ear and child levels; correctness of audiologist diagnoses (otolaryngologist diagnosis as reference).
Results: Paired diagnoses by audiologists and otolaryngologists were available for 863 children at the child level and 1775 ears (989 children) at the ear level. Otolaryngologists diagnosed OM in 251 children (29.1%), including 11 (1.3%) with tympanic membrane perforation, and in 396 ears (22.3%), including 12 (0.7%) with perforation. Agreement between audiologists and otolaryngologists for OM at the ear level was 92.2% (κ = 0.78; 95% CI, 0.74–0.82), and at the child level 91.7% (κ = 0.81; 95% CI, 0.77–0.85). No otolaryngologist-diagnosed perforation was missed by audiologists. Among 1000 children triaged by an audiologist, there would be 45 false positives and 30 false negatives when compared with assessments by an otolaryngologist, with no missed perforations.
Conclusions: There was substantial agreement between audiologists’ and otolaryngologists’ diagnoses of OM in a high prevalence population of Aboriginal children. In settings with limited access to otolaryngologists, audiologists may appropriately triage children and select those requiring specialist review.