


The known Obesity in women is increasing globally, and during their reproductive years is associated with adverse maternal and neonatal outcomes.
The new We have documented the rise in prevalence of overweight and obesity among pregnant nulliparous women in Australia over a 25-year period. The rise was associated with increasing rates of adverse maternal and neonatal outcomes, particularly gestational diabetes, fetal macrosomia, and pre-eclampsia.
The implications The clinical and public health implications of rising rates of obesity among first-time mothers are substantial. Efforts should be focused on developing a long term national approach that ensures the health of future generations.
An analysis of 1698 studies including 19.2 million people in 200 countries concluded that more people are now overweight or obese than underweight.1 In countries such as the United States, the United Kingdom and Australia, as many as 50% of women of reproductive age are overweight or obese.2 Such women have an increased risk of adverse pregnancy outcomes (including caesarean delivery, gestational diabetes, and pre-eclampsia) and of later cardiovascular disease.3,4 Their offspring have higher rates of neonatal complications and childhood obesity, and an increased risk of metabolic disease in adult life.5,6
A useful statistic when exploring the impact of obesity on adverse perinatal outcomes at the population level is the population attributable fraction (PAF), the proportional reduction in population disease that could be achieved were exposure to a specific risk factor reduced to a more desirable level. While “relative risk” expresses the strength of association between an exposure and a disease, the PAF provides a proportional measure of risk in a population, accounting for both the prevalence of the risk factor in the population and the strength of its association with an outcome.7 PAF is best calculated within a single study to assure internal consistency of definitions of exposure, outcome, and population.7 A limited number of international studies have applied this approach to quantifying the proportion of adverse perinatal outcomes that could be prevented were maternal obesity reduced or eliminated,8,9 but none have examined this question in Australia.
In this study of a large retrospective cohort, we examined the 25-year trend in the proportions of women entering their first pregnancy who were overweight or obese according to their body mass index (BMI), and estimated the proportions of adverse perinatal outcomes that could be averted by reducing the prevalence of overweight and obesity in women prior to their first pregnancies.
Methods
The study population was selected from the electronic data records of all births at the Royal Prince Alfred Hospital (Sydney Local Health District) between 1990 and 2014. The health district is characterised by socio-economic diversity; almost half the population speak languages other than English at home. About 9% of births in New South Wales are to women in the Sydney Local Health District, the majority of which are managed at the Royal Prince Alfred. During 1989–2004, the routine antenatal and neonatal data captured throughout pregnancy were entered by midwives into the Obstetric Information System; from 2005, the hospital changed to the Cerner Maternity system, which was updated in 2009. The Obstetric Information System and the two Cerner systems are electronic medical record platforms, used by all care providers to record encounters with the mother and her baby throughout pregnancy and during the birth and postnatal periods, and include consistent information despite slightly different interfaces. Our study incorporated data from all three databases; maternal records were linked to neonatal records and de-identified, and data from the three databases merged.
Women who gave birth at the hospital (gestation of at least 20 weeks or birthweight of at least 400 g) between 1 January 1990 and 31 December 2014 were included in our analysis. Pregnant women planning to give birth at the Royal Prince Alfred make a booking visit at about 14 weeks’ gestation, at which data on their general health (including weight, height, and history of diabetes or hypertension) and obstetric history (parity, caesarean deliveries, premature births) are recorded. The temporal distribution of booking visits is not known in detail, but 84% of booking visits in NSW are made by 20 weeks’ gestation.10 The mother’s record is updated throughout her pregnancy and until she is discharged from hospital after the birth.
Gestation was calculated at the booking visit from the most recent normal menstrual period or from an early dating scan. Women excluded because of missing data were compared with those included in the analysis to determine whether the two groups differed on any parameter.
Maternal variables extracted for our analysis included height and weight (at the first antenatal consultation), country of birth, postcode, marital status, smoking status, parity, and medical and pregnancy history. BMI was calculated and categorised according to World Health Organization guidelines.11 Socio-economic status was determined by residential postcode, according to the Index of Relative Socio-economic Advantage and Disadvantage (IRSAD). As the socio-economic status of some postcodes changed during the 25-year study period, we applied the rating at the time of birth. Deciles of socio-economic status for each postcode were obtained from the Australian Bureau of Statistics (ABS) Census of Population and Housing: Socio-Economic Indexes for Areas (SEIFA) for the years 1991, 1996, 2001, 2006 and 2011.12 Countries of birth were grouped into regions according to the 2011 ABS Standard Australian Classification of Countries.13 Asian countries included north-eastern, southern and central, and south-eastern Asia; Oceania included Australia, New Zealand, and the Pacific Island nations.
Maternal and birth outcomes included pre-eclampsia and gestational diabetes mellitus (GDM). GDM was classified according to the Gestational Diabetes Mellitus Management guidelines of the Australasian Diabetes in Pregnancy Society.14 The criteria for diagnosing GDM were revised in 2014, but this is not reflected in our data. Pre-eclampsia was classified according to the guidelines of the Society of Obstetric Medicine of Australia and New Zealand.15 Other outcome variables included mode of birth (vaginal birth or caesarean delivery) and post partum haemorrhage (greater than 500 mL).
Neonatal outcomes included birth outcome (alive or stillborn), gestation at birth, neonatal birthweight, neonatal sex, congenital abnormality recorded, and admission to the special care nursery. Stillbirth was classified according to the Perinatal Society of Australia and New Zealand guidelines.16 As reason for admission to the special care nursery was not routinely recorded throughout the study period, this factor was not analysed. Premature births are defined by the WHO as any birth before 37 completed weeks of gestation.17 Neonatal birthweight could be classified as large (LGA; above the 90th percentile) or small for gestational age and sex (SGA; below the 10th percentile), based on curves published by Intergrowth,18 or as macrosomia (birthweight over 4500 g).
The prevalence of outcomes by BMI category and 5-year period were examined with the Mantel–Haenszel method. We expressed the association between BMI category and outcome as prevalence ratios, derived from Poisson regression models with robust standard errors and adjusting for maternal age, country of birth, socio-economic disadvantage, smoking status, and year of birth. Within these models we tested for interactions between BMI class and each of the other factors. A relative risk was deemed statistically significant if the 95% confidence interval did not include 1.0.
The proportions of adverse perinatal outcomes attributable to either overweight or obesity for each outcome were calculated with the formula:19

where pd is the proportion of patients exposed to the risk factor, calculated for each 5-year period, and RR is the relative risk (compared with women in the normal BMI class). To estimate the burden of disease that could be prevented were all overweight and obese women of normal BMI, the combined PAFs attributable to overweight (PAF1) and obesity (PAF2) were estimated for each 5-year period, using adjusted relative risks (aRRs), with the formula:20

Adopting a pragmatic approach, we also estimated the potential benefit of a downwards shift of one BMI category by overweight and obese women before becoming pregnant (ie, women moved from an obese category to the overweight category, or from overweight to normal).
Ethics approval
Institutional ethics approval for analysing of archived electronic health data was granted by the Local Health District Ethics Review Committee (no reference number); identifying information was removed from all individual records before analysis.
Results
A total of 112 163 singleton births were recorded during 1980–2014, and we calculated the early pregnancy BMI for 42 582 nulliparous women with singleton births (Box 1). The characteristics of women excluded because of missing data (mostly height or weight data; online Appendix, tables 1 and 2) were similar to those of the included women (Box 2) in terms of age, country of birth, and smoking status. Women with missing data were more likely to have a higher socio-economic status postcode than those with complete data.
During the study period, the mean age of first-time mothers rose from 28.7 (standard deviation [SD], 5.4) to 31.6 years (SD, 4.9 years). The proportion of Asian-born women increased from 17.0% to 24.3%. The socio-economic status of postcodes in the hospital catchment area shifted markedly during the study period; the proportion of mothers in the highest quintile rose from 7.1% in 1990–1994 to 40.8% in 2010–2014 (Box 2).
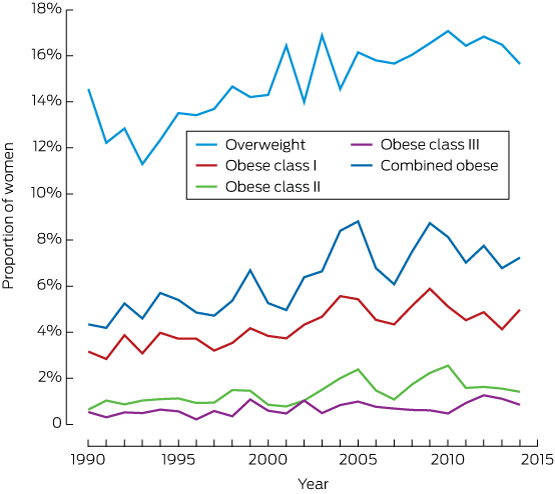
The prevalence of overweight among nulliparous women increased from 12.7% in 1993 to 16.4% in 2010–2014; that of obesity rose from 4.8% to 7.3% (Box 2, Box 3).
After adjusting for maternal age, smoking status, socio-economic status of postcode, country of birth, and year of baby’s birth, and using the healthy BMI group as the reference group, multivariate analysis identified that the relative risks of caesarean delivery, GDM, LGA, macrosomia, pre-eclampsia, and post partum haemorrhage were higher for women in overweight or obese BMI classes; further, the relative risks increased across the study period. The relative risks for stillbirth and fetal abnormality were also higher for women with obesity (all obese BMI classes combined) (Box 4). For non-smokers (Box 4), but not smokers (online Appendix, table 3), the risks of prematurity and admission to the special care nursery increased with BMI. There was an inverse relationship between BMI and the relative risk of SGA (Box 4).
During 2010–2014, the burden attributable to overweight and obesity was greatest for pre-eclampsia (23.8%), macrosomia (23.4%), and GDM (17.0%). PAFs increased during the study period for all perinatal outcomes, with the exception of congenital abnormality (Box 5). Were overweight and obese women to move down one BMI category, 19.0% of pre-eclampsia, 15.9% of macrosomia, 14.2% of GDM, 8.5% of caesarean deliveries, 7.1% of LGA, 7.1% of stillbirths, 6.8% of post partum haemorrhage, 6.5% of admissions to the special care nursery, 5.8% of prematurity, and 3.8% of fetal abnormality could have been averted (Box 6).
Discussion
In our cohort study of 42 582 singleton births to nulliparous women at the Royal Prince Alfred in Sydney, we found that maternal BMI increased across the study period (1990–2014); we also found an association between overweight and obesity and a range of adverse perinatal outcomes. PAF analysis indicated that overweight and obesity contributed to an increasing proportion of almost all adverse outcomes, particularly pre-eclampsia, macrosomia and GDM. Further, we found that if women could move down one BMI class prior to pregnancy, substantial adverse outcomes would be averted.
Pre-eclampsia contributes significantly to perinatal morbidity and mortality. For almost one in four women with pre-eclampsia, the condition was attributable to overweight or obesity, similar to findings in the UK and Canada (reported PAF, 20%).8,9
Obesity contributes substantially to excessive fetal growth, thereby increasing perinatal risks of birth trauma, post partum haemorrhage, and shoulder dystocia,21 as well as having longer term consequences for the child, including childhood obesity and increased risk of later cardiovascular risk.5,21 We found that 23.4% of macrosomia during 2010–2014 was attributable to maternal overweight and obesity, substantially higher than the PAF of 7.4% reported by an earlier study.8 The difference might be explained by differences in study design; for example, the earlier study did not correct for smoking status, included multiparous women, and applied a different definition of macrosomia.
The PAF for GDM attributable to women being overweight or obese during 2010–2014 was 17%. We did not employ the adjusted BMI thresholds published by the WHO22 that recognise the greater risk of obesity-related complications in Asian women at lower BMI thresholds. As our study population included many Asian women, our PAF may therefore be an underestimate. A study in the UK8 found large differences between ethnic groups in the PAF for obesity and GDM; the overall figure was 29%, but it was highest for black (41%) and lowest for Asian women (8.4%). Differences in the PAF for GDM between our study and the UK findings may be related to differences in demographic characteristics of the study populations, or to the British study including multiparous women.
The strengths of our study include the sample being derived from a single source; as the exposure and outcomes variables were similarly defined over time, internal consistency was ensured. Collecting data over many years and having a large sample size allowed us to calculate precise proportions for key outcome variables, adjusted for many relevant confounders. Our PAF formula produced internally valid estimates by using adjusted relative risks.19 We analysed data only for nulliparous women because it was important to exclude other contributors to maternal obesity. In particular, we thereby ensured that our results were not confounded by gestational weight gain from previous pregnancies, and that outcomes were not affected by previous births.
Our findings, however, may only be generalisable to hospitals providing intensive nursery care or high level obstetric care. Diagnostic misclassification was possible, but as the rate was presumably similar for all groups, it is unlikely to have had a major impact on our results. As many as one in five nulliparous women in our study did not have a recorded BMI, similar to the one in seven statistic of similar studies in the UK and Canada.8,9 The practice of routinely weighing pregnant women has fluctuated over the past 25 years because of lags in translating evidence into practice and fears of stigmatising women.23,24 The 2012 Australian Clinical Practice Guidelines for Antenatal Care25 recommend measuring weight and height at the first antenatal visit, but no Australian platform collates all routinely collected maternity data.
It is increasingly recognised that by the antenatal period it may be too late to reduce the risks of maternal obesity. Two large randomised controlled trials that attempted to modify adverse outcomes (LGA in the LIMIT trial; GDM and LGA in the UPBEAT trial) with diet, lifestyle and behavioural approaches during pregnancy in women with obesity failed to reduce their rates.26,27 Expert national and international consensus statements support improving pre-conception health and detailed prevention strategies.28-30 They recommend reducing obesity as a means for improving reproductive health outcomes, potentially also reducing societal costs. The National Health Summit on Obesity called for federal support for life course strategies that incorporate pre-conception care.30
Conclusion
We found that a substantial proportion of the burden of adverse perinatal outcomes for Australian women is linked to maternal overweight and obesity, and that this proportion has steadily increased over the past 25 years. Importantly for practice and policy, our results indicate that the frequency of adverse perinatal outcomes could be reduced by shifting the distribution of overweight and obesity among first-time mothers by a single BMI class. Investing in obesity prevention strategies that target women prior to their becoming pregnant is likely to provide the greatest benefit.
Box 1 – Overview of selection of pregnant, nulliparous women giving birth at Royal Prince Alfred Hospital, Sydney, 1990–2014
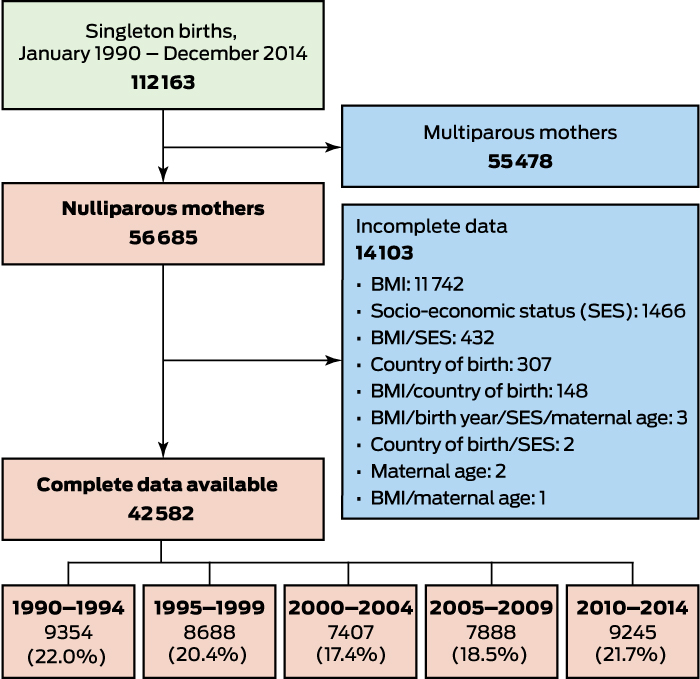
BMI = body mass index.
Box 2 – Demographic characteristics of pregnant, nulliparous women with singleton births, 1990–2014, by 5-year period
|
|
1990–1994 |
1995–1999 |
2000–2004 |
2005–2009 |
2010–2014 |
Total |
|||||||||
|
|
|||||||||||||||
|
Number of women |
9354 |
8688 |
7407 |
7888 |
9245 |
42 582 |
|||||||||
|
Age (years), mean (SD) |
28.7 (5.35) |
29.5 (5.41) |
30.5 (5.29) |
31.3 (5.01) |
31.6 (4.89) |
30.3 (5.31) |
|||||||||
|
Maternal age (years), 5-year bands |
|
|
|
|
|
|
|||||||||
|
< 20 |
375 (4.0%) |
265 (3.1%) |
144 (1.9%) |
119 (1.5%) |
98 (1.1%) |
1001 (2.4%) |
|||||||||
|
20–24 |
1746 (18.7%) |
1385 (15.9%) |
880 (11.9%) |
635 (8.1%) |
569 (6.2%) |
5215 (12.3%) |
|||||||||
|
25–29 |
3158 (33.8%) |
2631 (30.3%) |
1943 (26.2%) |
1977 (25.1%) |
2279 (24.7%) |
11 988 (28.2%) |
|||||||||
|
30–34 |
2747 (29.4%) |
2730 (31.4%) |
2741 (37.0%) |
3073 (39.0%) |
3769 (40.8%) |
15 060 (35.4%) |
|||||||||
|
35–39 |
1089 (11.6%) |
1421 (16.4%) |
1383 (18.7%) |
1726 (21.9%) |
2024 (21.9%) |
7643 (18.0%) |
|||||||||
|
> 40 |
239 (2.6%) |
256 (3.0%) |
316 (4.3%) |
358 (4.5%) |
506 (5.5%) |
1675 (3.9%) |
|||||||||
|
Maternal body mass index (kg/m2) |
|
|
|
|
|
|
|||||||||
|
Underweight (< 18.5) |
850 (9.1%) |
912 (10.5%) |
719 (9.7%) |
622 (7.9%) |
745 (8.1%) |
3848 (9.0%) |
|||||||||
|
Normal weight (18.5–24.99) |
6871 (73.5%) |
6103 (70.3%) |
5085 (68.7%) |
5420 (68.7%) |
6308 (68.2%) |
29 787 (70.0%) |
|||||||||
|
Overweight (25.0–29.99) |
1184 (12.7%) |
1207 (13.9%) |
1130 (15.3%) |
1261 (16.0%) |
1518 (16.4%) |
6300 (14.8%) |
|||||||||
|
Obese class I (30.0–34.99) |
316 (3.4%) |
317 (3.7%) |
330 (4.5%) |
392 (5.0%) |
432 (4.7%) |
1787 (4.2%) |
|||||||||
|
Obese class II (35.0–39.99) |
87 (0.9%) |
102 (1.2%) |
93 (1.3%) |
135 (1.7%) |
151 (1.6%) |
568 (1.3%) |
|||||||||
|
Obese class III (= 40.0) |
46 (0.5%) |
47 (0.5%) |
50 (0.7%) |
58 (0.7%) |
91 (1.0%) |
292 (0.7%) |
|||||||||
|
Country of birth |
|
|
|
|
|
|
|||||||||
|
Oceania |
5752 (61.5%) |
4859 (55.9%) |
4385 (59.2%) |
4543 (57.6%) |
4678 (50.6%) |
24 217 (56.9%) |
|||||||||
|
Europe |
1198 (12.8%) |
952 (11.0%) |
786 (10.6%) |
838 (10.6%) |
1023 (11.1%) |
4797 (11.3%) |
|||||||||
|
North Africa, sub-Saharan Africa, Middle East |
461 (4.9%) |
373 (4.3%) |
262 (3.5%) |
214 (2.7%) |
236 (2.6%) |
1546 (3.6%) |
|||||||||
|
Asia (south-east, north-east, central and southern) |
1591 (17.0%) |
2031 (23.4%) |
1600 (21.6%) |
1653 (21.%) |
2243 (24.3%) |
9118 (21.4%) |
|||||||||
|
Americas |
170 (1.8%) |
218 (2.5%) |
171 (2.3%) |
211 (2.7%) |
280 (3.0%) |
1050 (2.5%) |
|||||||||
|
SEIFA quintile |
|
|
|
|
|
|
|||||||||
|
1 (lowest) |
4039 (43.2%) |
1987 (22.9%) |
1204 (16.3%) |
754 (9.6%) |
593 (6.4%) |
8577 (20.1%) |
|||||||||
|
2 |
1181 (12.6%) |
840 (9.7%) |
1094 (14.8%) |
872 (11.1%) |
1447 (15.7%) |
5434 (12.8%) |
|||||||||
|
3 |
2189 (23.4%) |
2142 (24.7%) |
1406 (19.0%) |
1946 (24.7%) |
1739 (18.8%) |
9422 (22.1%) |
|||||||||
|
4 |
1282 (13.7%) |
2642 (30.4%) |
2196 (29.7%) |
1101 (14.0%) |
1691 (18.3%) |
8912 (20.9%) |
|||||||||
|
5 (highest) |
633 (7.1%) |
1077 (12.4%) |
1507 (20.4%) |
3215 (40.8%) |
3775 (40.8%) |
10237 (24.0%) |
|||||||||
|
Smoking status at booking |
|
|
|
|
|
|
|||||||||
|
Smoker |
1398 (15.0%) |
782 (9.0%) |
486 (6.56%) |
318 (4.0%) |
348 (3.8%) |
3332 (7.8%) |
|||||||||
|
Non-smoker |
7956 (85.1%) |
7906 (91.0%) |
6921 (93.4%) |
7570 (96.0%) |
8897 (96.2%) |
39 250 (92.2%) |
|||||||||
|
|
|||||||||||||||
|
SD = standard deviation; SEIFA = Socio-Economic Indexes for Areas. |
|||||||||||||||
Box 3 – Distribution of 42 582 nulliparous pregnant women included in analysis, by body mass index class and year
Box 4 – Multivariate analysis of the association between body mass index class and perinatal outcomes for 42 582 nulliparous singleton births, 1980–2014
|
|
Relative risk* (95% confidence interval) |
||||||||||||||
|
Underweight |
Overweight |
Obese class I |
Obese class II |
Obese class III |
Combined obese |
||||||||||
|
|
|||||||||||||||
|
Caesarean delivery |
0.76 (0.70–0.82) |
1.42 (1.36–1.49) |
1.63 (1.53–1.75) |
2.01 (1.82–2.21) |
1.95 (1.69–2.24) |
1.75 (1.65–1.85) |
|||||||||
|
Gestational diabetes |
0.74 (0.64–0.87) |
1.67 (1.51–1.85) |
2.90 (2.51–3.35) |
3.21 (2.56–4.02) |
4.07 (3.01–5.50) |
3.09 (2.74–3.49) |
|||||||||
|
Large for gestational age |
0.69 (0.61–0.77) |
1.30 (1.22–1.39) |
1.43 (1.29–1.59) |
1.47 (1.23–1.74) |
1.70 (1.36–2.12) |
1.47 (1.35–1.60) |
|||||||||
|
Macrosomia |
0.45 (0.26–0.79) |
2.15 (1.74–2.65) |
2.42 (1.75–3.35) |
2.62 (1.56–4.40) |
5.54 (3.38–9.08) |
2.80 (2.16–3.64) |
|||||||||
|
Prematurity† |
1.01 (0.88–1.16) |
1.33 (1.21–1.47) |
1.58 (1.37–1.84) |
1.60 (1.24–2.07) |
1.61 (1.12–2.30) |
1.59 (1.40–1.80) |
|||||||||
|
Admitted to nursery† |
0.89 (0.80–1.00) |
1.31 (1.22–1.41) |
1.55 (1.38–1.73) |
1.94 (1.64–2.30) |
1.50 (1.14–1.98) |
1.62 (1.48–1.78) |
|||||||||
|
Pre-eclampsia‡ |
0.61 (0.43–0.86) |
1.85 (1.60–2.15) |
2.86 (2.37–3.46) |
3.13 (2.36–4.15) |
4.35 (3.14–6.03) |
3.09 (2.63–3.62) |
|||||||||
|
Post partum haemorrhage‡ |
0.68 (0.57–0.82) |
1.31 (1.19–1.45) |
1.44 (1.22–1.68) |
1.77 (1.41–2.23) |
2.51 (1.94–3.25) |
1.63 (1.44–1.85) |
|||||||||
|
Stillbirth |
0.96 (0.61–1.51) |
1.24 (0.91–1.68) |
1.41 (0.87–2.29) |
1.26 (0.52–3.07) |
3.45 (1.63–7.28) |
1.60 (1.08–2.36) |
|||||||||
|
Congenital abnormality |
1.44 (1.05–1.96) |
1.19 (0.92–1.54) |
1.85 (1.29–2.65) |
1.54 (0.79–2.99) |
1.36 (0.51–3.63) |
1.73 (1.26–2.37) |
|||||||||
|
Small for gestational age |
1.44 (1.28–1.63) |
0.84 (0.74–0.95) |
0.68 (0.53–0.86) |
0.73 (0.49–1.09) |
0.75 (0.43–1.30) |
0.70 (0.57–0.85) |
|||||||||
|
|
|||||||||||||||
|
* Adjusted for maternal age, smoking status, socio-economic status, country of birth, year of baby’s birth. Reference: healthy BMI class. † Results for non-smokers only (n = 39 250), as smoking was associated with effect modification. ‡ Data available only for 2005–2014 (n = 17 133). |
|||||||||||||||
Box 5 – Proportions of selected perinatal outcomes attributable to maternal overweight and obesity (population attributable fractions), 1980–2014, by 5-year bands*
|
Outcome |
1990–1994 |
1995–1999 |
2000–2004 |
2005–2009 |
2010–2014 |
||||||||||
|
|
|||||||||||||||
|
Pre-eclampsia† |
|
|
|
22.4% |
23.8% |
||||||||||
|
Obese |
|
|
|
12.9% |
13.4% |
||||||||||
|
Overweight |
|
|
|
10.9% |
12.0% |
||||||||||
|
Macrosomia |
17.0% |
22.3% |
25.3% |
25.7% |
23.4% |
||||||||||
|
Obese |
7.1% |
8.5% |
7.3% |
13.3% |
13.3% |
||||||||||
|
Overweight |
10.7% |
15.1% |
19.4% |
14.3% |
11.7% |
||||||||||
|
Gestational diabetes |
12.9% |
12.7% |
14.3% |
16.2% |
17.0% |
||||||||||
|
Obese |
6.9% |
5.8% |
8.6% |
8.9% |
9.4% |
||||||||||
|
Overweight |
6.4% |
7.3% |
6.3% |
8.1% |
8.3% |
||||||||||
|
Caesarean birth |
8.4% |
9.3% |
10.0% |
10.6% |
11.0% |
||||||||||
|
Obese |
3.4% |
3.9% |
4.5% |
4.8% |
4.7% |
||||||||||
|
Overweight |
5.1% |
5.6% |
5.7% |
6.1% |
6.6% |
||||||||||
|
Large for gestational age |
6.8% |
8.1% |
7.9% |
9.4% |
9.0% |
||||||||||
|
Obese |
2.6% |
3.4% |
3.1% |
4.1% |
4.4% |
||||||||||
|
Overweight |
4.3% |
4.9% |
4.9% |
5.5% |
4.8% |
||||||||||
|
Post partum haemorrhage† |
|
|
|
8.7% |
8.9% |
||||||||||
|
Obese |
|
|
|
4.2% |
4.3% |
||||||||||
|
Overweight |
|
|
|
4.6% |
4.7% |
||||||||||
|
Stillbirth |
5.3% |
6.7% |
6.3% |
9.6% |
8.8% |
||||||||||
|
Obese |
3.3% |
2.5% |
2.8% |
6.8% |
4.4% |
||||||||||
|
Overweight |
2.0% |
4.3% |
3.5% |
3.1% |
4.6% |
||||||||||
|
Admitted to nursery‡ |
6.5% |
7.2% |
8.1% |
8.3% |
8.4% |
||||||||||
|
Obese |
2.9% |
2.8% |
3.4% |
4.3% |
4.0% |
||||||||||
|
Overweight |
3.7% |
4.4% |
4.9% |
4.2% |
4.5% |
||||||||||
|
Prematurity‡ |
6.1% |
7.2% |
7.8% |
8.4% |
8.0% |
||||||||||
|
Obese |
2.5% |
2.5% |
3.2% |
3.5% |
4.0% |
||||||||||
|
Overweight |
3.6% |
4.8% |
4.7% |
5.1% |
4.1% |
||||||||||
|
Fetal abnormality |
6.3% |
8.1% |
8.6% |
7.0% |
4.7% |
||||||||||
|
Obese |
4.0% |
4.8% |
6.1% |
4.0% |
3.1% |
||||||||||
|
Overweight |
2.4% |
3.4% |
2.7% |
3.1% |
1.6% |
||||||||||
|
|
|||||||||||||||
|
* Adjusted for maternal age, smoking status, socio-economic status, ethnicity, year of birth. Reference group: normal body mass index class. † Data available only for 2005–2014 (n = 17 133). ‡ Results are for non-smokers only (n = 39 250), as smoking was associated with effect modification. |
|||||||||||||||
Box 6 – Proportions of selected perinatal outcomes attributable to maternal overweight and obesity that could be averted if women were in the next lower body mass index (BMI) class,* 1980–2014, by 5-year bands
|
Outcome |
1990–1994 |
1995–1999 |
2000–2004 |
2005–2009 |
2010–2014 |
||||||||||
|
|
|||||||||||||||
|
Pre-eclampsia† |
|
|
|
17.7% |
19.0% |
||||||||||
|
Macrosomia |
13.0% |
17.7% |
21.5% |
18.4% |
15.9% |
||||||||||
|
Gestational diabetes |
10.8% |
11.0% |
11.8% |
13.6% |
14.2% |
||||||||||
|
Caesarean birth |
6.6% |
7.2% |
7.5% |
8.1% |
8.5% |
||||||||||
|
Large for gestational age |
5.6% |
6.6% |
6.5% |
7.7% |
7.1% |
||||||||||
|
Stillbirth |
4.0% |
5.7% |
5.2% |
7.0% |
7.1% |
||||||||||
|
Post partum haemorrhage† |
|
|
|
6.6% |
6.8% |
||||||||||
|
Admitted to nursery |
5.1% |
5.8% |
6.5% |
6.3% |
6.5% |
||||||||||
|
Prematurity |
4.7% |
5.8% |
6.0% |
6.5% |
5.8% |
||||||||||
|
Fetal abnormality |
5.3% |
6.8% |
7.0% |
6.0% |
3.8% |
||||||||||
|
|
|||||||||||||||
|
* That is, the potential benefit of a downwards shift of one BMI category (obese to overweight or overweight to obese) prior to becoming pregnant. † Data available only for 2005–2014 (n = 17 133). |
|||||||||||||||
Received 9 April 2017, accepted 20 September 2017
- Kate Cheney1
- Rachel Farber2
- Alexandra L Barratt2
- Kevin McGeechan2
- Bradley de Vries1,3
- Robert Ogle1
- Kirsten I Black1,3
- 1 Royal Prince Alfred Hospital, Sydney, NSW
- 2 Sydney School of Public Health, University of Sydney, Sydney, NSW
- 3 University of Sydney, Sydney, NSW
No relevant disclosures.
- 1. NCD Risk Factor Collaboration. Trends in adult body-mass index in 200 countries from 1975 to 2014: a pooled analysis of 1698 population-based measurement studies with 19.2 million participants. Lancet 2016; 387: 1377-1396.
- 2. Ng M, Fleming T, Robinson M, et al. Global, regional, and national prevalence of overweight and obesity in children and adults during 1980–2013: a systematic analysis for the Global Burden of Disease Study 2013. Lancet 2014; 384: 766-781.
- 3. Ma RCW, Schmidt MI, Tam WH, et al. Clinical management of pregnancy in the obese mother: before conception, during pregnancy, and postpartum. Lancet Diabetes Endocrinol 2016; 4: 1037-1049.
- 4. McIntyre HD, Gibbons KS, Flenady VJ, Callaway LK. Overweight and obesity in Australian mothers: epidemic or endemic? Med J Aust 2012; 196: 184-188. <MJA full text>
- 5. Godfrey KM, Reynolds RM, Prescott SL, et al. Influence of maternal obesity on the long-term health of offspring. Lancet Diabetes Endocrinol 2017; 5: 53-64.
- 6. World Health Organization. Consideration of the evidence on childhood obesity for the Commission on Ending Childhood Obesity: report of the ad hoc working group on science and evidence for ending childhood obesity, Geneva: WHO, 2016. http://apps.who.int/iris/bitstream/10665/206549/1/9789241565332_eng.pdf (viewed June 2017).
- 7. Flegal KM, Panagiotou OA, Graubard BI. Estimating population attributable fractions to quantify the health burden of obesity. Ann Epidemiol 2015; 25: 201-207.
- 8. Oteng-Ntim E, Kopeika J, Seed P, et al. Impact of obesity on pregnancy outcome in different ethnic groups: calculating population attributable fractions. PLoS One 2013; 8: e53749.
- 9. MacInnis N, Woolcott CG, McDonald S, Kuhle S. Population attributable risk fractions of maternal overweight and obesity for adverse perinatal outcomes. Sci Rep 2016; 6: 22895.
- 10. New South Wales Ministry of Health. NSW mothers and babies 2014. Sydney: NSW Ministry of Health, 2016. http://www.health.nsw.gov.au/hsnsw/Publications/mothers-and-babies-2014.pdf (viewed Nov 2017).
- 11. Rasmussen KM, Yaktine AL (ed). Weight gain during pregnancy: reexamining the guidelines. Washington (DC): National Academies Press, 2009. https://www.ncbi.nlm.nih.gov/pubmed/20669500 (viewed Nov 2017).
- 12. Australian Bureau of Statistics. 2033.0.55.001. Census of Population and Housing: Socio-Economic Indexes for Areas (SEIFA), Australia, 2011 (tab, Past & future releases). Mar 2013. http://www.abs.gov.au/AUSSTATS/abs@.nsf/Lookup/2033.0.55.001Main+Features12011?OpenDocument (viewed Nov 2017).
- 13. Australian Bureau of Statistics. 1269.0. Standard Australian Classification of Countries (SACC), 2016. June 2016. http://www.abs.gov.au/ausstats/abs@.nsf/mf/1269.0 (viewed Nov 2017).
- 14. Hoffman L, Nolan C, Wilson JD, et al. Gestational diabetes mellitus — management guidelines. Med J Aust 1998; 169: 93-97. <MJA full text>
- 15. Lowe SA, Brown MA, Dekker GA, et al. Guidelines for the management of hypertensive disorders of pregnancy 2008. Aust N Z J Obstet Gynaecol 2009; 49: 242-246.
- 16. Perinatal Society of Australia and New Zealand. Perinatal mortality classifications. In: PSANZ Perinatal Mortality Group, Clinical practice guideline for perinatal mortality. Second edition, version 2.2. https://www.psanz.com.au/assets/Uploads/Section-7-Version-2.2-April-2009.pdf (viewed Nov 2017).
- 17. WHO: recommended definitions, terminology and format for statistical tables related to the perinatal period and use of a new certificate for cause of perinatal deaths. Modifications recommended by FIGO as amended October 14, 1976. Acta Obstet Gynecol Scand 1977; 56: 247-253.
- 18. Villar J, Papageorghiou AT, Pang R, et al. The likeness of fetal growth and newborn size across non-isolated populations in the INTERGROWTH-21 Project: the Fetal Growth Longitudinal Study and Newborn Cross-Sectional Study. Lancet Diabetes Endocrinol 2014; 2: 781-892.
- 19. Rockhill B, Newman B, Weinberg C. Use and misuse of population attributable fractions. Am J Public Health 1998; 88: 15-19.
- 20. Levin ML. The occurrence of lung cancer in man. Acta Unio Int Contra Cancrum 1953; 9: 531-541.
- 21. Gaudet L, Ferraro ZM, Wen SW, Walker M. Maternal obesity and occurrence of fetal macrosomia: a systematic review and meta-analysis. Biomed Res Int 2014; 2014: 640291.
- 22. WHO Expert Consultation. Appropriate body-mass index for Asian populations and its implications for policy and intervention strategies. Lancet 2004; 363: 157-163.
- 23. Brownfoot F, Davey MA, Kornman L. Routine weighing to reduce excessive antenatal weight gain: a randomised controlled trial. BJOG 2016; 123: 254-261.
- 24. Allen-Walker V, Woodside J, Holmes V, et al. Routine weighing of women during pregnancy — is it time to change current practice? BJOG 2016; 123: 871-874.
- 25. Australian Health Ministers’ Advisory Council. Clinical practice guidelines: antenatal care — module 1. Canberra: Australian Government Department of Health and Ageing, 2012. http://www.health.gov.au/internet/main/publishing.nsf/Content/6E83884557AB0AF5CA258110001BC9F9/$File/ANC_Guidelines_Mod1_v32.pdf (viewed Nov 2017).
- 26. Dodd J, Turnbull D, McPhee A, et al. Limiting weight gain in overweight and obese women during pregnancy to improve health outcomes: the LIMIT randomised controlled trial. BMC Pregnancy Childbirth 2011; 11: 79.
- 27. Poston L, Bell R, Croker H, et al. Effect of a behavioural intervention in obese pregnant women (the UPBEAT study): a multicentre, randomised controlled trial. Lancet Diabetes Endocrinol 2015; 3: 767-777.
- 28. Frayne DJ, Verbiest S, Chelmow D, et al. Health care system measures to advance preconception wellness: consensus recommendations of the Clinical Workgroup of the National Preconception Health and Health Care Initiative. Obstet Gynecol 2016; 127: 863-872.
- 29. The Royal Australian and New Zealand College of Obstetricians and Gynaecologists. Management of obesity in pregnancy: College statement C-Obs 49. Updated Mar 2017. https://www.ranzcog.edu.au/Statements-Guidelines/Obstetrics/Obesity-in-Pregnancy,-Management-of-(C-Obs-49) (viewed July 2017).
- 30. Talley N. National Health Summit on Obesity calls for Australia to take action to stem the pandemic. Med J Aust 2017; 206: 106-107. <MJA full text>
Abstract
Objective: To examine the prevalence across 25 years of overweight and obesity among nulliparous Australian women during early pregnancy; to estimate the proportions of adverse perinatal outcomes attributable to overweight and obesity in this population.
Design: Cohort study; retrospective analysis of electronic maternity data.
Setting, participants: 42 582 nulliparous women with singleton pregnancies giving birth at the Royal Prince Alfred Hospital, an urban teaching hospital in Sydney, January 1990 – December 2014.
Main outcome measures: Maternal body mass index (BMI), socio-demographic characteristics, and selected maternal, birth and neonatal outcomes; the proportion of adverse perinatal outcomes that could be averted by reducing the prevalence of overweight and obesity in women prior to first pregnancies (population attributable fraction, PAF).
Results: The prevalence of overweight among nulliparous pregnant women increased from 12.7% (1990–1994) to 16.4% (2010–2014); the prevalence of obesity rose from 4.8% to 7.3% in the same period, while the proportion with normal range BMIs fell from 73.5% to 68.2%. The PAFs for key adverse maternal and neonatal outcomes increased across the study period; during 2010–2014, 23.8% of pre-eclampsia, 23.4% of fetal macrosomia, and 17.0% of gestational diabetes were attributable to overweight and obesity. Were overweight and obese women to have moved down one BMI category during 2010–2014, 19% of pre-eclampsia, 15.9% of macrosomia, 14.2% of gestational diabetes, 8.5% of caesarean deliveries, 7.1% of low for gestational age birthweight, 6.8% of post partum haemorrhage, 6.5% of admissions to special care nursery, 5.8% of prematurity, and 3.8% of fetal abnormality could have been averted.
Conclusions: Over the past 25 years, the proportions of adverse perinatal outcomes attributable to overweight and obesity have risen with the increasing prevalence of maternal overweight and obesity. A substantial proportion of these outcomes might be averted with obesity prevention strategies that reduce pre-pregnancy maternal weight.