


The known Microcephaly has recently received increased attention because it is associated with congenital Zika virus infection. The World Health Organization recommends that countries at risk of Zika virus transmission collate baseline data on the historical prevalence of microcephaly.
The new We report the prevalence and characteristics of microcephaly in a geographically defined Australian population over a 35-year period. Significant rate differences between Aboriginal and non-Aboriginal births were identified.
The implications Our study provides a useful baseline that will allow changes in microcephaly prevalence to be measured, and raises important matters for consideration by other jurisdictions reviewing their birth defects surveillance systems.
Microcephaly is a birth defect in which a child’s head is smaller than expected for their age, sex and ethnicity; there are, however, varying operational definitions of how much smaller (eg, head circumference below the first or third percentile, or more than two or three standard deviations below the mean value). The lack of a universally accepted definition complicates the comparison of prevalence estimates, which range from 2 to 12 per 10 000 live births in the United States,1 0.5 to 10 per 10 000 total births in EUROCAT registries (source: http://www.eurocat-network.eu/accessprevalencedata/prevalencetables), and 2 to 6 per 10 000 total births in Australia.2-4
Known causes of microcephaly include genetic conditions, metabolic diseases, teratogens (eg, alcohol), severe malnutrition (eg, extreme placental insufficiency), and transplacental infections.5 For many children the cause is unknown.
Microcephaly has recently gained increased attention because of its association with congenital Zika virus infection.6 It is predicted that more than 2.2 billion people live in areas where there is a risk of Zika virus infection.7 Local transmission has recently been reported in Singapore8 and in other common travel destinations for Australians.9 The most common vector, the mosquito Aedes aegypti, is found in northern and central Queensland; although local transmission of Zika virus has not been reported, returning travellers with Zika viraemia could infect local mosquitoes and thereby cause a local outbreak. A. aegypti was once present in other Australian states and territories, and there is concern that the mosquito could become re-established outside Queensland.10
Because of the many travellers returning from Zika-affected countries and the potential for Zika virus transmission to become established in Australia, we report baseline data on the prevalence and characteristics of microcephaly in a geographically defined Australian population over a 35-year period (1980–2015).
Methods
Cases of microcephaly were identified in the Western Australian Register of Developmental Anomalies (WARDA), a population-based statutory register with high ascertainment of developmental anomalies (cerebral palsy and birth defects).3,11 Birth defects are defined as structural or functional abnormalities present from conception or before the end of pregnancy and ascertained after a live birth (diagnosed by 6 years of age), stillbirth (minimum 20 weeks’ gestation), or a pregnancy terminated because of detected fetal anomalies (regardless of gestational age). Each defect (up to ten per case) is coded according to the British Paediatric Association extension to the International Classification of Diseases, ninth revision (BPA–ICD9).12
WARDA defines microcephaly as an occipito-frontal head circumference below the third percentile or more than two standard deviations (SDs) below the mean sex- and age-appropriate distribution curve. Any known primary cause (eg, infection, clinical syndrome) is recorded, but the head circumference measurements are not recorded. All identified cases fulfilled the third percentile criterion; either the head circumference measurement was validated by WARDA staff, or the notifier (specialist, genetics services, neonatal units) confirmed applying this criterion. The definition and registration criteria have not changed since 1980.
We identified all cases of microcephaly (BPA–ICD9, 742.10) recorded during January 1980 – December 2015. Each case was reviewed and classified according to aetiology:
cause unknown;
microcephaly associated with a chromosomal defect;
monogenic disorder known to affect head size;
known environmental cause (eg, fetal alcohol spectrum disorder [FASD]);
congenital infection; or
other cause.
We also grouped cases according to whether microcephaly was the only defect (“isolated”), or further major birth defects were reported (“associated”). We examined the age at diagnosis and notification sources.
Microcephaly prevalence was defined as the total number of cases (in live births, stillbirths and terminations of pregnancy for fetal anomaly) divided by the number all births in WA, expressed as number per 10 000 births. Tabulated denominator data for all WA live and stillbirths of at least 20 weeks’ gestation during the study period were obtained from the statutory WA Midwives Notification System. The average annual change in prevalence was calculated by Poisson regression with an offset term. Birth prevalence rates were analysed according to sex, mother’s Aboriginal status, region of residence, known v unknown cause, and isolated v associated microcephaly. We examined associated defects by organ system in cases with known and unknown causes. The prevalence of microcephaly of known and unknown cause in Aboriginal births (5.7% of births during the study period) was compared with that in non-Aboriginal births as prevalence ratios (PRs) with 95% confidence intervals (CIs). Analyses were performed in SPSS 23 (IBM) and EpiBasic (Aarhus University, Denmark).
Ethics approval
Ethics approval was obtained from the Human Research Ethics Committee of the WA Health Department (reference, 2016/19).
Results
Among 963 126 births during 1980–2015, 478 cases of microcephaly were ascertained, a prevalence of 5.0 per 10 000 births (95% CI, 4.53–5.43). For births during 1980–2009 (ie, with at least 6 years’ follow-up and therefore with complete case ascertainment), 416 cases were identified, a prevalence of 5.5 per 10 000 births (95% CI, 4.95–6.02), or 1 in 1830 births.
Of the cases from 1980–2009, 389 (93.5%) involved live births; there were seven stillbirths (1.7%) and 20 terminations of pregnancy for fetal anomaly (4.8%). A cause of microcephaly was identified in 186 cases (45%), and more frequently for Aboriginal (64 cases, 70%) than non-Aboriginal births (122, 38%). The most frequent known cause in Aboriginal births was FASD (11 per 10 000 births; 95% CI, 8.2–14.6); in non-Aboriginal births the most frequent causes were monogenic disorders (0.68 per 10 000 births; 95% CI, 0.51–0.90) and chromosomal defects (0.59 per 10 000 births; 95% CI, 0.42–0.79) (Box 1).
The prevalence of microcephaly of unknown cause was higher among Aboriginal than non-Aboriginal births (6.1 v 2.8 per 10 000 births; PR, 2.2; 95% CI, 1.38–3.22); this was also true for each type of known cause, but was statistically significant only for known environmental (PR, 200; 95% CI, 73–756) and infectious causes (PR, 4.2; 95% CI, 1.40–10.6) (Box 1).
There was no significant temporal trend in microcephaly prevalence during 1980–2009 (Wald χ2 test, P = 0.23; Box 2). The prevalence of microcephaly of unknown cause declined from 3.4 per 10 000 births (95% CI, 2.7–4.2) during 1980–1989 to 2.6 per 10 000 births (95% CI, 2.0–3.2) during 2000–2009, a mean decline of 1.3% per year (95% CI, –2.4% to –0.2%; P = 0.02); that of microcephaly with a known cause increased by a mean 0.4% per year (95% CI, –1.3% to 2.0%; P = 0.67). The average annual increases in the prevalence of microcephaly associated with chromosomal defects (0.6%; 95% CI, –2.1% to 3.4%; P = 0.64), monogenic disorders (0.6%; 95% CI, –2.2% to 3.4%; P = 0.67), and environmental causes (2.6%; 95% CI, –0.3% to 5.4%; P = 0.08) were statistically non-significant. We found a significant 5.6% average annual decline in the prevalence of microcephaly associated with congenital infection (95% CI, –10.0% to –1.1%; P = 0.01); the change was evident for both Aboriginal (4.4% decline; 95% CI, –12.9% to 4.2%; P = 0.32) and non-Aboriginal births (6.0% decline; 95% CI, –10.6% to –1.5%; P = 0.008), but was statistically significant only for non-Aboriginal births.
The prevalence of microcephaly was similar for male and female children, but higher for Aboriginal than non-Aboriginal Australians (PR, 4.5; 95% CI, 3.55–5.73; Box 1). Prevalence was much higher in remote regions, particularly that of microcephaly of known cause (Box 3); this was influenced by the higher proportion of Aboriginal births (and FASD) in these areas (data not shown).
The 81 cases of isolated microcephaly (20% of all cases) were all of unknown cause. All 186 cases with a known cause were associated with other major birth defects, compared with 65% of the 230 cases without a known cause (Box 4).
The overall prevalence of isolated microcephaly declined by a mean 3.4% per year (95% CI, –5.3% to –1.4%; P = 0.001); there was no significant change in the prevalence of microcephaly with associated defects (P = 0.86) (Box 2). Temporal changes in the availability of folate supplements and the introduction of folic acid fortification of some foods were not associated with changes in the prevalence of microcephaly (data not shown).
Microcephaly was diagnosed after the age of 12 months in 27% of cases, increasing from 19% during the 1980s to 29% in the 1990s and 31% during 2000–2009 (Box 5). Isolated cases were more likely to be diagnosed later (35% after 12 months of age), as were cases with a known cause (30% after 12 months of age). For most cases with a known cause diagnosed after 12 months of age, the cause was FASD (52%).
The major notification sources were geneticists, paediatricians, and obstetric and paediatric hospitals. While paediatric and obstetric hospitals maintained steady notification rates, genetics services played an increasingly important role; they contributed more than one-quarter of reported cases during 2000–2009 (data not shown). Most cases were notified by more than one source (mean, 2.8 notifications per case [SD, 1.76]; median, 2 notifications per case [interquartile range, 1–4]).
Discussion
Our study, the first descriptive epidemiological investigation of microcephaly in Australia, provides baseline data on the prevalence of microcephaly in Western Australia over a 35-year period. Most cases of microcephaly were in live-born infants (93.5%), and the overall prevalence was 5.5 per 10 000 births, with annual rates ranging between 2.9 and 7.7 per 10 000 births.
There are few published epidemiological studies of microcephaly, and comparisons are complicated by differences in case definition, period of ascertainment, pregnancy outcomes included, underlying population differences, and environmental variables. These difficulties were illustrated by a recent report of important variations in the prevalence of microcephaly recorded by 16 European birth defects registries.13 In Australia, national estimates are difficult because of major differences between states in the scope of birth defects data collections.14 The most recent national data (for births during 2002–2003),2 which did not include data from the Northern Territory, found a lower prevalence of microcephaly (1.9 per 10 000 births) than we did. Our results, however, are similar to those reported by other registers using the same case definition and equivalent follow-up periods, including the Atlanta Congenital Defects Program1 and the South Australian Register4 (5.0–5.2 per 10 000 births).
Our prevalence estimates, and those reported by birth defects registries in other countries, are well below the rate of 230 cases per 10 000 births expected when a case definition of an occipito-frontal head circumference more than two SDs below the mean for age and sex is applied. This implies that specialists are moderating their notifications according to criteria other than head circumference; these may include notifying cases when they have clinical concern about the child, or when there is an association with a particular cause (eg, trisomy 18). This moderation probably operates in most surveillance systems, including our own. Although head circumference or percentile measures were checked before registering a case of microcephaly in the database, the measurements themselves are not recorded by WARDA. Adding these data to the collection is planned, facilitating assessment of case severity and comparisons with registries using different registration criteria.
We identified a cause for microcephaly in 45% of cases, and more frequently for births to Aboriginal (70%) than to non-Aboriginal mothers (38%). The figure for non-Aboriginal births was similar to those reported from Atlanta (40%)15 and by a German clinic-based study in which the most common cause was genetic in nature (29% of 680 cases;16 similar to the 28% of non-Aboriginal births in our study). We found an average annual decline in microcephaly cases of unknown cause of 1.3%; this may be attributable to improved genetic diagnostic technologies and increasing diagnosis of FASD, factors that may also account for the declining number of cases of isolated microcephaly.
Our results highlight the contribution of FASD to microcephaly in Aboriginal children, with a prevalence of FASD-associated microcephaly (11 per 10 000 births) 260 times that for non-Aboriginal births (0.04 per 10 000 births). FASD also contributed to higher prevalence rates in remote areas of WA. A recent study found that the prevalence of fetal alcohol syndrome in remote WA Aboriginal communities among 7–8-year-old children was 12%, and that 69% of these children had microcephaly;17 another study reported a twofold increase in FASD notifications to WARDA for both Aboriginal and non-Aboriginal births during 1980–2010, coinciding with increased state and national awareness of FASD.18 Nevertheless, FASD is still underdiagnosed, and this may partly explain the higher prevalence of microcephaly of unknown cause in Aboriginal children (6.1 v 2.8 per 10 000 non-Aboriginal births), and may also account for some cases of unknown cause in non-Aboriginal infants. The higher prevalence of microcephaly of unknown cause among Aboriginal Australians may also be related to the relative lack of access to or engagement with health care services and the paucity of genomic reference data for Aboriginal Australians.19 The release of the Australian guide for diagnosing FASD20 and the Partnership Grants (“Models and quality of genetic health services for Aboriginal and Torres Strait Islander people”) co-funded by the National Health and Medical Research Council and the Lowitja Institute may advance aetiological investigations. In addition, a major research program for investigating the diagnosis, prevention and management of FASD is underway in WA.21
In 27% of cases, microcephaly was diagnosed in children more than 12 months old. This large proportion would be missed were ascertainment periods shorter. This factor may be particularly important when differentiating cases of known and unknown cause, especially when microcephaly is associated with conditions (such as FASD and specific genetic anomalies) that are often diagnosed at a later age.18
Further major birth defects were associated with 80% of cases of microcephaly. The most frequent in cases of unknown cause were those affecting the nervous system (61% of associated defects), including neural tube defects (13%). The US National Birth Defects Prevention Network suggests excluding microcephaly associated with neural tube defects, holoprosencephaly, craniosynostosis, and conjoined twins.5 We favour broader inclusion criteria, especially in light of the evolving understanding of the full spectrum of defects that may be associated with congenital Zika infection. One in five definite or probable cases of congenital Zika syndrome in a large case series from Brazil were associated with brain abnormalities in infants without microcephaly, suggesting that surveillance should not focus on microcephaly alone.22 Other defects associated with Zika infection include intracranial calcifications, craniofacial malformations, severe arthrogryposis, and eye defects.23 WARDA includes each of these in its data collection.
Zika virus is the first mosquito-borne virus associated with human birth defects, and is also sexually transmissible. A recent editorial in the MJA24 highlighted the robust Australian systems that enable rapid responses to newly identified communicable diseases, but our capacity for monitoring birth defects was not discussed. Medical practitioners have been advised to ask pregnant women about their recent travel history and to offer testing to those who have visited Zika-affected areas. Birth defect registries that record the causes of birth defects are therefore likely to capture cases of microcephaly or other defects associated with Zika virus exposure in returned travellers. Our capacity to detect changes in the prevalence of microcephaly caused by local transmission of the virus is less clear, as infection is frequently asymptomatic, and the collection of data on birth defects in this country is not standardised, with wide variability between states in case ascertainment.14
As remote regions in Northern Australia either already harbour or are at risk of harbouring A. aegypti mosquitoes, enhanced monitoring of birth defects in these areas (and also of FASD) is important. The Australian Paediatric Surveillance Unit project for the surveillance of microcephaly in infants under 12 months of age is important for responding to the challenges of geographically equitable case ascertainment.25
Attempts to standardise state and territory birth defects data collections have been unsuccessful.26 In the absence of national data, our study provides a useful baseline for measuring changes in microcephaly prevalence, and highlights important matters for consideration by other jurisdictions reviewing their birth defects surveillance systems.
Box 1 – Prevalence of microcephaly (per 10 000 births) by cause and Aboriginal status of the mother, Western Australia, 1980–2009
Cause |
All cases |
Aboriginal |
Non-Aboriginal |
Prevalence ratio (95% CI) |
|||||||||||
Number |
Prevalence (95% CI) |
Number |
Prevalence (95% CI) |
Number |
Prevalence (95% CI) |
||||||||||
Total number of cases |
416 |
5.5(4.95–6.02) |
91 |
21(16.5–25.2) |
325 |
4.5(4.05–5.05) |
4.5(3.55–5.73) |
||||||||
Unknown cause |
230 (55%) |
3.0(2.64–3.44) |
27 |
6.1(4.01–8.86) |
203 |
2.8(2.46–3.25) |
2.2(1.38–3.22) |
||||||||
Known cause |
186 (45%) |
2.4(2.10–2.82) |
64 |
14(11.11–18.43) |
122 |
1.7(1.41–2.03) |
8.5(6.17–11.6) |
||||||||
Chromosomal |
47 (11%) |
0.62(0.45–0.82) |
5 |
1.1(0.37–2.63) |
42 |
0.59(0.42–0.79) |
1.9(0.59–4.86) |
||||||||
Monogenic |
54 (13%) |
0.71(0.53–0.93) |
5 |
1.1(0.37–2.63) |
49 |
0.68(0.51–0.90) |
1.6(0.51–4.12) |
||||||||
Environmental |
53 (13%) |
0.70(0.52–0.91) |
49* |
11(8.2–14.6) |
< 5 |
0.06(0.01–0.14) |
200(73–756) |
||||||||
Fetal alcohol spectrum disorder* |
52 |
0.68(0.51–0.90) |
49* |
11(8.2–14.6) |
< 5 |
0.04(0.01–0.12) |
260(85–1320) |
||||||||
Infectious |
29 (7%) |
0.38(0.26–0.55) |
6* |
1.4(0.50–2.94) |
23 |
0.32(0.20–0.48) |
4.2(1.40–10.6) |
||||||||
Cytomegalovirus* |
24 |
0.32(0.20–0.47) |
5* |
1.1(0.37–2.63) |
19 |
0.26(0.16–0.41) |
4.2(1.24–11.8) |
||||||||
Other infections |
5 |
0.07(0.02–0.15) |
< 5 |
0.22(0.01–1.26) |
< 5 |
0.06(0.01–0.14) |
4.0(0.08–40.8) |
||||||||
Other cause |
< 5 |
0.05(0.01–0.14) |
0 |
— |
< 5 |
0.06(0.01–0.14) |
— |
||||||||
* One child was diagnosed with both cytomegalovirus infection and fetal alcohol spectrum disorder. | |||||||||||||||
Box 2 – Prevalence of microcephaly in Western Australia, 1980–2015: overall prevalence, and prevalence of cases with and without associated anomalies*
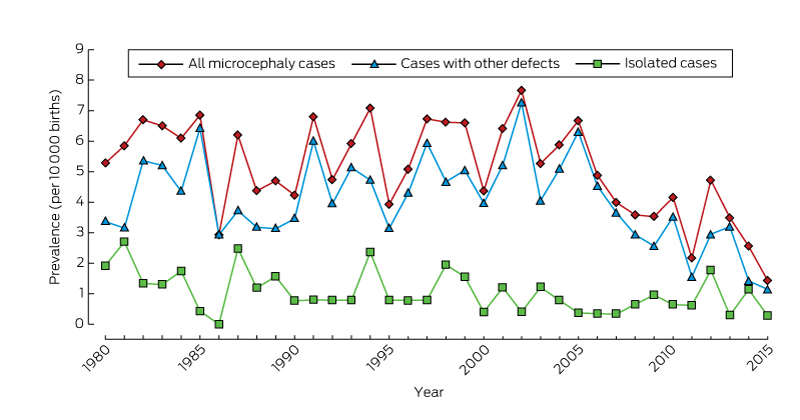
* From 2009, there is less than 6 years’ follow-up of births, so that ascertainment of cases will be incomplete.
Box 3 – Prevalence (per 10 000 births) of microcephaly in Western Australia, 1980–2009
|
All cases |
Microcephaly of known cause |
Microcephaly of unknown Cause |
|||||||||||||
Number |
Prevalence (95% CI) |
Number |
Prevalence (95% CI) |
Number |
Prevalence (95% CI) |
||||||||||
All |
416 |
5.5 (4.95–6.02) |
186 |
2.4 (2.10–2.82) |
230 |
3.0 (2.64–3.44) |
|||||||||
Sex |
|||||||||||||||
Male |
199 |
5.1 (4.41–5.85) |
85 |
2.2 (1.74–2.69) |
114 |
2.9 (2.41–3.51) |
|||||||||
Female |
216 |
5.8 (5.08–6.66) |
101 |
2.7 (2.22–3.31) |
115 |
3.1 (2.56–3.72) |
|||||||||
Missing data |
1 |
1 |
|||||||||||||
Aboriginal status of mother |
|||||||||||||||
Aboriginal |
91 |
21 (16.52–25.2) |
64 |
14 (11.11–18.4) |
27 |
6.1 (4.01–8.86) |
|||||||||
Non-Aboriginal |
325 |
4.5 (4.05–5.05) |
122 |
1.7 (1.41–2.03) |
203 |
2.8 (2.46–3.25) |
|||||||||
Residential location* |
|||||||||||||||
Metropolitan |
261 |
4.8 (4.24–5.42) |
103 |
1.9 (1.55–2.30) |
158 |
2.9 (2.47–3.40) |
|||||||||
Rural |
74 |
5.2 (4.12–6.50) |
31 |
2.2 (1.49–3.12) |
43 |
3.0 (2.21–4.10) |
|||||||||
Remote |
81 |
11 (8.56–13.4) |
52 |
6.9 (5.17–9.07) |
29 |
3.9 (2.59–5.54) |
|||||||||
* According to the postcode of the mother as recorded by WARDA at the time of her child’s birth. The eight WA Department of Health residential location categories were grouped into three classes: metropolitan; rural (Great Southern, South-West, Wheatbelt, Midwest Murchison); and remote (Kimberley, Pilbara–Gascoyne, Goldfields–Southeast). | |||||||||||||||
Box 4 – Association of microcephaly (of known and unknown cause) with other congenital anomalies, Western Australia, 1980–2009
All cases |
Microcephaly of known cause |
Microcephaly of unknown Cause |
|||||||||||||
Total number of cases |
416 |
186 |
230 |
||||||||||||
Isolated microcephaly |
81 (20%) |
0 |
81 (35%) |
||||||||||||
Microcephaly associated with other defects |
335 (80%) |
186 (100%) |
149 (65%) |
||||||||||||
Associated defects by diagnostic category |
335 |
186 |
149 |
||||||||||||
Nervous system, apart from microcephaly |
141 (34%) |
50 (27%) |
91 (61%) |
||||||||||||
Neural tube defects |
25 (6%) |
6 (3%) |
19 (13%) |
||||||||||||
Chromosomal |
47 (11%) |
47 (25%) |
0 |
||||||||||||
Cardiovascular |
49 (12%) |
29 (16%) |
20 (13%) |
||||||||||||
Respiratory |
15 (4%) |
10 (5%) |
5 (3%) |
||||||||||||
Gastrointestinal |
48 (12%) |
20 (11%) |
28 (19%) |
||||||||||||
Musculoskeletal |
72 (17%) |
35 (19%) |
37 (25%) |
||||||||||||
Urogenital |
68 (16%) |
43 (23%) |
25 (17%) |
||||||||||||
Eye |
36 (9%) |
24 (13%) |
12 (8%) |
||||||||||||
Ear, face, neck |
8 (2%) |
3 (2%) |
5 (3%) |
||||||||||||
Integument |
4 (1%) |
2 (1%) |
2 (1%) |
||||||||||||
Other major diagnoses |
158 (38%) |
142 (76%) |
16 (11%) |
||||||||||||
Monogenic condition |
58 (14%) |
54 (29%) |
4 (3%) |
||||||||||||
Fetal alcohol spectrum disorder |
52 (12%) |
52 (28%) |
0 |
||||||||||||
Box 5 – Number of cases of microcephaly in Western Australia, 1980–2015, by age at diagnosis
Age at diagnosis |
Follow-up period |
||||||||||||||
|
At least 6 years (416 cases) |
Less than 6 years (62 cases) |
||||||||||||||
1980–1989 |
1990–1999 |
2000–2009 |
2010–2015 |
||||||||||||
Prenatal |
16 (12%) |
25 (17%) |
18 (13%) |
18 (29%) |
|||||||||||
Within first month of life |
47 (36%) |
49 (33%) |
40 (29%) |
16 (26%) |
|||||||||||
> 1 month to 1 year |
33 (26%) |
26 (18%) |
36 (26%) |
16 (26%) |
|||||||||||
> 1 year to 3 years |
16 (12%) |
24 (16%) |
27 (19%) |
7 (11%) |
|||||||||||
> 3 years to 6 years |
9 (7%) |
19 (13%) |
17 (12%) |
3 (5%) |
|||||||||||
Post mortem |
8 (6%) |
4 (3%) |
2 (1%) |
2 (3%) |
|||||||||||
Received 11 August 2016, accepted 16 January 2017
- Michele Hansen1
- Paul K Armstrong2
- Carol Bower1
- Gareth S Baynam3,4
- 1 Telethon Kids Institute, Perth, WA
- 2 Communicable Disease Control Directorate, WA Department of Health, Perth, WA
- 3 Genetic Services of Western Australia, King Edward Memorial Hospital, Perth, WA
- 4 Western Australian Register of Developmental Anomalies, King Edward Memorial Hospital, Perth, WA
Michele Hansen is supported by an Australian National Health and Medical Research Council Fellowship (1090648). We thank Edwina Rudy (WARDA), Girard Good (for data extraction), and the notifiers to the Register.
No relevant disclosures.
- 1. National Birth Defects Prevention Network. Major birth defects data from population-based birth defects surveillance programs in the United States, 2006–2010. Birth Defects Res A Clin Mol Teratol 2013; 97: S1-S172.
- 2. Abeywardana S, Sullivan EA. Congenital anomalies in Australia 2002–2003 (AIWH Cat. No. PER 41; Birth Anomalies Series No. 3). Sydney: Australian Institute of Health and Welfare National Perinatal Statistics Unit, 2008.
- 3. Bower C, Baynam G, Rudy E, et al. Report of the Western Australian Register of Developmental Anomalies 1980–2014 (Report No. 22). Perth: King Edward Memorial Hospital, 2015. Archived: http://web.archive.org/web/20160229120343/http://kemh.health.wa.gov.au/services/register_developmental_anomalies/documents/2016_Annual_Report_of_the_WA_Register_of_Developmental_Abnormalities.pdf (accessed Feb 2017).
- 4. Gibson CS, Scott H, Rice R, Scheil W. Birth defects in South Australia 2012. Adelaide: SA Birth Defects Register, Women’s and Children’s Health Network, Adelaide, 2015. http://www.wch.sa.gov.au/services/az/other/phru/documents/2012_sabdr_annual_report.pdf (accessed Feb 2017).
- 5. National Birth Defects Prevention Network. NBDPN abstractor’s instructions: congenital microcephaly. Apr 2016. http://www.nbdpn.org/docs/NBDPN_Case_Definition-SurveillanceMicrocephaly2016Apr11.pdf (accessed July 2016).
- 6. Rasmussen SA, Jamieson DJ, Honein MA, Petersen LR. Zika virus and birth defects — reviewing the evidence for causality. N Engl J Med 2016; 374: 1981-1987.
- 7. Messina JP, Kraemer MU, Brady OJ, et al. Mapping global environmental suitability for Zika virus. Elife 2016; e15272.
- 8. Dyer O. Outbreak of Zika in Singapore sparks warnings in neighbouring countries. BMJ 2016; 354: i4740.
- 9. European Centre for Disease Prevention and Control. Countries and territories with local Zika transmission. Updated Aug 2016. http://ecdc.europa.eu/en/healthtopics/zika_virus_infection/zika-outbreak/Pages/Zika-countries-with-transmission.aspx (accessed Aug 2016).
- 10. Beebe NW, Cooper RD, Mottram P, Sweeney AW. Australia’s dengue risk driven by human adaptation to climate change. PLoS Negl Trop Dis 2009; 3: e429.
- 11. Bower C, Ryan A, Rudy E. Ascertainment of pregnancies terminated because of birth defects: effect on completeness of adding a new source of data. Teratology 2001; 63: 23-25.
- 12. British Paediatric Association. British Paediatric Association Classification of Diseases: successor to the Cardiff Diagnostic Classification. A paediatric supplement compatible with the ninth revision of the WHO International Classification of Diseases, 1977. London: BPA, 1979.
- 13. Morris JK, Rankin J, Garne E, et al. Prevalence of microcephaly in Europe: population based study. BMJ 2016; 354: i4721.
- 14. Birch M-R, Grayson N, Sullivan EA. Recommendations for development of a new Australian birth anomalies system: a review of the Congenital Malformations and Birth Defects Data Collection (AIHW Cat. No. PER 23; Birth Anomalies Series No. 1). Sydney: Australian Institute of Health and Welfare, 2004.
- 15. Cragan JD. Surveillance for microcephaly. Atlanta: National Center on Birth Defects and Developmental Disabilities, Centers for Disease Control and Prevention. Feb 2016. http://www.cdc.gov/ncbddd/birthdefects/documents/surveillance-microcephaly-webinar.pdf (accessed Jul 2016).
- 16. von der Hagen M, Pivarcsi M, Liebe J, et al. Diagnostic approach to microcephaly in childhood: a two-center study and review of the literature. Dev Med Child Neurol 2014; 56: 732-741.
- 17. Fitzpatrick JP, Latimer J, Carter M, et al. Prevalence of fetal alcohol syndrome in a population-based sample of children living in remote Australia: the Lililwan Project. J Paediatr Child Health 2015; 51: 450-457.
- 18. Mutch RC, Watkins R, Bower C. Fetal alcohol spectrum disorders: notifications to the Western Australian Register of Developmental Anomalies. J Paediatr Child Health 2015; 51: 433-436.
- 19. Baynam G, Pearson G, Blackwell J. Translating Aboriginal genomics — four letters Closing the Gap. Med J Aust 2016; 205: 379. <MJA full text>
- 20. Bower C, Elliot EJ, on behalf of the Steering Group. Report to the Australian Government Department of Health: Australian guide to the diagnosis of fetal alcohol spectrum disorder (FASD). May 2016. http://www.apsu.org.au/assets/Uploads/20160505-rep-australian-guide-to-diagnosis-of-fasd.pdf (accessed Aug 2016).
- 21. Telethon Kids Institute. Alcohol and pregnancy and FASD [website]. 2016. http://alcoholpregnancy.telethonkids.org.au/ (accessed Nov 2016).
- 22. Franca GV, Schuler-Faccini L, Oliveira WK, et al. Congenital Zika virus syndrome in Brazil: a case series of the first 1501 livebirths with complete investigation. Lancet 2016; 388: 891-897.
- 23. Moore CA, Staples JE, Dobyns WB, et al. Characterizing the pattern of anomalies in congenital Zika syndrome for pediatric clinicians. JAMA Pediatr 2016; 171: 288-295.
- 24. Baggoley C, Knope K, Colwell A, Firman J. Zika preparedness in Australia. Med J Aust 2016; 204: 249-250. <MJA full text>
- 25. Australian Paediatric Surveillance Unit. APSU Surveillance of microcephaly in children aged < 12 months. 2016. http://www.apsu.org.au/assets/current-studies/5-Alert-Microcephaly-02.06.2016.pdf (accessed July 2016).
- 26. Bower CI, Lester-Smith D, Elliott EJ. Congenital anomalies — why bother? Med J Aust 2010; 192: 300-301. <MJA full text>
Abstract
Objectives: To describe the prevalence and characteristics of microcephaly in a geographically defined Australian population.
Design, setting and participants: Descriptive epidemiological study of microcephaly cases ascertained by the Western Australian Register of Developmental Anomalies, 1980–2015, defining microcephaly as an occipito-frontal head circumference below the third percentile or more than two standard deviations below the mean sex- and age-appropriate distribution curve.
Main outcome measures: Microcephaly prevalence (per 10 000 births) was calculated for cases with known and unknown causes, and by demographic characteristics. Temporal trends were analysed, and prevalence ratios (PRs) and 95% CIs calculated for Aboriginal and non-Aboriginal births.
Results: For births during 1980–2009 (ie, with at least 6 years’ follow-up and therefore complete case ascertainment), 416 cases were identified, a prevalence of 5.5 per 10 000 births (95% CI, 4.95–6.02), or 1 in 1830 births. There was no significant temporal trend in prevalence (P = 0.23). Most cases were in live-born children (389, 93.5%), and other major birth defects were diagnosed in 335 of the affected children (80%). Prevalence was higher in Aboriginal births (PR, 4.5; 95% CI, 3.55–5.73). A cause of microcephaly was identified in 186 cases (45% of cases), and more often for Aboriginal (64 cases, 70%) than non-Aboriginal births (122 cases, 38%). The most frequent known cause of microcephaly in Aboriginal births was fetal alcohol spectrum disorder (FASD; 11 per 10 000 births); monogenic (0.68 per 10 000) and chromosomal conditions (0.59 per 10 000 births) were the most common causes in non-Aboriginal births.
Conclusions: These data provide a baseline for prospective surveillance of microcephaly. We identified a high proportion of cases without known cause, highlighting the need for clinicians to carefully investigate all possibilities, including emerging infections. FASD is an important cause of microcephaly in the Aboriginal population.