


The known Re-admissions are a significant contributor to the burden and medical costs associated with hospitalisation of people with diabetes.
The new Almost one-quarter of older patients hospitalised for diabetes were re-hospitalised within 30 days, most of whom were re-admitted within 14 days of discharge. The patients at greatest risk of re-admission were those with comorbid heart failure, multiple recent hospitalisations, and multiple prescribers involved in their care.
The implications Identification in hospital of at-risk patients with diabetes, together with targeted follow-up during the first 14 days after discharge, may facilitate appropriate interventions that avert their re-admission.
People with diabetes are often admitted to hospital several times; it was reported in the United States that 30% of patients hospitalised for diabetes had been admitted at least twice during the previous year.1 These findings have important consequences for health care costs; hospital inpatient care was identified as the largest item of medical expenditure for patients with diabetes in the US, accounting for 43% of the total medical costs, or US$409 billion.2 In Australia, hospital inpatient care for people with diabetes was conservatively estimated to cost $647 million in 2008–09, or more than 40% of all diabetes-related health care expenditure.3 About 85% of patients hospitalised for type 2 diabetes in Australia are aged 65 years or over,4 and the average cost per hospitalisation is $8755.3 Many of these admissions could potentially be prevented were appropriate primary care provided.5 Hospitalisations for diabetes account for almost one-quarter of all potentially preventable admissions in Australia.5
Re-admissions are a significant contributor to the burden and medical costs associated with hospitalisation of people with diabetes.6,7 Studies in the US have found that as many as 20% of patients hospitalised for diabetes are re-admitted within 30 days of discharge, compared with 5–14% for other types of admission.8,9 Almost half of these re-hospitalisations (9.4% of index admissions) are for a diabetes-related diagnosis.8
Hospital re-admission, particularly within 30 days of discharge, is used as a quality-of-care metric in the US, and has been identified as a high priority health care quality measure for patients with diabetes.10,11 It is suggested that poor coordination of care and discharge planning contribute to high rates of re-admission;10 a large US study of almost 600 000 re-admissions within 30 days of discharge (for either a medical or surgical index condition) found that half of the patients had had no primary care visit between discharge and re-hospitalisation.11,12
Little is known at the population level about the rate of re-admission after hospitalisation for diabetes in Australia or the factors that contribute to the risk of re-admission. The aim of our study was to identify which patients are at risk of 30-day re-admission, and factors that contribute to re-hospitalisation of older Australians with diabetes.
Methods
Data source
We undertook a retrospective cohort study of administrative claims data in the health claims database of the Department of Veterans’ Affairs (DVA) for all patients hospitalised for a diabetes-related condition between 1 January 2012 and 31 December 2012. The DVA database contains details of all subsidised prescription medicines, medical and allied health services, and hospitalisations for a treatment population of 240 000 veterans and war widows and widowers.13
Cohort selection
Patients were included if they were eligible for all health services subsidised by the DVA in the 12 months prior to 1 January 2012 and had been hospitalised for diabetes (primary diagnosis: International Classification of Diseases, version 10, Australian modification [ICD-10-AM] codes E10, E11, E13, E14, R73, T383, Y423) during the period 1 January 2012 – 31 December 2012. Diabetes in these patients included insulin-dependent diabetes, non-insulin-dependent diabetes, other specified and unspecified types of diabetes, with or without complications (coma; hypoglycaemia; ketoacidosis; renal, ophthalmic, neurological, or peripheral circulatory complications; arthropathy). Also included were hospitalisations for elevated blood glucose levels and adverse effects specifically caused by insulin and oral hypoglycaemic (anti-diabetic) drugs. The first index hospitalisation during the study period for each patient was included. Patients who were alive at discharge from the index hospital stay and were neither re-hospitalised with a primary diagnosis of dialysis or rehabilitation within 30 days of discharge, nor re-admitted on the day of discharge, were included in the final study cohort.
Study outcomes and clinical characteristics
The primary study outcomes were the causes of re-hospitalisation and the prevalence of clinical factors associated with re-hospitalisation, including age, sex, residential status at the index admission; length of stay for the index hospitalisation; number and types of comorbid conditions, number of unique medicines, and number and type of prior hospitalisations (in the 6 months before the index admission); and the number of standard general practitioner visits and numbers of unique prescribers and pharmacies (in the 12 months before the index admission). Whether a medication review was undertaken or a GP management plan prepared (during the 12 months before the index admission) and the specific types of anti-diabetic medicines used (during the 6 months before the index admission) were also examined. Secondary outcomes included the proportions of patients who were re-hospitalised within 1–3 days, 1–7 days and 1–14 days of discharge; the proportions of patients who visited a GP within 14 and 30 days of discharge; and the proportion of patients who visited a GP before re-hospitalisation.
Comorbid conditions were identified using the validated, pharmaceutical-based comorbidity index Rx-Risk-V model (Australian adaptation), diagnoses in hospital records (based on ICD-10-AM codes), and specific Anatomical Therapeutic Chemical (ATC) codes for medications (that are not part of the Rx-Risk score).14 Specifically, depression was identified by the dispensing of a non-tricyclic antidepressant (ATC codes N06AB, N06AG02, N06AX; tricyclic antidepressants were excluded because they are commonly used to treat diabetic neuropathy). Cancers, except non-malignant skin cancer, were identified from hospital records for the 12 months before the index admission (ICD-10-AM codes C00–C97, excluding C44). Urinary incontinence was identified by dispensing of medicines for urinary incontinence (ATC code G04BD). Comorbidities were categorised as those related to diabetes (conditions with a shared pathogenesis or management plan, including macrovascular and microvascular diseases) and those unrelated to diabetes (as described previously14).
Following discharge, patients were followed up for 30 days, or until re-hospitalisation or death. Re-hospitalisations were classified according to whether they were potentially preventable according to criteria previously defined in Australia; that is, admissions that might have been prevented by high quality primary and preventive care.5 Potentially preventable hospitalisation diagnoses included chronic conditions, selected acute conditions, and vaccine-related hospitalisations, as described previously (online Appendix).5 We used principal diagnosis codes for this study, as the recording of secondary diagnoses may not reflect the reason for admission, but rather the presence of co-existing conditions or conditions that developed during the episode of admitted patient care.15
Statistical analyses
Data are presented as medians (with interquartile ranges [IQRs]) and percentages. Characteristics predictive of 30-day re-hospitalisation were identified by univariate logistic regression. Variables for which P ≤ 0.10 in the univariate analyses were included in a backward stepwise multivariate logistic regression analysis; P < 0.05 was deemed statistically significant for including a factor in the final model. The goodness of fit of the final model was assessed with the Hosmer–Lemeshow statistic. All statistical analyses were performed in SAS 9.4 (SAS Institute).
Ethics approval
Ethics approval was obtained from the University of South Australia Human Research Ethics Committee (reference, P099/10) and the Department of Veterans’ Affairs Human Research Ethics Committee (reference, E010/010).
Results
A total of 848 older patients hospitalised for diabetes were included in the study cohort, of whom 209 (24.6%) were re-hospitalised within 30 days of discharge. Of all 30-day re-admissions, the re-admission diagnosis for 51 patients (24%) was a diabetes-related condition; in most cases (41 of all re-admissions, 20%) these were type 2 diabetes-related conditions, namely hospitalisation for foot ulcer (19 patients, 9.1%) or hyperglycaemia or hypoglycaemia (11 patients, 5.7%). One-fifth of re-admissions (43 patients, 21%) were for cardiovascular conditions, including heart failure (10 patients, 5%) or atherosclerosis (9 patients, 4%). Other re-admission diagnoses included respiratory disorders (8 patients, 4%), cellulitis (8 patients, 4%) and pneumonia (6 patients, 3%). Eighty-five re-admissions (40.7%) were potentially avoidable; most were hospitalisations for chronic conditions (75 patients, 88% of potentially avoidable re-admissions), including diabetes complications (49 patients, 65%). The median lengths of stay were 5 days (IQR, 2–9 days) for re-hospitalisation, and 6 days (IQR, 2–12 days) for the index hospitalisation.
The demographic and clinical characteristics of the 848 older patients hospitalised for diabetes are shown in Box 1. The median age of the study cohort was 87 years (IQR, 77–89 years); 60% were men. The proportion of patients who had seven or more comorbid conditions in the 6 months before the index hospitalisation was greater among those who were re-hospitalised; the number of visits to a GP and numbers of prescribers and pharmacies where medicines were dispensed in the 12 months before admission were also higher for these patients than for those who were not re-admitted (Box 1). The prevalence of both comorbid heart failure (unadjusted odds ratio [OR], 1.53; 95% confidence interval [CI], 1.06–2.21) and end-stage renal disease (OR, 1.96; 95% CI, 1.03–3.72) was significantly higher in people with a 30-day re-admission. There were no significant differences in the types of anti-diabetic medicines used at the time of admission. Almost one-quarter (23.4%) of patients re-admitted within 30 days had had two or more hospitalisations in the 6 months before the index admission, compared with 14.9% of people who were not re-admitted (OR, 1.98; 95% CI, 1.29–3.06; Box 1).
Multivariate analysis indicated that comorbid heart failure, higher numbers of prescribers, and two or more prior hospitalisations were independent predictors of re-admission within 30 days (Box 2).
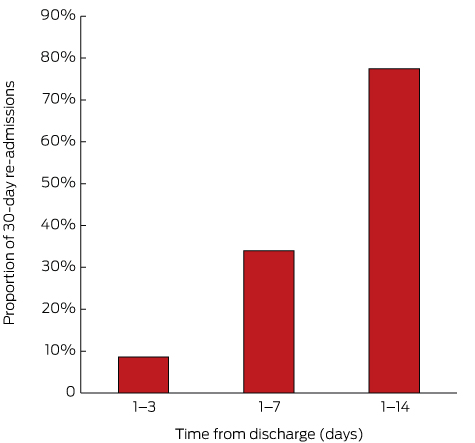
Of the 209 re-admissions within 30 days, 162 (77.5%) were within 14 days of discharge, and more than one-third within 7 days (Box 3). Of the patients who were re-admitted within 30 days of discharge, 128 (61.2%) visited a GP before their re-admission; of the 162 patients re-admitted within 14 days of discharge, 96 (59.3%) had visited a GP before the re-admission. Following discharge, 654 patients in the entire study cohort (77.1%) saw a GP within 30 days, including 515 (60.7%) within 14 days of discharge.
Discussion
Almost one-quarter of older patients hospitalised for diabetes were re-admitted to hospital within 30 days of discharge, of whom three-quarters were re-admitted within 14 days of discharge. We identified a number of factors that characterised diabetic patients at higher risk of re-admission, including comorbid heart failure, more than two recent previous hospitalisations, and seeing multiple prescribers. Proactive identification of patients at higher risk may facilitate preventive actions, including organising GP visits one to two weeks after discharge, particularly for patients who have had a recent prior hospitalisation and who have more than one medical practitioner prescribing their medicines; 41% of patients who were re-admitted had not visited a GP during this period.
While hospital re-admissions are a multifaceted problem, our findings highlight the need for improved care transitions and coordination of care to reduce this significant burden on both patients and the Australian health care system. Re-admissions are expensive, demanding on health care resources, and pose a significant risk to patient safety.6
More than 40% of re-admissions in our study were potentially preventable by providing appropriate primary care. This underscores the importance of the timeliness of clinical handover and of GP visits after discharge, but the proportion of re-admissions within 30 days that are truly preventable is unknown. A recent US study found that 31% of all re-admissions of older patients admitted to hospital for treatment of diabetes were potentially preventable, with hospitalisations for heart failure and diabetes respectively accounting for 48% and 22% of preventable admissions, costing the US health care system an estimated $US62 million.16
Heart failure was the only comorbidity that was a significant predictor of re-admission in our study; it was associated with a 49% increase in the likelihood of re-hospitalisation within 30 days (Box 2). In a large US study, the most common diagnosis among 580 000 Medicare patients re-hospitalised within 30 days of an initial hospitalisation for a medical condition or surgical procedure was also heart failure.12 Another US study reported that the most common cause of re-admission within 30 days for patients initially hospitalised for diabetes, heart failure, ischaemic heart disease, atrial fibrillation or chronic kidney disease was heart failure; comorbid heart failure was associated with a 23% increase in risk of re-admission (risk ratio, 1.23; 95% CI, 1.02–1.48).6
Together with the results from our study, this highlights the significance of comorbid heart failure for the risk of re-hospitalisation of older patients with diabetes. These patients should be targeted for continuity of care services after discharge, particularly during the first 14 days. A 2014 systematic review of 47 studies found that post-discharge interventions, such as home visit programs and multidisciplinary clinics, reduced all-cause re-admission and mortality rates among people with heart failure, and structured telephone support services reduced mortality and the number of heart failure-specific re-admissions.17
Patients who had been admitted to hospital several times during the 6 months before the index hospitalisation were almost 80% more likely to be re-admitted within 30 days (Box 2). Re-admissions are more common among older people, and this population has a higher risk of adverse events and use health services more.18 In a US study, only 30% of patients hospitalised for diabetes had been admitted to hospital more than once in the previous 12 months, but these patients accounted for most (55%) of the inpatient costs for this disorder; many hospitalisations were considered to be preventable by quality outpatient care.19 Inpatient diabetes education, in particular, was found to be associated with a 34% reduction in 30-day re-admission rates (OR, 0.66; 95% CI, 0.51–0.85) for patients with poor glycaemic control at the index hospital admission.20
The risk of re-admission involves a complex relationship between the presence of chronic and acute conditions, the health status of the patient, and health system factors, such as the transition between primary and hospital care and coordination of care, including timely, comprehensive communication.11 It was recently postulated that post-hospital syndrome, an acquired transient condition of generalised vulnerability after discharge, also contributes to re-admissions within 30 days.21 Focused, comprehensive holistic strategies that target stressors which contribute to increased vulnerability may mitigate post-hospital syndrome and the risk of re-hospitalisation.21 Structured multidisciplinary post-discharge support visits have been shown to reduce re-admission rates in people with heart failure, chronic obstructive pulmonary disorder, and in older frail people in general,18,22 as has comprehensive inpatient geriatric health care assessment together with ongoing multidisciplinary support after discharge.23 An Australian study found that such intervention reduced emergency re-admission rates by more than 50%, reduced the number of emergency GP visits, and improved patients’ quality of life;23 the intervention was also found to be cost-effective.24
Medicines reviews had not been undertaken for most of our study cohort (Box 1). Collaborative medicines reviews expedite identifying and resolving medication-related problems and delay the time to hospitalisation for several conditions,25 and may therefore also reduce the risk of re-admission of patients hospitalised for diabetes.
There were limitations to our study. We analysed DVA administrative health data that may not be representative of the overall older Australian population. Members of the DVA cohort can access all health care services, and this may influence their health-seeking behaviour and, potentially, their health outcomes. However, age-specific comparisons of members of the DVA cohort with non-service-related disabilities with people in the wider Australian population have found similar annual rates of GP visits, use of prescriptions, and numbers of hospitalisations.26 We were unable to determine whether re-admission was directly related to the index condition on the basis of the ICD-10 codes for the hospital separation. Further, we could not examine in-hospital changes to medications or the provision of inpatient subacute services during the index admission that may have influenced re-admission, as the dataset did not completely capture in-hospital medicine use and services.
In summary, older people hospitalised for diabetes with comorbid heart failure, more than two other hospitalisations in the previous 6 months, or multiple prescribers involved in their care are at greater risk of being re-admitted to hospital within 30 days of discharge. Improved timeliness of primary care after discharge may be warranted, as almost half of those re-admitted within 14 days of discharge had not seen their GP during this time. The identification of these at-risk patients may help to target appropriate interventions for preventing these re-admissions.
Box 1 – Characteristics of 848 older patients hospitalised for diabetes, according to whether they were re-admitted to hospital within 30 days of discharge
No re-admission |
30-day re-admission |
Unadjusted odds ratio (95% CI) |
P |
||||||||||||
Number of patients |
639 |
209 |
|||||||||||||
Demographic data |
|||||||||||||||
Age category |
|||||||||||||||
≤ 85 years old |
309 (48.4%) |
114 (54.5%) |
Reference |
||||||||||||
> 85 years old |
330 (51.6%) |
95 (45.5%) |
0.78 (0.57–1.17) |
0.12 |
|||||||||||
Sex (men) |
363 (56.8%) |
132 (63.2%) |
1.31 (0.95–1.81) |
0.09 |
|||||||||||
Location of residence |
|||||||||||||||
Community |
534 (83.6%) |
180 (86.1%) |
Reference |
||||||||||||
Residential aged care |
105 (16.4%) |
29 (13.9%) |
0.85 (0.54–1.33) |
0.47 |
|||||||||||
Clinical characteristics |
|||||||||||||||
Median index LOS (IQR), days |
5 (2–11) |
6 (2–12) |
1.14 (0.85–1.36) |
0.09 |
|||||||||||
Index LOS 0–5 days |
329 (51.3%) |
101 (48.3%) |
Reference |
||||||||||||
Index LOS 6–11 days |
164 (25.6%) |
52 (24.9%) |
1.05 (0.68–1.61) |
0.85 |
|||||||||||
Index LOS > 11 days |
149 (23.2%) |
56 (26.7%) |
1.24 (0.81–1.90) |
0.29 |
|||||||||||
Median number of comorbid conditions* (IQR) |
6 (4–8) |
7 (5–8) |
0.95 (0.79–1.78) |
0.31 |
|||||||||||
0–4 comorbid conditions |
182 (28.5%) |
48 (23.0%) |
Reference |
||||||||||||
5–6 comorbid conditions |
250 (39.1%) |
89 (42.6%) |
0.92 (0.78–1.12) |
0.75 |
|||||||||||
≥ 7 comorbid conditions |
207 (32.4%) |
72 (34.5%) |
1.28 (1.08–1.53) |
0.04 |
|||||||||||
Median number of unrelated comorbid conditions (IQR) |
2 (1–3) |
2 (1–3) |
1.06 (0.98–1.17) |
0.20 |
|||||||||||
Median number of unique medicines* (IQR) |
11 (8–16) |
11 (8–17) |
0.97 (0.91–1.14) |
0.23 |
|||||||||||
1–7 unique medicines |
125 (19.6%) |
34 (16.3%) |
Reference |
||||||||||||
8–14 unique medicines |
324 (50.7%) |
106 (50.7%) |
1.13 (0.73–1.76) |
0.71 |
|||||||||||
≥ 15 unique medicines |
190 (29.7%) |
69 (33.0%) |
1.47 (1.0 –2.17) |
0.04 |
|||||||||||
Health service use |
|||||||||||||||
Median number of GP visits* (IQR) |
7 (4–11) |
8 (5–15) |
1.03 (1.02–1.04) |
0.02 |
|||||||||||
Median number of prescribers† (IQR) |
3 (2–5) |
4 (2–5) |
1.07 (1.01–1.13) |
0.02 |
|||||||||||
Median numbers of pharmacies† (IQR) |
2 (1–2) |
2 (1–3) |
1.15 (1.03–1.29) |
0.02 |
|||||||||||
Medicines review† |
49 (7.8%) |
15 (7.2%) |
0.89 (0.47–1.67) |
0.73 |
|||||||||||
General practitioner management plan† |
135 (21.2%) |
53 (25.4%) |
1.06 (0.72–1.57) |
0.78 |
|||||||||||
Specific comorbid conditions/medications* |
|||||||||||||||
Depression |
187 (29.3%) |
51 (24.4%) |
0.78 (0.54–1.13) |
0.19 |
|||||||||||
Anxiety |
73 (11.4%) |
22 (10.5%) |
0.91 (0.55–1.51) |
0.72 |
|||||||||||
Chronic respiratory disease |
174 (27.2%) |
53 (25.4%) |
0.96 (0.67–1.38) |
0.82 |
|||||||||||
Heart failure |
121 (18.9%) |
55 (26.3%) |
1.53 (1.06–2.21) |
0.02 |
|||||||||||
Dementia |
15 (2.2%) |
5 (2.4%) |
1.02 (0.37–2.84) |
0.97 |
|||||||||||
End-stage renal disease |
26 (4.1%) |
16 (7.7%) |
1.96 (1.03–3.72) |
0.04 |
|||||||||||
Cancer |
18 (2.8%) |
10 (4.8%) |
1.46 (0.62–3.43) |
0.39 |
|||||||||||
Urinary incontinence |
25 (3.9%) |
11 (5.3%) |
1.37 (0.66–2.82) |
0.40 |
|||||||||||
Non-steroidal anti-inflammatory drugs |
61 (9.5%) |
23 (11.0%) |
1.17 (0.71–1.95) |
0.54 |
|||||||||||
Oral corticosteroids |
88 (13.8%) |
36 (17.2%) |
1.36 (0.85–1.99) |
0.22 |
|||||||||||
Anti-psychotics |
41 (6.4%) |
19 (9.1%) |
1.46 (0.83–2.60) |
0.19 |
|||||||||||
Anti-diabetic medicines† |
|||||||||||||||
Median number of medicines for diabetes (IQR) |
1 (1–2) |
1 (0–2) |
0.94 (0.79–1.10) |
0.43 |
|||||||||||
Insulins and analogues (ATC code, A10A) |
162 (25.4%) |
50 (23.9%) |
0.99 (0.68–1.43) |
0.95 |
|||||||||||
Other anti-diabetic medicine (ATC code A10B) |
328 (51.3%) |
100 (47.8%) |
0.84 (0.61–1.17) |
0.30 |
|||||||||||
Insulin and other anti-diabetic |
104 (16.3%) |
27 (12.9%) |
1.02 (0.99–1.05) |
0.22 |
|||||||||||
Number of prior hospitalisations* |
|||||||||||||||
None |
269 (42.1%) |
70 (33.5%) |
Reference |
||||||||||||
1 |
169 (26.4%) |
52 (24.9%) |
1.18 (0.78–1.78) |
0.37 |
|||||||||||
2 |
106 (16.6%) |
38 (18.2%) |
1.38 (0.88–2.17) |
0.86 |
|||||||||||
> 2 |
95 (14.9%) |
49 (23.4%) |
1.98 (1.29–3.06) |
0.009 |
|||||||||||
Type of prior hospitalisations* |
|||||||||||||||
Diabetes-related admission |
37 (5.8%) |
24 (11.5%) |
1.63 (0.94–3.17) |
0.08 |
|||||||||||
Cardiovascular-related admission |
132 (20.7%) |
67 (32.1%) |
1.36 (0.89–2.05) |
0.07 |
|||||||||||
Infection-related admission |
46 (7.2%) |
25 (11.9%) |
1.09 (0.60–2.07) |
0.82 |
|||||||||||
Respiratory-related admission |
14 (2.2%) |
9 (4.3%) |
0.94 (0.30–2.90) |
0.92 |
|||||||||||
ATC = Anatomic Therapeutic Chemical classification system; LOS = length of stay. * During the 6 months before hospitalisation. † During the 12 months before hospitalisation. | |||||||||||||||
Box 2 – Predictors of re-admission within 30 days of a diabetes-related hospitalisation (multivariate analyses)*
Received 6 June 2016, accepted 5 September 2016
- Gillian E Caughey1
- Nicole L Pratt1
- John D Barratt1
- Sepehr Shakib2
- Anna R Kemp-Casey1,3
- Elizabeth E Roughead4
- 1 Quality Use of Medicines and Pharmacy Research Centre, University of South Australia, Adelaide, SA
- 2 Royal Adelaide Hospital, Adelaide, SA
- 3 Centre for Health Services Research, University of Western Australia, Perth, WA
- 4 University of South Australia, Adelaide, SA
No relevant disclosures.
- 1. Jiang HJ, Stryer D, Friedman B, Andrews R. Multiple hospitalizations for patients with diabetes. Diabetes Care 2003; 26: 1421-1426.
- 2. American Diabetes Association. Economic costs of diabetes in the US in 2012. Diabetes Care 2013; 36: 1033-1046.
- 3. Australian Institute for Health and Welfare. Diabetes expenditure in Australia 2008–09 (AIHW Cat. No. CVD 62). Canberra: AIHW, 2013.
- 4. Australian Institute for Health and Welfare. Cardiovascular disease, diabetes and chronic kidney disease: Australian facts: morbidity — hospital care (AIHW Cat. No. CDK 3; Cardiovascular, Diabetes and Chronic Kidney Disease Series No. 3). Canberra: AIHW, 2014.
- 5. Clinical Epidemiology and Health Service Evaluation Unit. Potentially preventable hospitalisations: a review of the literature and Australian policies. Final report. Melbourne: CEHSEU, Royal Melbourne Hospital, 2009. https://www.safetyandquality.gov.au/wp-content/uploads/2009/01/Potentially-preventable-hospitalisations-A-review-of-the-literature-and-Australian-policies-Final-Report.pdf (accessed Nov 2016).
- 6. Donzé J, Lipsitz S, Bates DW, Schnipper JL. Causes and patterns of readmissions in patients with common comorbidities: retrospective cohort study. BMJ 2013; 347: f7171.
- 7. Kansagara D, Englander H, Salanitro A, et al. Risk prediction models for hospital readmission: a systematic review. JAMA 2011; 306: 1688-1698.
- 8. Robbins JM, Webb DA. Diagnosing diabetes and preventing rehospitalizations: the urban diabetes study. Med Care 2006; 44: 292-296.
- 9. Wei NJ, Wexler DJ, Nathan DM, Grant RW. Intensification of diabetes medication and risk for 30-day readmission. Diabet Med 2013; 30: e56-e62.
- 10. RTI International. Accountable Care Organization 2015. Program analysis quality performance standards narrative measure specifications. Baltimore, Md: Centres for Medicare and Medicaid Services, 2015. https://www.cms.gov/medicare/medicare-fee-for-service-payment/sharedsavingsprogram/downloads/ry2015-narrative-specifications.pdf (accessed Jan 2015).
- 11. Epstein AM. Revisiting readmissions: changing the incentives for shared accountability. N Engl J Med 2009; 360: 1457-1459.
- 12. Jencks SF, Williams MV, Coleman EA. Rehospitalizations among patients in the Medicare fee-for-service program. N Engl J Med 2009; 360: 1418-1428.
- 13. Australian Government Department of Veterans’ Affairs. Treatment population statistics, quarterly report — June 2010. Archived: http://web.archive.org/web/20120412162854/http://www.dva.gov.au/aboutDVA/Statistics/Documents/TpopJun10.pdf (archived) (accessed Nov 2016).
- 14. Vitry AI, Roughead EE, Preiss AK, et al. Influence of comorbidities on therapeutic progression of diabetes treatment in Australian veterans: a cohort study. PLoS One 2010; 5: e14024.
- 15. Australian Government Department of Health. Australian casemix glossary [website]. May 2009. http://www.health.gov.au/internet/main/publishing.nsf/Content/health-casemix-glossary1.htm (accessed July 2016).
- 16. Chen HF, Popoola T, Radhakrishnan K, et al. Improving diabetic patient transition to home healthcare: leading risk factors for 30-day readmission. Am J Manag Care 2015; 21: 440-450.
- 17. Feltner C, Jones CD, Cené CW, et al. Transitional care interventions to prevent readmissions for persons with heart failure: a systematic review and meta-analysis. Ann Intern Med 2014; 160: 774-784.
- 18. Conroy S, Dowsing T. What should we do about hospital readmissions? Age Ageing 2012; 41: 7002-7004.
- 19. Jiang H, Stryer D, Friedman B, Andrews R. Multiple hospitalisations for patients with diabetes. Diabetes Care 2003; 26: 1421-1426.
- 20. Healy SJ, Black D, Harris C, et al. Inpatient diabetes education is associated with less frequent hospital readmission among patients with poor glycemic control. Diabetes Care 2013; 36: 2960-2967.
- 21. Krumholz HM. Pre-hospital syndrome — an acquired, transient condition of generalized risk. N Engl J Med 2013; 368: 100-102.
- 22. Conroy SP, Stevens T, Parker SG, Gladman JRF. A systematic review of comprehensive geriatric assessment to improve outcomes for frail older people being rapidly discharged from acute hospital: ‘interface geriatrics’. Age Ageing 2011; 40: 436-443.
- 23. Courtney M, Edwards H, Chang A, et al. Fewer emergency readmissions and better quality of life for older adults at risk of hospital readmission: a randomized controlled trial to determine the effectiveness of a 24-week exercise and telephone follow-up program. J Am Geriatr Soc 2009; 57: 395-402.
- 24. Graves N, Courtney M, Edwards H, et al. Cost-effectiveness of an intervention to reduce emergency re-admissions to hospital among older patients. PLoS One 2009; 4: e7455.
- 25. Roughead EE, Barratt JD, Ramsay EN, et al. The effectiveness of collaborative medicine reviews in delaying time to next hospitalisation for heart failure patients in the practice setting: results of a cohort study. Cir Heart Fail 2009; 2: 424-428.
- 26. Australian Institute of Health and Welfare. Health care usage and costs. A comparison of veterans and war widows and widowers with the rest of the community (AIHW Cat. No. PHE42). Canberra: AIHW, 2002.
Abstract
Objective: To identify factors that contribute to older Australians admitted to hospital with diabetes being re-hospitalised within 30 days of discharge.
Design, setting and participants: A retrospective cohort study of Department of Veterans’ Affairs administrative data for all patients hospitalised for diabetes and discharged alive during the period 1 January – 31 December 2012.
Main outcome measures: Causes of re-hospitalisation and prevalence of clinical factors associated with re-hospitalisation within 30 days of discharge.
Methods: Multivariate logistic regression analysis (backward stepwise) was used to identify characteristics predictive of 30-day re-hospitalisation.
Results: 848 people were hospitalised for diabetes; their median age was 87 years (interquartile range, 77–89 years) and 60% were men. 209 patients (24.6%) were re-hospitalised within 30 days of discharge, of whom 77.5% were re-admitted within 14 days of discharge. 51 re-hospitalisations (24%) were for diabetes-related conditions; 41% of those re-admitted within 14 days had not seen their general practitioner between discharge and re-admission. Factors predictive of re-hospitalisation included comorbid heart failure (adjusted odds ratio [aOR], 1.49; 95% confidence interval [CI], 1.03–2.17; P = 0.036), numbers of prescribers in previous year (aOR [for each additional prescriber], 1.06; 95% CI, 1.01–1.08; P = 0.031), and two or more hospitalisations in the 6 months before the index admission (aOR, 1.79; 95% CI 1.15–2.78; P = 0.009).
Conclusion: Older people hospitalised for diabetes who have comorbid heart failure, multiple recent hospitalisations, and multiple prescribers involved in their care are at greatest risk of being re-admitted to hospital within 30 days. Targeted follow-up during the initial 14 days after discharge may facilitate appropriate interventions that avert re-admission of these at-risk patients.