


The known Most investigations of the benefits of physical activity for health have used self-reported measures of physical activity of limited validity. As a large proportion of people admitted to Australian hospitals are over 55, quantifying the factors that influence their need for hospital care is important.
The new An increase in step count from 4500 to 8800 steps per day was associated with 0.36 fewer hospital bed-days per person per year.
The implications Health interventions and urban design features that encourage walking could have a substantial effect on the need for hospital care, and should be features of health policy.
Epidemiologic evidence strongly suggests that increased levels of physical activity are associated with the reduced incidence, prevalence and mortality of a range of diseases.1 Its impact on the use of health services, however, is not well studied. With an ageing and largely inactive population putting increased pressure on inpatient hospital services, it is important to understand the extent to which increased physical activity might reduce the number of hospital admissions. The direct health care costs for Australia of physical inactivity were estimated to be $377 million in 2000, but this figure was based on population-related risks for a range of diseases, rather than assessment of the actual use of services.2
Data on hospital admissions for particular diseases are available; for example, for patients in Denmark with chronic obstructive pulmonary disease the risk of hospital admission over the subsequent 12 years was 28% lower for those who reported any physical activity than for patients who reported no activity.3 In another study, the risk of hospital admission for women with venous thrombo-embolism was 24% lower in those walking more than 5 hours a week than for those who walked less than one hour per week.4
Health care costs have also been studied; for example, in a large community-based sample of Canadians over 65 years of age, the self-reported health care costs for people who met physical activity guidelines were CAN$1214 (60%) lower over the following 12 months than for those who were inactive.5 Similar results were found in Japan, with 12-month health care costs £174 (13%) lower for those walking one hour a day than for people who did not.6 Contrasting findings were made in the younger National Health and Nutrition Examination Survey (NHANES) sample in the United States (average age, 45 years), for whom there was no association between self-reported physical activity and total health expenditure in the following year.5,7
Only one previous study has investigated associations between objectively measured physical activity and subsequent health service use. A United Kingdom cohort of 240 people (average age, 78 years) wore accelerometers for a week and was followed for an average of almost 5 years. The incidence of unplanned hospitalisation was 2.13 times higher in those with low levels than in people with higher daily levels of moderate to vigorous physical activity (mean, 3 v 39 minutes), and 1.81 times higher in those with low daily step counts than in people with high counts (mean, 2100 v 7100 steps). There was also an inverse association with the number of prescriptions written, but not for the number of general practice consultations or referrals to specialist care.8 The question of reverse causation was not investigated: the possibility that, rather than physical activity improving health, illness causes people to be less active.
Research into population-wide physical activity has been hampered by the low validity of self-reported measures, so that more recent published research has favoured objective measurement with pedometers, accelerometers, and metabolic methods.
We enrolled people over the age of 55 years in a cohort study during 2004–2007, collecting a wide range of data on baseline variables, including step counts. This was the first cohort of more than 1000 people for whom data on an objective measure of physical activity at baseline were collected, giving us a unique opportunity to examine the effect of baseline step counts on hospital use in subsequent years.
Methods
The Hunter Community Study includes a cohort of community-dwelling men and women aged 55–85 years who reside in Newcastle, New South Wales. Participants were randomly selected from the NSW state electoral roll and contacted between December 2004 and December 2007. Listing on the electoral roll is compulsory in Australia, and it is estimated to be 93.6% complete.9 A modified Dillman recruiting strategy10 was applied. Two letters of introduction and an invitation to participate were posted to the selected candidates; individuals who did not respond to the initial letters were telephoned by a research assistant if a publicly listed number was available. If contact was not established after five attempts, the individual was classified as a non-responder. People who could not speak English or were living in residential aged care facilities were excluded.
After providing consent, participants were asked to complete two questionnaires and to return them when they attended a data collection clinic, at which a series of clinical assessments was undertaken. Consent from participants was also sought at this time to link personal information obtained during the study with Medicare data (Medicare and Pharmaceutical Benefits Scheme) and local hospital databases. A package of three further questionnaires, to be returned by reply-paid post, was given to participants to complete at home after their clinical assessment. Administering the questionnaires in segments before and after the clinical phase aimed to reduce the burden for respondents and to thereby maximise attendance for clinical assessments.
Step count was recorded over a week by a pedometer (Yamax) worn during waking hours, and participants recorded the daily step count in a diary. In 2004–2007, there was little community awareness of step count targets, and no guidance was given as to how many steps constituted a healthy amount of activity. The pedometer was worn on the waist belt, in line with either leg. Days with less than 9 hours’ wear were excluded from analysis, and a daily average count was calculated for participants with at least 3 days of wear.
Hospital admissions for the 2623 people who consented to record linkage were retrieved from both public and private hospitals. All hospital admissions in NSW are coded by professional hospital coders using the International Classification of Diseases, version 10 (ICD-10), with a first position code for the principal reason for admission and up to ten other codes for comorbidities. We chose bed-days rather than admissions as the outcome measure because it more accurately reflects health care costs, and physical activity could conceivably influence the severity as well as the incidence of disease.
Statistical methods
Baseline demographic information for the analysis population (all those with complete pedometry, hospital admissions and relevant clinical and demographic data) was summarised as means and standard deviations for continuous variables and as frequencies and percentages for categorical variables. The distributions of these variables were compared with the NSW 2006 census population aged 55–85 years (where available) in χ2 tests.
For each consenting participant, we estimated the number of hospital bed-days from enrolment in the study to 31 March 2015, based on data in the admitted patient database. The number of days in hospital was defined according to the admission and discharge dates, initially for all admissions, and then stratified by ICD-10 and procedural codes, allowing us to determine cancer-, diabetes- and cardiovascular disease (CVD)-specific hospital separations. Private hospital follow-up time was excluded for CVD-related admissions because data were missing for some years.
We initially analysed the total number of bed-days after recruitment, and then performed a sensitivity analysis that excluded data for the first 2 years of follow-up, in order to examine the effect of reverse causality.
To determine the appropriate set of confounding variables for estimating the effect of physical activity on the number of hospital admissions, we constructed a directed acyclic graph (online Appendix). The following variables were deemed sufficient: age at the baseline survey, sex, number of medications, number of comorbidities (angina, asthma, heart attack, osteo-arthritis, rheumatoid arthritis, stroke, diabetes, elevated cholesterol levels, thyroid conditions, depression or anxiety, atrial fibrillation, bronchitis or emphysema, cancer), smoking status (never, former or current smoker), level of alcohol consumption (never drink, safe, moderate, hazardous/binge, hazardous/chronic, unknown), and most advanced level of education.
A negative binomial regression model was used, with number of hospital bed-days as the outcome, log length of follow-up as an offset, and step counts, education level, sex, number of comorbidities, number of medications, smoking status, and alcohol consumption included as independent variables. In the models for disease-specific bed-days, the number of participants with no bed-days was high, so a zero-inflated negative binomial model was employed for these analyses. Incidence rate ratios are presented with Wald 95% confidence intervals [CIs], P values, and least squares mean estimates for number of bed-days at the lower quartile, median, and upper quartile boundaries for step counts. Goodness of fit was assessed by visually inspecting estimates of observed and model-predicted bed-days, and plots of deviance residuals v independent variables. All analyses were conducted in Stata 13.1 (StataCorp).
Ethics approval
Ethics approval was granted by the University of Newcastle Human Research Ethics Committee (reference, H-820-0504a).
Results
Invitation letters were sent to 9784 individuals randomly selected from the electoral roll. Of the 7575 subjects who responded, either in person or through a relative, 258 were ineligible (148 did not speak English, 92 had subsequently died, 18 had moved to an aged care institution); 3440 refused and 3877 agreed to participate. A total of 3253 people actually participated, giving a response rate of 44.5% of eligible responders. The participant group reflected the Australian population aged 55–85 years in terms of sex and marital status, but was slightly younger. Further details of recruitment and the representativeness of the sample have been published elsewhere.11
Valid step count data were recorded for 2458 participants, of whom 2174 had consented to record linkage. The baseline number of medications was not well reported (20% missing data), so this variable was omitted from further analyses. We present a complete case analysis of the data for the 2110 participants for whom complete data on all variables of interest were available (Box 1).
Compared with the NSW population aged 55–85 years in 2006, the proportion of participants who did not drink alcohol was similar; more had a university or trade qualification, fewer were smokers, and there was a statistically significant different age distribution.
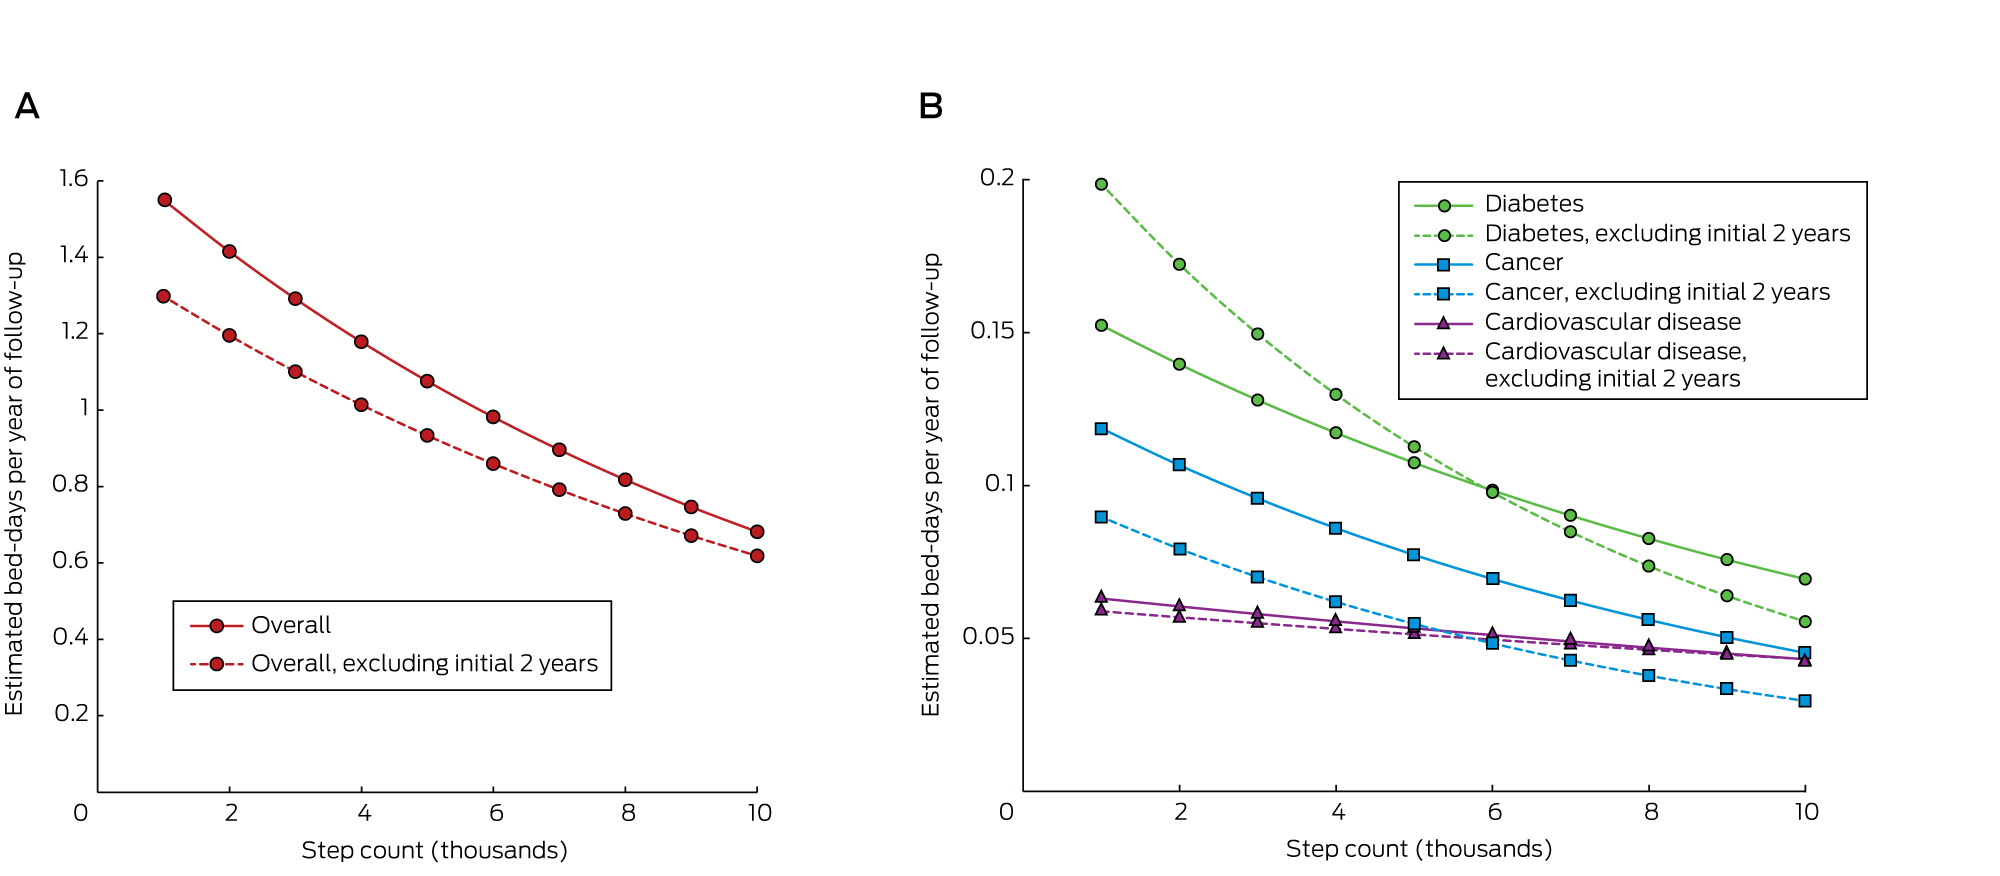
The total number of person-years followed up was 17 374 (excluding the first 2 years, 13 514 person-years), with a mean of 8.2 years (range, 7.0–11.1 years). The median daily step count was 6.6k steps (k = 1000; interquartile range, [IQR], 4.5k–8.8k steps); 1% of participants had step counts greater than 16.4k, and the maximum value was 23.9k. The median overall time in hospital was 2 days (IQR, 0–9 days); 1% of participants spent more than 135 days in hospital, and the maximum stay was 384 days. Excluding the first 2 years of follow-up, the median time in hospital was 0 days (IQR, 0–5 days; maximum, 294 days). The number of bed-days of hospital care associated with particular diseases is shown in Box 2.
Association between step count and number of bed-days
The average number of bed-days per year for people at the 25th percentile step count was 1.12, for those at the 75th percentile it was 0.76, a difference of 0.36 bed-days, or 32%. After excluding the first 2 years’ follow-up, the average number of bed-days per year for people at the 25th percentile step count was 0.97, while for those at the 75th percentile it was 0.68, a 30% reduction (Box 3).
After adjusting for potential confounders, the overall estimated number of bed-days per year of follow-up decreased by 9% for each 1000-step increase in daily step count (95% CI, –10% to –6%; P < 0.001). A higher step count was found to be associated with fewer bed-days for cancer and diabetes, but not for CVD (Box 3). Estimated bed-days for step counts in the range 1k–10k are shown in Box 4.
A sensitivity analysis was conducted to explore the effect of outliers. Models were re-run after exclusion of the top 1% of values for bed-days and step counts. The results were essentially similar, but the benefit for patients with cancer was no longer statistically significant (data not shown).
Discussion
We report the first investigation of the association between objectively measured physical activity and hospital use over an extended follow-up period. People taking 8800 steps per day (the 75th percentile boundary) spent almost one-third of a day less in hospital per year of follow-up than people taking 4500 steps per day (the 25th percentile boundary). The estimated difference was slightly smaller (0.29 days) when the first 2 years of follow-up were excluded, and we regard this smaller figure as the best estimate of the causal effect. This difference equates to a 30% lower requirement for hospital care being associated with 4300 extra steps per day, or about 40 minutes of walking.
While the effect of step count on cancer and diabetes admissions data was significant, we were surprised to find no significant effect on CVD admissions; this anomaly may be related to the fact that data for CVD admissions in the private sector were missing.
The strengths of our study included the large community-based sample, our adjustment for appropriate confounders, the extended follow-up, and complete ascertainment of hospital admissions from NSW hospital records. The response rate with respect to recruitment was only 22%, but the sample was nevertheless reasonably representative of the NSW population. Potential weaknesses included the possibility of residual reverse causality, even after removing the first 2 years’ follow-up and adjusting for the number of diagnoses at baseline. Our analysis assumes that the week of step counts recorded at baseline was typical for the participant’s usual activity. There is also an inherent limitation in the use of step counters to record overall physical activity, as they do not capture, for instance, swimming or cycling, nor do they record the intensity of activity. They do, however, capture all movement throughout the day, and we have previously shown that step counts have greater validity than a self-reported physical activity scale.12
The cost of a day in hospital in Australia in 2012–13 was $1895,13 so $550 can potentially be saved annually for each person who increases their physical activity by an achievable 4300 steps per day. These steps can be accumulated as many brief activities throughout the day, or as steady walking for about 3 kilometres. Previous investigation of the dose–response curves for various health indicators in older people has shown that the steepest part of the curve is at the lower end of activity.14 Moving from 3000 to 5000 steps per day is of greater benefit than moving from 8000 to 10 000 steps.
Health implications
Our estimates of the hospital care burden associated with varying levels of physical activity suggest that large reductions in hospital use may be possible with measures that increase community physical activity levels, such as health coaching, restricting parking availability, and better urban design.
Box 1 – Baseline characteristics for the 2110 participants, compared with those of the standard New South Wales population aged 55–85 years (2006)
Characteristic |
Participants |
NSW population* |
P (χ2) |
||||||||||||
Age (years), mean (SD) |
66.1 (7.4) |
||||||||||||||
Age group |
< 0.001 |
||||||||||||||
55–59 years |
472 (22.4%) |
26.6% |
|||||||||||||
60–64 years |
541 (25.6%) |
21.0% |
|||||||||||||
65–69 years |
436 (20.7%) |
16.8% |
|||||||||||||
70–74 years |
317 (15.0%) |
13.9% |
|||||||||||||
75–79 years |
229 (10.9%) |
12.4% |
|||||||||||||
80–84 years |
115 (5.5%) |
9.3% |
|||||||||||||
Sex (men) |
1026 (48.6%) |
47.5% |
0.31 |
||||||||||||
Medications, median number (IQR) |
3 (2–5) |
||||||||||||||
Comorbidities, median number† (IQR) |
2 (1–3) |
||||||||||||||
Smoker |
|||||||||||||||
Never |
1170 (55.5%) |
||||||||||||||
Former |
805 (38.2%) |
||||||||||||||
Current |
135 (6.4%) |
10.9% |
< 0.001 |
||||||||||||
Alcohol consumption |
|||||||||||||||
Teetotaller |
590 (28.0%) |
29.7% |
0.088 |
||||||||||||
Safe drinker |
979 (46.4%) |
||||||||||||||
Moderate drinker |
151 (7.2%) |
||||||||||||||
Hazardous drinker/binge |
124 (5.9%) |
||||||||||||||
Hazardous drinker/chronic |
96 (4.6%) |
||||||||||||||
Unknown |
170 (8.1%) |
||||||||||||||
Education level |
|||||||||||||||
Primary schooling only |
47 (2.2%) |
||||||||||||||
Secondary schooling completed |
493 (23.3%) |
||||||||||||||
Secondary schooling not completed |
399 (18.9%) |
18.4% |
0.55 |
||||||||||||
Trade or TAFE qualification |
558 (26.5%) |
21.5% |
< 0.001 |
||||||||||||
University or other tertiary study |
490 (23.2%) |
10.5% |
< 0.001 |
||||||||||||
Other or not applicable |
123 (5.8%) |
||||||||||||||
TAFE = Technical and Further Education college. * Data generated in TableBuilder (http://www.abs.gov.au/websitedbs/censushome.nsf/home/tablebuilder). † Of the 13 conditions listed in the Methods. | |||||||||||||||
Box 2 – Number of hospital bed-days for the 2110 participants, and proportions of bed-days associated with cardiovascular disease, cancer and diabetes
Number of bed-days |
Proportion |
||||||||||||||
Overall |
|||||||||||||||
All follow-up |
28 876 |
||||||||||||||
Excluding initial 2 years |
20 172 |
||||||||||||||
Cardiovascular disease |
|||||||||||||||
All follow-up |
1747 |
6.1% |
|||||||||||||
Excluding initial 2 years |
1353 |
6.7% |
|||||||||||||
Cancer |
|||||||||||||||
All follow-up |
1794 |
6.2% |
|||||||||||||
Excluding initial 2 years |
1174 |
5.8% |
|||||||||||||
Diabetes |
|||||||||||||||
All follow-up |
5528 |
19.1% |
|||||||||||||
Excluding initial 2 years |
4107 |
20.4% |
|||||||||||||
Box 3 – Association of step count with number of bed-days, and estimated bed-days per year of follow-up (least squares means) for specific step count levels*
Incidence rate ratio (95% CI) per extra 1k steps |
P |
Estimated bed-days per year of follow-up (95% CI) |
|||||||||||||
Q14.5k steps |
Median6.6k steps |
Q38.8k steps |
|||||||||||||
Overall |
|||||||||||||||
All follow-up |
0.91 (0.90–0.94) |
< 0.001 |
1.12 (1.00–1.30) |
0.93 (0.84–1.00) |
0.76 (0.68–0.85) |
||||||||||
Excluding initial 2 years |
0.92 (0.90–0.95) |
< 0.001 |
0.97 (0.84–1.10) |
0.82 (0.72–0.91) |
0.68 (0.60–0.80) |
||||||||||
Cardiovascular disease |
|||||||||||||||
All follow-up |
0.96 (0.91–1.00) |
0.096 |
0.054 (0.04–0.07) |
0.05 (0.04–0.06) |
0.045 (0.03–0.06) |
||||||||||
Excluding initial 2 years |
0.97 (0.91–1.03) |
0.27 |
0.052 (0.03–0.07) |
0.049 (0.03–0.07) |
0.045 (0.03–0.06) |
||||||||||
Cancer |
|||||||||||||||
All follow-up |
0.90 (0.83–0.98) |
0.012 |
0.082 (0.05–0.11) |
0.065 (0.04–0.09) |
0.05 (0.03–0.07) |
||||||||||
Excluding initial 2 years |
0.88 (0.80–0.96) |
0.005 |
0.058 (0.03–0.08) |
0.045 (0.03–0.06) |
0.034 (0.02–0.05) |
||||||||||
Diabetes |
|||||||||||||||
All follow-up |
0.92 (0.86–0.98) |
0.013 |
0.11 (0.07–0.15) |
0.09 (0.06–0.13) |
0.08 (0.04–0.11) |
||||||||||
Excluding initial 2 years |
0.87 (0.80–0.94) |
0.001 |
0.12 (0.07–0.17) |
0.09 (0.05–0.13) |
0.07 (0.03–0.10) |
||||||||||
Q1 = first quartile; Q3 = third quartile. * After correction for age, sex, number of medications, number of comorbidities, smoking and alcohol status, and education level. | |||||||||||||||
Received 30 May 2016, accepted 7 September 2016
- Ben D Ewald1
- Christopher Oldmeadow1
- John R Attia1,2
- 1 Centre for Clinical Epidemiology and Biostatistics, University of Newcastle, Newcastle, NSW
- 2 John Hunter Hospital, Newcastle, NSW
No relevant disclosures.
- 1. Brukner PD, Brown WJ. Is exercise good for you? Med J Aust 2005; 183: 538-541. <MJA full text>
- 2. Stephenson J, Baumann A, Armstrong T, et al. The costs of illness attributable to physical inactivity in Australia. A preliminary study [report]. Canberra: Commonwealth Department of Health and Aged Care, 2000. https://www.health.gov.au/internet/main/publishing.nsf/Content/5F2C0F157D587DAECA257BF0001E44CE/$File/phys_costofillness.pdf (accessed Sept 2016).
- 3. Garcia-Aymerich J, Lange P, Benet M, et al. Regular physical activity reduces hospital admission and mortality in chronic obstructive pulmonary disease: a population-based cohort study. Thorax 2006; 61: 772-778.
- 4. Armstrong M, Cairns B, Green J. Association between reported baseline physical activity and hospital admission for [venous] thromboembolism in a prospective cohort study. Eur J Epidemiol 2013; 28 (Suppl): s23-s24.
- 5. Wollcott J, Ashe M, Miller W, et al. Does physical activity reduce seniors need for health care? A study of 24 281 Canadians. Br J Sports Med 2010; 44: 902-904.
- 6. Tsuji I, Takahashi K, Nishino Y, et al. Impact of walking upon medical care expenditure in Japan: the Ohsaki Cohort Study. Int J Epidemiol 2003; 32: 809-814.
- 7. Chevan J, Roberts D. No short term saving in health care expenditures for physically active adults. Prev Med 2014; 63: 1-5.
- 8. Simmonds B, Fox K, David M, et al. Objectively assessed physical activity and subsequent health service use of UK adults aged 70 and over: a four to five year follow up study. PLoS One 2014; 9: e97676.
- 9. Australian Electoral Commission. Annual report 2006–07. Canberra: AEC, 2007. http://annualreport.aec.gov.au/files/aec-annual-report-2006-07.pdf (accessed Sept 2016).
- 10. Hoddinott SN, Bass MJ. The Dillman Total Design Survey Method: a sure-fire way to get high survey return rates. Can Fam Physician 1986; 32: 2366-2368.
- 11. McEvoy M, Smith W, D’Este K, et al. Cohort profile: the Hunter Community Study. Int J Epidemiol 2010; 39: 1452-1463.
- 12. Ewald B, McEvoy M, Attia J. Step counts superior to physical activity scale for identifying health markers in older adults. Br J Sports Med 2010; 44: 756-761.
- 13. Independent Hospital Pricing Authority. National Hospital Cost Data Collection. Australian public hospitals cost report 2012–13, round 17. Commonwealth of Australia, 2015. https://www.ihpa.gov.au/sites/g/files/net636/f/publications/nhcdc_cost_report_2012-2013_round_17_0.pdf (accessed Sept 2016).
- 14. Ewald B, Attia J, McElduff P. How many steps are enough? Dose–response curves for pedometer steps and multiple health markers in a community-based sample of older Australians. J Phys Act Health 2014; 11: 509-518.
Abstract
Objectives: To determine the extent to which physical activity reduces the number of hospital bed-days for Australians over 55, using an objective measure of activity.
Design, setting and participants: 9784 Newcastle residents aged 55 years or more were invited to participate. 3253 responders were eligible and wore pedometers for one week during 2005–2007; their hospital data from recruitment to 31 March 2015 were analysed (mean follow-up time: 8.2 years). Complete data for 2110 people were available for analysis.
Main outcome measures: Mean annual hospital bed-days, according to individual step count.
Results: There was a statistically significant reduction in the number of hospital bed-days associated with higher step counts; the incidence rate ratio per extra 1000 steps per day at baseline was 0.91 (95% CI, 0.90–0.94). The disease-specific reductions were significant for admissions for cancer and diabetes, but not for cardiovascular disease. The difference between 4500 and 8800 steps per day (the upper and lower quartile boundaries for step count) was 0.36 bed-days per person per year, after adjusting for age, sex, number of medications, number of comorbidities, smoking and alcohol status, and education. When analysis was restricted to hospital admissions after the first 2 years of follow-up, the difference was 0.29 bed-days per person per year.
Conclusions: More active people require less hospital care, and an achievable extra 4300 steps per day would result in an average of one less day in hospital for each 3 years of life.