


The known Transitions of care, such as discharge from hospital, are points of increased risk for errors in medication management. Medication errors are common in discharge summaries in Australia.
The new Pharmacists completing medication management plans in the discharge summary significantly reduced the rate of medication errors (including errors of high and extreme risk) in discharge summaries for general medical patients.
The implications Pharmacist input into the discharge plan should be more widely adopted. However, for maximum effect, this requires integrating clinical pharmacists into the team structures of all medical units.
Patients admitted to general medical units (GMUs) often have complex histories, including multiple comorbidities, polypharmacy, and being at risk for drug-related problems associated with increased morbidity and mortality.1-3 Transitions of care, such as discharge from hospital, have been identified as points of increased risk for errors in medication management4-6 that may contribute to adverse events and affect continuity of care.7 Suboptimal medication management during or immediately after hospitalisation is a risk factor in 28% of potentially avoidable re-admissions within 30 days of discharge.8
Several Australian studies have identified that medication errors are common in discharge summaries. In a 2010 retrospective analysis of 966 handwritten and 842 electronically generated discharge summaries prepared by an Australian metropolitan hospital, 12.1% of handwritten and 13.3% of electronic summaries contained medication errors. The most common error was omission of a medication, and the highest number of errors involved cardiovascular drugs. Error rates were not affected by whether the discharge summary was written by an intern, resident medical officer or registrar.9
In a general practice audit of hospital discharge summaries in Melbourne in 2013, a high proportion (92%) of discharge summaries had been received by the general practitioner, but complete lists of discharge medications were included in only 24% of discharge summaries; 44% included no details about medications.10
Audit data at our institution indicated that medication errors in the electronic discharge summaries were common. In response, a workforce model was developed that allowed pharmacists to complete the medication management plan for the medical discharge summary, with a full list of the patient’s medications, including any medications commenced during the admission (with indications), withdrawn or changed medications (with explanations), and any known adverse drug reactions. Prior to the implementation of this new model, the clinical pharmacy service to the GMU was already extensive, providing a 7-day, extended hours service, and a pharmacist was involved in all discharges during working hours.
The aim of our study was to evaluate whether pharmacists completing a medication management plan in the electronic discharge summary for patients discharged from an inpatient admission to the GMU was beneficial. At our institution, the electronic discharge summary is completed for all patients at the time of discharge from hospital and electronically transmitted to the patient’s general practitioner. We conducted a cluster randomised, controlled trial to compare error rates in medication management plans completed by pharmacists with those for standard medical discharge summaries, to determine whether involving a pharmacist in preparing the plan might be an effective strategy for reducing medication errors.
Methods
Trial design
This unblinded, cluster randomised, controlled trial was conducted in the GMU at the Alfred Hospital, an adult major referral hospital in metropolitan Melbourne with an annual emergency department attendance of about 60 000 patients. The GMU receives about 4500 admissions each year, predominantly through the emergency department.
Participants
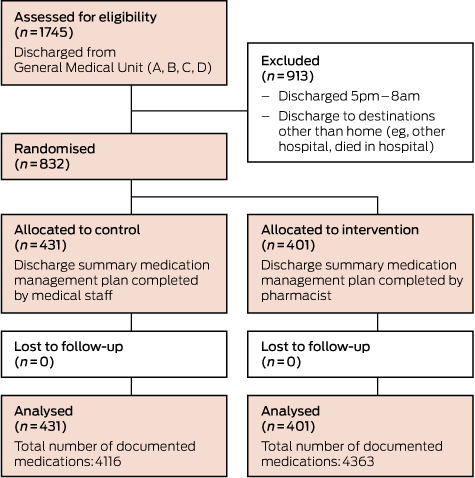
We evaluated patients’ discharge summaries written during the period 16 March 2015 – 27 July 2015. Only patients discharged during the pharmacists’ working hours (8 am–5 pm, 7 days a week) were included. Patients were excluded if they were transferred to another hospital or died during the inpatient admission.
The GMU is divided into four geographical subunits with equivalent rostering of clinicians and admitting days. Admitted patients are allocated to teams according to bed availability in the subunits. There were no differences in the number or seniority of staff in the four subunits. Patients in two GMU subunits received discharge summaries with medication management plans completed by a pharmacist (intervention group); patients in the other two subunits received standard medical discharge summaries completed by medical officers of the relevant teams (control group). The subunits were randomly assigned to the intervention or control arms by the primary investigator, using a random number generator.
Outcomes
The primary outcome was a discharge summary with a medication error identified by an independent assessor. The assessor was not blinded to whether the discharge summary was written by a pharmacist or medical officer, and was not involved in the patient’s admission. Errors identified were classified as an omitted drug, an incorrect dose or dose frequency, an incorrect or unnecessary drug, or an incorrect route of administration.
Secondary outcome measures were the proportions of the types of errors and the proportions of extreme or high risk errors. All errors identified were reviewed and assigned a risk rating by a blinded independent expert panel comprising a general physician, an emergency physician and a senior clinical pharmacist. The panel used a previously validated consequence/probability matrix to review the errors.11 The matrix required the panel to agree on the probability of a scenario occurring and the likelihood that the associated consequence would ensue. Errors were classified on an ordinal severity scale of 1–5 (corresponding to insignificant risk, low risk, moderate risk, high risk, and extreme risk).
Statistical analysis
Normally distributed continuous data are presented as means (with standard deviations), ordinal and skewed data as medians (with interquartile ranges). P < 0.05 was deemed statistically significant. The statistical significance of differences in proportions was determined in cluster-weighted χ2 tests or, if the value in a cell was less than 5, Fisher exact tests.12 Differences in the primary outcome are presented as the risk of an error and the number needed to treat (NNT) to prevent one error. The statistical significance of differences in means was evaluated in Student t tests, of differences in medians in Wilcoxon rank sum tests.
For the sample size calculation, it was assumed that the proportion of patients with a standard medical chart including an error was 0.30 (based on previous audits), and we aimed to detect a minimum clinically significant absolute difference of 0.10. With 90% power and α = 0.05 (two-sided), the total sample size required was 824 people, with 412 in each arm and 206 patients in each cluster. The inter-cluster correlation coefficient was expected to be very small (approaching zero) and an adjustment for the design effect was not made. All analyses were conducted in Stata 12.0 (StataCorp).
Ethics approval
The study was approved by the Alfred Hospital Research and Ethics Committee (reference, 539/14).
Results
During the study period, 1745 patients were discharged from the GMU. Of these, 832 patients were included in the study (Box 1). No patients were lost to follow-up. Patient demographics and clinical characteristics were similar in the two groups (Box 2). The total number of medications documented in the discharge summaries was 4363 in the intervention arm and 4116 in the control arm.
Of the 431 patients who received standard medical discharge summaries during the study period, 265 (61.5%) received summaries in which at least one medication error was identified, compared with 60 patients (15%) who received discharge summaries completed by pharmacists that included at least one error (P < 0.01). The absolute risk reduction was 46.5% (95% confidence interval [CI], 40.7–52.3%), yielding an NNT of 2.2 (95% CI, 1.9–2.5) to prevent one discharge summary containing at least one medication error. The absolute risk reduction for a discharge summary containing a high or extreme risk error was 9.6% (95% CI, 6.4–12.8%), with an NNT of 10.4 (95% CI, 7.8–15.5).
In the standard medical discharge summary arm, 54 patients (12.5%) had summaries with two identified medication errors, compared with 13 patients (3.2%) in the intervention arm. In the control arm, 40 patients (9.3%) had summaries including three errors, 21 patients (4.9%) summaries with four errors, and 57 patients (13.2%) summaries with five or more errors, compared with one patient (0.2%), one patient (0.2%) and four patients (1%) respectively in the intervention arm (P < 0.01; Box 3). In both arms, the most commonly identified errors were omitted drugs and incorrect dosing frequencies (Box 4).
An example of an identified error is oxycodone being listed as a new medication in the discharge summary for a patient with concomitant anxiety and ethanol misuse admitted to hospital for treatment of thoracic back pain, although opioids were only to be used during their hospital stay. Other examples include medications ceased during the acute hospital admission that were listed in the discharge summary as current medications (eg, warfarin use in the setting of recurrent falls, spironolactone use in the setting of acute kidney injury, telmisartan use in a patient with hypotension).
Discussion
A workflow model in which pharmacists completed the medication management plan was effective in reducing the rate of medication errors when compared with standard medical discharge summaries. The model was also effective in reducing the rates of extreme and high level errors that may be associated with morbidity and mortality.
This model has the ability to reduce iatrogenic morbidity, as pharmacists can focus on medication reconciliation throughout a patient’s hospital stay with greater attention and accuracy than other medical staff members. The release of the patient from hospital is a high risk scenario with regard to clinical handover because, in contrast to situations in which information is transferred between clinicians verbally, information is usually transmitted at discharge in the form of a written summary. The Australian Commission on Safety and Quality in Health Care has developed an electronic discharge summary systems self-evaluation toolkit for health services, and has identified that key problems with discharge summaries include the inaccurate recording of information and the omission of material important for the patient’s safety and wellbeing.13 In a study conducted in Canada, doctors in primary health care settings rated comprehensive medication information as the third most important component of the discharge summary, after discharge and admission diagnosis.14 Electronic linking of patients’ health records may improve the communication between the hospital and community settings in the future, but medication lists automatically generated by a prescribing system would not include many of the necessary components of a medication plan that need to be communicated to the next health care provider. Having the pharmacist complete the medication management plan reduces the risk of medication errors in environments where discharge summaries are typically completed by the most junior doctor in the medical team.
The timing of our study was selected to allow adequate orientation of junior medical staff following the major annual rotation of hospital medical officers in Australia, as the effect of this rotation on patient care has been documented.15 The limitations of our study include the fact that it was conducted at a single site, and at an institution with an integrated and advanced clinical pharmacy service within the GMU. The clinicians identifying errors were not blinded to the study groups, but a blinded multidisciplinary expert panel retrospectively reviewed each error to assign risk ratings. In addition, patients discharged outside pharmacists’ working hours were excluded from the study; however, the clinical pharmacy service in the GMU at our institution is a 7-day service, and less than 5% of patients were discharged outside its operating hours.
Medical staff members with the responsibility of generating discharge correspondence have many competing demands, one of which is to accurately document medication lists. While it is essential to emphasise the importance of accurate medication lists in discharge letters to all medical staff members, our study indicates that medication records should be the responsibility of specialist clinical pharmacists.
The process of pharmacists completing the medication plan in the electronic medical discharge summary has now been implemented as routine care across the majority of clinical units in the Alfred Hospital. The results of our study indicate that pharmacist input into the discharge plan should be more widely adopted. However, to be maximally effective, this requires integrating clinical pharmacists into the team structure of all medical units, and this is not currently standard in all Australian hospitals.
Conclusion
We found that pharmacists completing medication management plans in the electronic medical discharge summary significantly reduced the number of medication errors (including errors of high and extreme risk) in discharge summaries for general medical unit patients.
Box 2 – Demographic and clinical characteristics of the study population
|
Variable |
Medical discharge summaries |
Pharmacist discharge summaries |
|||||||||||||
|
|
|||||||||||||||
|
Number of patients |
431 |
401 |
|||||||||||||
|
Age (SD), years |
72.5 (18.6) |
74.1 (16.2) |
|||||||||||||
|
Sex (men) |
214 (49.7%) |
197 (49.1%) |
|||||||||||||
|
Total number of documented medications |
4116 |
4363 |
|||||||||||||
|
Number of regular medications, median (IQR) |
8 (5–12) |
9 (6–12) |
|||||||||||||
|
Number of pro re nata medications, median (IQR) |
1 (0–2) |
1 (0–2) |
|||||||||||||
|
Australasian Triage Scale (ATS) category |
|
|
|||||||||||||
|
ATS 1 |
5 (1.2%) |
3 (0.7%) |
|||||||||||||
|
ATS 2 |
66 (15.3%) |
62 (15.5%) |
|||||||||||||
|
ATS 3 |
219 (50.8%) |
202 (50.4%) |
|||||||||||||
|
ATS 4 |
100 (23.2%) |
98 (24.4%) |
|||||||||||||
|
ATS 5 |
2 (0.5%) |
5 (1.2%) |
|||||||||||||
|
Not supplied |
39 (9.0%) |
31 (7.7%) |
|||||||||||||
|
Past history |
|
|
|||||||||||||
|
Myocardial infarction |
71 (16.5%) |
64 (15.5%) |
|||||||||||||
|
Congestive cardiac failure |
110 (25.5%) |
100 (24.9%) |
|||||||||||||
|
Cerebrovascular disease |
69 (16.0%) |
59 (14.7%) |
|||||||||||||
|
Dementia |
43 (10.0%) |
50 (12.5%) |
|||||||||||||
|
Chronic obstructive pulmonary disease |
83 (19.3%) |
72 (18.0%) |
|||||||||||||
|
Connective tissue disorder |
32 (7.4%) |
28 (7.0%) |
|||||||||||||
|
Liver disease, mild |
22 (5.1%) |
21 (5.2%) |
|||||||||||||
|
Liver disease, moderate to severe |
3 (0.7%) |
6 (1.5%) |
|||||||||||||
|
Diabetes, uncomplicated |
82 (19.0%) |
84 (20.9%) |
|||||||||||||
|
Diabetes, complicated |
46 (10.7%) |
58 (14.5%) |
|||||||||||||
|
Moderate to severe kidney disease |
236 (54.8%) |
214 (53.4%) |
|||||||||||||
|
Peptic ulcer disease |
6 (1.4%) |
8 (2.1%) |
|||||||||||||
|
Peripheral vascular disease |
36 (8.3%) |
41 (10.3%) |
|||||||||||||
|
Leukaemia |
8 (1.9%) |
16 (4.0%) |
|||||||||||||
|
Malignant lymphoma |
20 (4.6%) |
12 (3.0%) |
|||||||||||||
|
Solid tumour (localised) |
76 (17.6%) |
72 (18.0%) |
|||||||||||||
|
Metastatic cancer |
60 (13.9%) |
78 (19.5%) |
|||||||||||||
|
Acquired immunodeficiency syndrome (AIDS) |
0 |
0 |
|||||||||||||
|
Charlson Comorbidity Index score, median (IQR) |
5 (3–7) |
6 (4–8) |
|||||||||||||
|
|
|||||||||||||||
|
|
|||||||||||||||
Box 3 – Primary outcome measures: numbers of errors in discharge summaries for patients in control (standard medical discharge summaries) and intervention (discharge summaries prepared by pharmacist) arms
|
|
Medical discharge summaries |
Pharmacist discharge summaries |
P |
||||||||||||
|
|
|||||||||||||||
|
Number of patients |
431 |
401 |
|
||||||||||||
|
Total number of documented medications |
4116 |
4363 |
|
||||||||||||
|
Summaries with errors |
265 (61.5%) |
60 (15.0%) |
<0.01 |
||||||||||||
|
Errors per patient |
|
|
<0.01 |
||||||||||||
|
0 |
166 (38.5%) |
341 (85.0%) |
|
||||||||||||
|
1 |
93 (21.6%) |
41 (10.2%) |
|
||||||||||||
|
2 |
54 (12.5%) |
13 (3.2%) |
|
||||||||||||
|
3 |
40 (9.3%) |
1 (0.2%) |
|
||||||||||||
|
4 |
21 (4.9%) |
1 (0.2%) |
|
||||||||||||
|
≥5 |
57 (13.2%) |
4 (1.0%) |
|
||||||||||||
|
|
|||||||||||||||
|
|
|||||||||||||||
Box 4 – Secondary outcome measures: types of errors in discharge summaries for patients in control (standard medical discharge summaries) and intervention (discharge summaries prepared by pharmacist) arms
|
|
Medical discharge summaries |
Pharmacist discharge summaries |
P |
||||||||||||
|
|
|||||||||||||||
|
Summaries with errors |
265 |
60 |
|
||||||||||||
|
Severity of error |
|
|
<0.01 |
||||||||||||
|
1 (insignificant) |
50 (18.9%) |
20 (33%) |
|
||||||||||||
|
2 (low) |
86 (32.5%) |
22 (37%) |
|
||||||||||||
|
3 (moderate) |
81 (30.6%) |
12 (20%) |
|
||||||||||||
|
4 (high) |
36 (13.6%) |
5 (8%) |
|
||||||||||||
|
5 (extreme) |
12 (4.5%) |
1 (2%) |
|
||||||||||||
|
Error types |
|
|
Not applicable |
||||||||||||
|
Omitted drug |
547 |
71 |
|
||||||||||||
|
Incorrect dose |
65 |
9 |
|
||||||||||||
|
Incorrect frequency |
211 |
13 |
|
||||||||||||
|
Incorrect/unnecessary drug |
75 |
3 |
|
||||||||||||
|
Incorrect route |
— |
— |
|
||||||||||||
|
|
|||||||||||||||
|
|
|||||||||||||||
Received 25 May 2016, accepted 17 August 2016
- Erica Y Tong1,2
- Cristina P Roman1,2
- Biswadev Mitra1,2
- Gary S Yip1
- Harry Gibbs1,2
- Harvey H Newnham1,2
- De Villiers Smit1,2
- Kirsten Galbraith2
- Michael J Dooley1,2
- 1 Alfred Health, Melbourne, VIC
- 2 Monash University, Melbourne, VIC
We acknowledge the funding for this study provided through the Workforce Innovation Grants Program by the Victorian Department of Health and Human Services. We also acknowledge the pharmacists, medical staff and nursing staff of the general medical unit and emergency short stay unit for their contributions during the study.
No relevant disclosures.
- 1. Hanlon JT, Pieper CF, Hajjar ER, et al. Incidence and predictors of all and preventable adverse drug reactions in frail elderly persons after hospital stay. J Gerontol A Biol Sci Med Sci 2006; 61: 551-555.
- 2. Hajjar ER, Cafiero AC, Hanlon JT. Polypharmacy in elderly patients. Am J Geriatr Pharmacother 2007; 5: 345-351.
- 3. Hohl CM, Dankoff J, Colacone A, Afilalo M. Polypharmacy, adverse drug-related events, and potential adverse drug interactions in elderly patients presenting to an emergency department. Ann Emerg Med 2001; 38: 666-671.
- 4. Australian Council on Safety and Quality in Health Care. Second national report on improving patient safety: improving medication safety. Canberra: ACSQHC, 2002. https://safetyandquality.gov.au/wp-content/uploads/2012/12/Second-National-Report-on-Patient-Safety-Improving-Medication-Safety.pdf (accessed May 2016).
- 5. Forster AJ, Clark HD, Menard A, et al. Adverse events among medical patients after discharge from hospital. CMAJ 2004; 170: 345-349.
- 6. Easton K, Morgan T, Williamson M. Medication safety in the community: a review of the literature. Sydney: National Prescribing Service, 2009. https://www.nps.org.au/__data/assets/pdf_file/0008/71675/09060902_Meds_safety_June_2009.pdf (accessed May 2016).
- 7. Kripalani S, LeFevre F, Phillips CO, et al. Deficits in communication and information transfer between hospital-based and primary care physicians: implications for patient safety and continuity of care. JAMA 2007; 297: 831-841.
- 8. Feigenbaum P, Neuwirth E, Trowbridge L, et al. Factors contributing to all-cause 30-day readmissions: a structured case series across 18 hospitals. Med Care 2012; 50: 599-605.
- 9. Callen J, McIntosh J, Li J. Accuracy of medication documentation in hospital discharge summaries: a retrospective analysis of medication transcription errors in manual and electronic discharge summaries. Int J Med Inform 2010; 79: 58-64.
- 10. Belleli E, Naccarella L, Pirotta M. Communication at the interface between hospitals and primary care: a general practice audit of hospital discharge summaries. Aust Fam Physician 2013;42: 886-890.
- 11. Taylor G, Leversha A, Archer C, et al. Standards of practice for clinical pharmacy services. J Pharm Pract Res 2013; 43: S2-S69 (https://www.shpa.org.au/resources/standards-of-practice-for-clinical-pharmacy-services).
- 12. Donner A, Klar N. Methods for comparing event rates in intervention studies when the unit of allocation is a cluster. Am J Epidemiol 1994; 140: 279-289.
- 13. Australian Commission on Safety and Quality in Health Care. Electronic Discharge Summary Systems Self-Evaluation Toolkit. Sydney: ACSQHC, 2011. https://www.safetyandquality.gov.au/wp-content/uploads/2012/01/EDS-self-eval-toolkit-sept2011.pdf (accessed May 2016).
- 14. van Walraven C, Rokosh E. What is necessary for high-quality discharge summaries? Am J Med Qual 1999; 14: 160-169.
- 15. Haller G, Myles PS, Taffé P, et al. Rate of undesirable events at beginning of academic year: retrospective cohort study. BMJ 2009; 339: b3974.
Abstract
Objectives: To evaluate whether pharmacists completing the medication management plan in the medical discharge summary reduced the rate of medication errors in these summaries.
Design: Unblinded, cluster randomised, controlled investigation of medication management plans for patients discharged after an inpatient stay in a general medical unit.
Setting: The Alfred Hospital, an adult major referral hospital in metropolitan Melbourne, with an annual emergency department attendance of about 60000 patients.
Participants: The evaluation included patients’ discharge summaries for the period 16 March 2015 – 27 July 2015.
Interventions: Patients randomised to the intervention arm received medication management plans completed by a pharmacist (intervention); those in the control arm received standard medical discharge summaries (control).
Main outcome measures: The primary outcome variable was a discharge summary including a medication error identified by an independent assessor.
Results: At least one medication error was identified in the summaries of 265 of 431 patients (61.5%) in the control arm, compared with 60 of 401 patients (15%) in the intervention arm (P<0.01). The absolute risk reduction was 46.5% (95% CI, 40.7–52.3%); the number needed to treat (NNT) to avoid one error was 2.2 (95% CI, 1.9–2.5). The absolute risk reduction for a high or extreme risk error was 9.6% (95% CI, 6.4–12.8%), with an NNT of 10.4 (95% CI, 7.8–15.5).
Conclusions: Pharmacists completing medication management plans in the discharge summary significantly reduced the rate of medication errors (including errors of high and extreme risk) in medication summaries for general medical patients.
Australia New Zealand Clinical Trials Registry number: ACTRN12616001034426.