


The known Socio-economic and geographic factors influence allergic sensitisation.
The new Coastal proximity, climate, and environmental (urban v regional) factors affect allergy patterns in the Greater Sydney area. A selected ten-aeroallergen skin prick test (SPT) panel identified 98.5% of atopic patients in our sample. 72.4% of grass-sensitised patients were co-sensitised to both temperate and subtropical grasses.
The implications The identified patterns of allergic sensitisation can inform more effective aeroallergen avoidance strategies. The high level of co-sensitisation to temperate and subtropical grasses suggests that existing immunotherapy is suboptimal in the Australian setting. Our selected Australian SPT panel may assist clinicians screening for allergy.
Allergic sensitisation is the first step in the pathogenesis of allergic disease. Socio-economic and geographic factors, including rural environment and climate, affect patterns of allergic sensitisation.1,2 Recognising sensitisation patterns may inform more effective allergen avoidance strategies, and help guide approaches to testing for and treating allergies. In particular, it may influence the choice of immunotherapy, a treatment modality that reduces symptoms and medication use, and which modifies disease in the long term.3
Our study explored airborne allergen (aeroallergen) sensitisation patterns in the Greater Sydney area, and their relationships with climate, proximity to the coast, and environment (urban or rural). As co-sensitisation patterns may be important when making choices about allergy testing and immunotherapy, we also explored patterns of co-sensitisation to temperate and tropical grasses, and to two house dust mite (HDM) species, Dermatophagoides farinae and Dermatophagoides pteronyssinus.
Methods
In a retrospective, cross-sectional, multicentre study, we analysed the electronic database records for patients of three Sydney allergy clinics who had undergone aeroallergen skin prick testing (SPT) during the period January 2001 – October 2014. Electronic records were available from January 2001 for one clinic, from January 2009 for the second, and from January 2013 for the third. One author (AWK) reviewed the records and extracted data on sex, date of birth, SPT results, and age and postcode at the time of testing. If patients had undergone multiple SPT, only the most recent results were analysed. Patients were excluded if their postcodes were outside the Greater Sydney area (hereafter: “Sydney”) as defined by the Australian Bureau of Statistics’ (ABS) Australian Statistical Geographic Standard4 (Box 1) or if their most recent SPT test was invalid.
Skin prick testing
Each clinic performed SPT according to the Australasian Society of Clinical Immunology and Allergy guidelines.5 SPT results were reported as the mean diameter (mm) of the wheal reaction to the testing reagent. Criteria for valid tests were that the mean diameter of the wheal induced by the negative (ie, non-allergenic) control, phenolated glycerol saline, was no greater than 3 mm, and that the wheal induced by the positive control, 10 mg/mL histamine dihydrochloride (directly elicits a cutaneous wheal and flare response), was more than 4 mm wider than that of the negative control.5 Patients were deemed sensitised to an allergen if the mean diameter of the induced wheal was at least 3 mm if there was no reaction to the negative control, or more than 3 mm larger than that of the negative control if there was a reaction to the negative control.5
The allergens tested were those known to be present in Sydney. We grouped these allergens according to shared characteristics: HDM (D. farinae, D. pteronyssinus); animals (cat, dog); cockroach mix; moulds (Aspergillus, Alternaria, Cladosporium, Penicillium); weeds (plantain, Parietaria, Oleaceae mix); trees (plane tree, pine tree mix [Pinus contorta and P. ponderosa], birch tree); temperate grasses (five grass mix [timothy, rye, meadow, sweet vernal, cocksfoot], rye grass, timothy grass); and tropical grasses (Bermuda grass, Bahia grass). HollisterStier Allergy and Stallergenes (Alyostal) reagents were used during testing. Some patients were exposed to different SPT panels, as clinically indicated at presentation.
Definition of coastal habitation
Each patient was assigned to one of three coastal habitation groups according to the distance of their postcode from the coastline (< 15 km, 15–30 km, > 30 km). To assign these groups, a map of ABS postcode areas6 (vector format) was opened in ArcGIS (ESRI), a geographic information system program. Each postcode area was converted to a point on the map determined by its geometric centroid (a single coordinate representing the average of all points in the postcode area). The distance of the centroid of each postcode from the nearest point on the coastline was then determined.
Climate zone classification
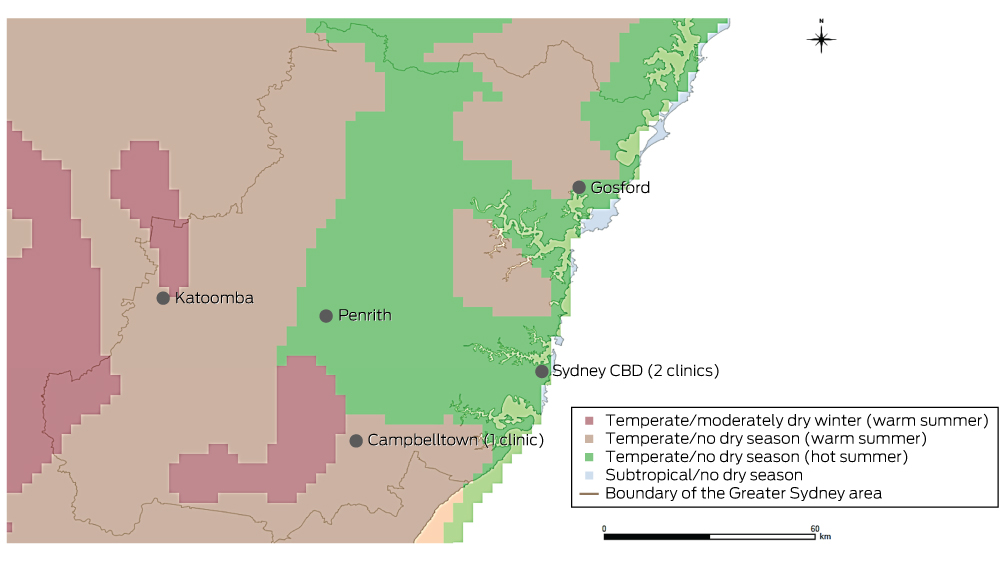
Climate zones were defined according to the Australian Köppen climate classification of the Australian Bureau of Meteorology (Appendix 1, Box 1).7 Four climate zones were defined in Sydney: subtropical/no dry season; temperate/no dry season (hot summer); temperate/no dry season (warm summer), and temperate/moderately dry winter (warm summer).7,8
To determine the climate zone of each postcode, a digitised map (vector format) of ABS postcode areas6 was overlaid with a digitised map (raster format) of the Australian Köppen climate zones in ArcGIS (ESRI).9 Postcodes were assigned the predominant climate zone (by area) within their boundaries.
Definition of urban and regional areas
Urban and regional areas were defined according to the Accessibility/Remoteness Index of Australia+ (ARIA+), an Australian government-endorsed geographic measure of remoteness.10 Two remoteness categories were defined in the Sydney area, “Major cities of Australia” (in this article: “urban”) and “Inner regional Australia” (“regional”).
Data analysis
The proportions of patients sensitised and co-sensitised to the tested aeroallergens were calculated. To determine the ten-aeroallergen panel that provided the highest detection rate of atopic individuals, descriptive analyses assessed all possible aeroallergen combinations. These analyses were performed in SPSS 22.0 (IBM). Confidence intervals for proportions of patients exhibiting aeroallergen sensitisation were calculated by the Clopper and Pearson method in GraphPad Prism 6.04 (GraphPad Software).
Differences in the proportions of positive SPT results between climate zones, coastal and inland areas, and urban and regional areas were analysed in χ2 tests. Z-tests (with Bonferroni correction) identified significant pairwise differences between specific climate zones or coastal habitation areas. Analysis of data for coastal habitation areas by χ2 tests was adjusted for climate zone to assess the interaction of their effects. Sub-analysis of the 563 patients aged 16 years or less evaluated the influence of changes of address on results; it was assumed that children were less likely to have moved house as often as adults. These analyses were performed in SPSS 22.0.
Ethics approval
Ethics approval was granted by the St Vincent’s Hospital Human Research Ethics Committee (reference, LNR/14/SVH/88).
Results
A total of 1421 patients met the selection criteria. The mean age at testing was 28.3 years (SD, 21.3); 757 patients were female (53.3%). As expected of tertiary allergy services, there was a high proportion of sensitised patients, with 1092 (76.8%; 95% confidence interval [CI], 74.6–79.0%) sensitised to at least one aeroallergen. The distribution of patients between climatic and geographic zones is summarised in Appendix 2.
Across Sydney, the most common sensitising aeroallergens were HDM (63.2% of tested patients; 95% CI, 60.6–65.7%) and grasses (46.3%; 95% CI, 43.6–49.0%). Sensitisation to temperate grasses (44.5%; 95% CI: 41.7–47.4%) was more common than to subtropical grasses (37.6%; 95% CI, 34.7–40.4%; P < 0.001). The most common sensitising aeroallergens are listed in Box 2.
Among the 1092 patients sensitised to at least one aeroallergen, 1057 (96.8%) had undergone both HDM and grass pollen SPT; of these, 995 (94.1%) were sensitised to at least one of these allergen groups, and 484 (45.8%) were sensitised to both HDM and grass pollen.
Of the 901 patients who had undergone testing to all eight allergen groups, 124 (13.8%) were sensitised to only one allergen group (mono-sensitised), of whom 72% were mono-sensitised to HDM aeroallergen (Box 3).
Climate zone influence
There were no climate zone differences in the patterns of HDM and animal aeroallergen sensitisation. A temperate/warm summer climate, however, was associated with a higher proportion of patients sensitised to cockroach, mould, weed, tree, and temperate or subtropical grass allergens than were temperate/hot summer and subtropical climates (Box 4).
A sub-analysis of patients aged 16 years or younger found that HDM sensitisation was more common in temperate/hot summer climates (72.9%) than in temperate/warm summer climates (moderately dry winter, 51.8%; no dry season, 59.6%; P < 0.001). There were no significant differences in patterns of sensitisation between climate zones for other allergen groups (data not shown).
Coastal habitation
There was no relationship between coastal proximity and patterns of HDM and cat sensitisation. Lower proportions of patients residing less than 15 km from the coast were sensitised to cockroach, mould, weed, tree, temperate grass and subtropical grass aeroallergens than those further inland (Box 5, Appendix 3).
All participants living in temperate/moderately dry winter, warm summer zones also lived more than 30 km from the coast, while all in subtropical climate zones lived more than 15 km from the coast. In both temperate/no dry season zones, the pattern of increasing sensitisation further from the coastline remained significant after adjustment for climate zone, with two exceptions: there was no relationship between coastal proximity and sensitisation to cockroach and mould in patients living in temperate/no dry season, warm summer climates (data not shown).
A sub-analysis of tested patients aged 16 years or younger indicated that those residing less than 15 km from the coast were less commonly sensitised to mould, weed, tree and subtropical grass aeroallergens than patients further inland (P < 0.05 for each). Similar patterns were observed for cockroach and temperate grass sensitisation, but were not statistically significant (P = 0.063 and P = 0.055 respectively) (data not shown).
Urban and regional residence
Lower proportions of patients in urban areas were sensitised to cockroach, mould and subtropical grass aeroallergens than in regional areas. There were no differences for other allergen groups (Box 6). Although the differences in a sub-analysis of patients aged 16 years or younger were similar, they were not statistically significant (cockroach, P = 0.153; moulds, P = 0.456; subtropical grasses, P = 0.190) (data not shown).
Co-sensitisation
A total of 1135 patients underwent both temperate and subtropical grass SPT. Of the 554 sensitised to any grass, 401 (72.4%) were sensitised to both temperate and subtropical grasses; 128 patients (23.1%) were sensitised to temperate grasses only, and 25 (4.5%) to subtropical grasses only.
A total of 496 patients underwent both D. pteronyssinus and D. farinae SPT. Of the 301 sensitised to HDM, 260 (86.4%) were sensitised to both species, while 32 patients (11%) were sensitised to D. pteronyssinus only and 9 (3%) to D. farinae only.
Testing panel
A ten-aeroallergen testing panel consisting of D. pteronyssinus, cat, dog, cockroach mix, Alternaria, Aspergillus, plantain, rye grass, timothy grass, and either Bermuda or Bahia grass (the two grasses yielded the same results) identified 98.5% of all sensitised patients (1076 of 1092).
Discussion
This study explored patterns of aeroallergen sensitisation in Sydney. Other authors have hypothesised that D. pteronyssinus is the predominant HDM allergen in Sydney;11 indeed, it has been found that D. farinae comprises only 5.1% of HDMs found in house dust in Sydney.12 Other studies of HDM species prevalence reported that D. farinae is rarely found in Australian cities, suggesting the predominance of D. pteronyssinus across the nation,13-15 an interpretation supported by our results. Only a small proportion of our Sydney sample were sensitised solely to D. farinae (3%) and a comparatively higher proportion to D. pteronyssinus alone (11%). D. farinae and D. pteronyssinus allergen cross-reactivity probably explains the high proportion of HDM-sensitised patients who were co-sensitised to both species (86.4%).
A panel of ten aeroallergens — D. pteronyssinus, cat, dog, cockroach mix, Alternaria, Aspergillus, plantain, rye grass, timothy grass, and either Bermuda or Bahia grass — may be a useful screening panel in Sydney, having identified 98.5% of atopic patients in our study. This panel, modified by adding or subtracting aeroallergens according to regional variations in the predominance of allergens, may also be useful elsewhere in Australia.
We found a high proportion of co-sensitisation to temperate and subtropical grasses in the Sydney area (72.4%), consistent with findings by studies in subtropical Australian regions.16 This differs from findings in Europe and North America, where temperate grasses are predominantly responsible for grass pollen sensitisation.17,18 Temperate and subtropical grass pollens have both shared and distinct immunological properties, and the IgE reactivity of residents of temperate and subtropical regions is higher to the grass group of the corresponding climate.16,19,20 This suggests that differences in temperate and subtropical grass immunological reactivity are clinically relevant. As such, the high proportion of patients co-sensitised to temperate and subtropical grasses which we found indicates that both temperate and subtropical grass testing and immunotherapy may be important in Sydney and other temperate and subtropical regions. As most immunotherapeutic agents, particularly newer sublingual immunotherapy tablets, are directed against temperate grass aeroallergens alone, they may not provide adequate coverage in Australia.16,21 Treatments directed against both temperate and subtropical grasses may be required. Bermuda grass testing and immunotherapy may be particularly relevant, as it is less cross-reactive with temperate grasses than Bahia grass.20
Our results confirmed that sensitisation to Alternaria, grass, weed and tree is less common in residents near the coast.11,22,23 Further, cockroach, Aspergillus and Cladosporium sensitisation is less common in areas less than 15 km from the sea. The climatic conditions of the coast (including increased humidity, thermal stability, and coastal breezes) may offer some protection against these aeroallergens.
Interestingly, regional patients were more frequently sensitised to cockroach than were urban residents. A possible explanation is that our “regional” areas lay on the outskirts of Sydney, and were areas with lower household incomes and socio-economic status,24 both of which are risk factors for sensitisation to cockroach aeroallergens.25,26
The strengths of our study included the fact that it was the first to examine associations between sensitisation to specific allergen groups and climatic and geographic factors in an Australian setting over distances of tens of kilometres. It is also the first to report the prevalence of aeroallergen sensitisation in the Sydney area in a cohort of this size. Further, by separately analysing sensitisation for those under 16 years of age, who were unlikely to have changed addresses as often as older people, the study provides strong evidence of the effect of coastal habitation on reducing sensitisation rates to mould, weed, tree and subtropical grass aeroallergens. Finally, this study is more likely to reflect patterns of clinically relevant sensitisation because it used SPT results to define sensitisation, rather than allergen-specific IgE blood tests; further, it was restricted to patients who had presented to allergy specialists.
Our study, however, has limitations. Firstly, as postcodes and not exact addresses defined places of residence, microclimate and geographic location could not be precisely allocated for each person. Secondly, the proportion of people with allergic sensitisation in our investigation would be higher than in the general population, as we studied patients attending tertiary allergy clinics. Finally, as some patients were tested with different SPT panels, according to clinical indication at presentation, the prevalence of sensitisation we report may be higher than if all patients had undergone SPT for each of the allergens. This limitation was unavoidable, given the retrospective nature of our study. We also note that clinical reactivity requires both allergen sensitisation and subsequent allergen exposure. As such, sensitisation is clinically relevant only when there is also a risk of exposure to the allergen.
In conclusion, our study yields three major insights. Firstly, allergic sensitisation to a variety of different aeroallergens was less common in patients attending allergy clinics who resided less than 15 km from the coast, in temperate/hot summer or subtropical climates, or in urban parts of Sydney. These relationships may affect decisions about allergen reduction and avoidance measures. Secondly, a ten-aeroallergen SPT panel identified more than 98% of atopic patients in Sydney; this panel may assist clinicians when screening for allergy. Finally, currently available immunotherapeutic options, based on northern hemisphere temperate grass allergens, may be inappropriate in the Australian setting in view of the high degree of co-sensitisation to temperate and subtropical grasses; regimens directed at both grass types would be more suitable for treating grass allergy in subtropical regions.
Box 2 – Proportion of patients exhibiting sensitisation to specific aeroallergens
Allergen |
Number of patients tested |
Number sensitised |
Proportion sensitised (95% CI) |
||||||||||||
House dust mite |
1404 |
887 |
63.2% (60.6–65.7) |
||||||||||||
D. farinae |
496 |
269 |
54.2% (49.7–58.7) |
||||||||||||
D. pteronyssinus |
1404 |
878 |
62.5% (59.9–65.1) |
||||||||||||
Animals |
1303 |
517 |
39.6% (37.2–42.1) |
||||||||||||
Cat |
1274 |
452 |
35.5% (32.8–38.2) |
||||||||||||
Dog |
1132 |
256 |
22.4% (20.2–24.7) |
||||||||||||
Cockroach mix |
983 |
295 |
30.0% (27.2–33.0) |
||||||||||||
Moulds |
1295 |
347 |
26.8% (24.4–29.3) |
||||||||||||
Alternaria |
1242 |
255 |
20.5% (18.3–22.9) |
||||||||||||
Aspergillus |
1213 |
154 |
12.7% (10.9–14.7) |
||||||||||||
Cladosporium |
872 |
137 |
15.7% (13.4–18.3) |
||||||||||||
Penicillium |
628 |
76 |
12.1% (9.7–15) |
||||||||||||
Weeds |
1207 |
387 |
32.1% (29.4–34.8) |
||||||||||||
Plantain |
1204 |
340 |
28.2% (25.7–30.9) |
||||||||||||
Parietaria |
636 |
27 |
4.2% (2.8–6.1) |
||||||||||||
Oleaceae mix |
634 |
68 |
10.7% (8.4–13) |
||||||||||||
Trees |
972 |
155 |
15.9% (13.7–18.4) |
||||||||||||
Plane tree |
932 |
65 |
7.0% (5.4–8.8) |
||||||||||||
Pine mix |
564 |
33 |
5.9% (4.1–8.1) |
||||||||||||
Birch tree |
616 |
116 |
18.8% (15.8–22.1) |
||||||||||||
Temperate grass |
1209 |
538 |
44.5% (41.7–47.4) |
||||||||||||
Five grass mix |
188 |
68 |
36.2% (29.3–43.5) |
||||||||||||
Rye grass |
1103 |
490 |
44.4% (41.5–47.4) |
||||||||||||
Timothy grass |
605 |
328 |
54.2% (50.1–58.2) |
||||||||||||
Subtropical grass |
1137 |
427 |
37.6% (34.7–40.4) |
||||||||||||
Bermuda grass |
1129 |
383 |
33.9% (31.2–36.8) |
||||||||||||
Bahia grass |
755 |
331 |
43.8% (40.3–47.5) |
||||||||||||
All grasses |
1350 |
625 |
46.3% (43.6–49.0) |
||||||||||||
Any aeroallergen |
1421 |
1092 |
76.8% (74.6–79.0) |
||||||||||||
Box 3 – Aeroallergen groups to which 124 mono-sensitised patients were sensitised*
Allergen group |
Number mono-sensitised (%) |
||||||||||||||
House dust mite |
89 (72%) |
||||||||||||||
Animals |
8 (6%) |
||||||||||||||
Cockroach |
3 (2%) |
||||||||||||||
Moulds |
11 (9%) |
||||||||||||||
Weeds |
4 (3%) |
||||||||||||||
Trees |
1 (1%) |
||||||||||||||
Temperate grasses |
8 (6%) |
||||||||||||||
Subtropical grasses |
0 |
||||||||||||||
* This table includes only patients who had undergone skin prick testing for all eight allergen groups (901 patients) and who were sensitised to aeroallergens of only one allergen group. | |||||||||||||||
Box 4 – Aeroallergen sensitisation according to climate zone of residence
Allergen |
Temperate/moderately dry winter, warm summer |
Temperate/no dry season, warm summer |
Temperate/no dry season, hot summer |
Subtropical |
P† |
||||||||||
Sensitised (%) |
Number tested |
Group* |
Sensitised (%) |
Number tested |
Group* |
Sensitised (%) |
Number tested |
Group* |
Sensitised (%) |
Number tested |
Group* |
||||
House dust mite |
58% |
116 |
— |
63.2% |
476 |
— |
64.4% |
781 |
— |
52% |
31 |
— |
0.29 |
||
Animals |
33% |
106 |
— |
42.1% |
416 |
— |
39.6% |
750 |
— |
32% |
31 |
— |
0.30 |
||
Cockroach |
38% |
84 |
α |
38.5% |
361 |
α |
24.1% |
514 |
β |
0 |
24 |
γ |
< 0.001 |
||
Mould |
29% |
102 |
α, β |
36.3% |
419 |
β |
22.0% |
744 |
α, γ |
3% |
30 |
γ |
< 0.001 |
||
Weeds |
37% |
83 |
α, β |
42.6% |
371 |
β |
26.6% |
723 |
α |
20% |
30 |
α, β |
< 0.001 |
||
Trees |
13% |
85 |
α, β |
24.6% |
362 |
β |
11.0% |
501 |
α |
0 |
24 |
α |
< 0.001 |
||
Temperate grasses |
46% |
109 |
α, β |
53.6% |
435 |
β |
39.3% |
638 |
α, γ |
15% |
27 |
γ |
< 0.001 |
||
Subtropical grasses |
50% |
93 |
α |
52.3% |
398 |
α |
27.1% |
619 |
β |
15% |
27 |
β |
< 0.001 |
||
All grasses |
50% |
111 |
α, β |
55.2% |
440 |
β |
41.9% |
768 |
α |
16% |
31 |
γ |
< 0.001 |
||
Total patients tested |
119 |
483 |
788 |
31 |
|||||||||||
* Z-test (with Bonferroni corrections) for pairwise comparison of proportions of patients sensitised to each allergen group in each climate zone. Significant differences (P < 0.05) are indicated by allocating climate zones different Greek letters: α zones are significantly different from β and γ zones, but not from other α zones. For example, the proportion of patients sensitised to grass allergens in temperate/moderately dry winter, warm summer zones (50%) was significantly different to the proportion for subtropical zones (16%), but not the proportions in the other two temperate zone categories (55.2%, 41.9%). † χ2 test. | |||||||||||||||
Box 5 – Aeroallergen sensitisation in according to coastal proximity of residence
Allergen |
< 15 km from coastline |
15–30 km from coastline |
> 30 km from coastline |
P† |
|||||||||||
Sensitised (%) |
Number tested |
Group* |
Sensitised (%) |
Number tested |
Group* |
Sensitised (%) |
Number tested |
Group* |
|||||||
House dust mite |
62.6% |
621 |
— |
66.0% |
468 |
— |
60.0% |
315 |
— |
0.22 |
|||||
Animals |
40.5% |
612 |
— |
36.8% |
410 |
— |
42.0% |
281 |
— |
0.33 |
|||||
Cockroach |
15.1% |
391 |
α |
40.0% |
355 |
β |
39.7% |
237 |
β |
< 0.001 |
|||||
Mould |
17.4% |
610 |
α |
37.2% |
406 |
β |
32.3% |
279 |
β |
< 0.001 |
|||||
Weeds |
23.2% |
611 |
α |
36.9% |
355 |
β |
47.3% |
241 |
γ |
< 0.001 |
|||||
Trees |
24.8% |
613 |
α |
39.2% |
380 |
β |
50.0% |
256 |
γ |
< 0.001 |
|||||
Temperate grass |
33.9% |
496 |
α |
49.9% |
421 |
β |
54.8% |
292 |
β |
< 0.001 |
|||||
Subtropical grass |
20.4% |
491 |
α |
46.1% |
384 |
β |
57.3% |
262 |
γ |
< 0.001 |
|||||
All grasses |
36.5% |
619 |
α |
52.2% |
435 |
β |
58.1% |
296 |
β |
< 0.001 |
|||||
Total number of patients tested |
676 |
472 |
323 |
||||||||||||
* Z-test (with Bonferroni corrections) for pairwise comparison of proportions of patients sensitised to each allergen group in each climate zone. Significant differences (P < 0.05) are indicated by allocating climate zones different Greek letters: α zones are significantly different from β and γ zones, but not from other α zones. † χ2 test. | |||||||||||||||
Box 6 – Aeroallergen sensitisation in urban and regional areas
Allergen |
Urban |
Regional |
P* |
||||||||||||
Sensitised (%) |
Number tested |
Sensitised (%) |
Number tested |
||||||||||||
House dust mite |
63.1% |
1341 |
65% |
63 |
0.79 |
||||||||||
Animals |
39.5% |
1242 |
43% |
61 |
0.69 |
||||||||||
Cockroach |
29.1% |
932 |
47% |
51 |
0.011 |
||||||||||
Mould |
26.3% |
1238 |
39% |
57 |
0.047 |
||||||||||
Weeds |
31.6% |
1154 |
42% |
53 |
0.14 |
||||||||||
Trees |
15.8% |
923 |
18% |
49 |
0.69 |
||||||||||
Temperate grass |
44.0% |
1150 |
54% |
59 |
0.14 |
||||||||||
Subtropical grass |
36.7% |
1083 |
54% |
54 |
0.014 |
||||||||||
Grasses |
45.8% |
1289 |
56% |
61 |
0.15 |
||||||||||
Total number of patients tested |
1358 |
63 |
|||||||||||||
* χ2 test. | |||||||||||||||
Received 8 March 2016, accepted 22 June 2016
- Andrew W Kam1
- Winnie WY Tong2
- Jenna M Christensen3
- Constance H Katelaris4,5
- Janet Rimmer6
- Richard J Harvey3,7
- 1 University of New South Wales, Sydney, NSW
- 2 St Vincent's Hospital, Sydney, NSW
- 3 St Vincent's Centre for Applied Medical Research, University of New South Wales, Sydney, NSW
- 4 Western Sydney University, Sydney, NSW
- 5 Campbelltown Hospital, Sydney, NSW
- 6 St Vincent's Clinic, Sydney, NSW
- 7 Macquarie University, Sydney, NSW
Richard Harvey is a consultant for Medtronic, Olympus and Neilmed, and received grant support from Meda Pharmaceuticals, Stallergenes, ENT Tech and Neilmed. Janet Rimmer has received honoraria from Novartis, Sanofi Aventis, Mundipharma, BioCSL and Stallergenes. Constance Katelaris has received honoraria from Novartis, BioCSL, Stallergenes and Sanofi Aventis.
- 1. Larenas-Linnemann D, Michels A, Dinger H, et al. Allergen sensitization linked to climate and age, not to intermittent-persistent rhinitis in a cross-sectional cohort study in the (sub)tropics. Clin Transl Allergy 2014; 4: 20.
- 2. Weiland SK, Husing A, Strachan DP, et al. Climate and the prevalence of symptoms of asthma, allergic rhinitis, and atopic eczema in children. Occup Environ Med 2004; 61: 609-615.
- 3. Calderon MA, Alves B, Jacobson M, et al. Allergen injection immunotherapy for seasonal allergic rhinitis. Evid Based Child Health 2010; 5: 1279-1379.
- 4. Australian Bureau of Statistics. 1270.0.55.001. Australian Statistical Geography Standard (ASGS), volume 1. Main structure and Greater Capital City statistical areas, July 2011. http://www.abs.gov.au/AUSSTATS/abs@.nsf/DetailsPage/1270.0.55.001July%202011?OpenDocument (accessed July 2016).
- 5. Australasian Society of Clinical Immunology and Allergy skin prick testing working party. Skin prick testing for the diagnosis of allergic disease. A manual for practitioners. Sydney: ASCIA, 2009. http://www.allergy.org.au/images/stories/ascia_spt_manual_2009.pdf (accessed July 2016).
- 6. Australian Bureau of Statistics. 1270.0.55.003. Australian Statistical Geography Standard (ASGS), volume 3. Non ABS structures, July 2011. Postal areas ASGS non ABS structures ed 2011 digital boundaries in ESRI Shapefile format. http://www.abs.gov.au/AUSSTATS/subscriber.nsf/log?openagent&1270055003_poa_2011_aust_shape.zip&1270.0.55.003&Data%20Cubes&71B4572D909B934ECA2578D40012FE0D&0&July%202011&22.07.2011&Previous (accessed July 2016).
- 7. Stern H, de Hoedt G, Ernst J. Objective classification of Australian climates. Aust Met Mag 2000; 49: 87-96.
- 8. Australian Government Bureau of Meteorology. Gridded Köppen classification metadata [website]. http://www.bom.gov.au/climate/averages/climatology/gridded-data-info/metadata/md_koppen_classification.shtml (accessed Sept 2015).
- 9. Australian Government Bureau of Meteorology. Köppen climate classification [data file]. 2006. http://www.bom.gov.au/web01/ncc/www/climatology/climate-classification/kpn.zip (accessed Sept 2015).
- 10. Australian Bureau of Statistics. Remoteness structure [website]. Updated June 2014. http://www.abs.gov.au/websitedbs/d3310114.nsf/home/remoteness+structure (accessed Sept 2015).
- 11. Peat JK, Toelle BG, Gray EJ, et al. Prevalence and severity of childhood asthma and allergic sensitisation in seven climatic regions of New South Wales. Med J Aust 1995; 163: 22-26.
- 12. Green WF. The house dust mite, Dermatophagoides farinae, in Australia. Med J Aust 1983; 2: 259-260.
- 13. Colloff MJ, Stewart GA, Thompson PJ. House dust acarofauna and Der p I equivalent in Australia: the relative importance of Dermatophagoides pteronyssinus and Euroglyphus maynei. Clin Exp Allergy 1991; 21: 225-230.
- 14. Green WF, Woolcock AJ, Stuckey M, et al. House dust mites and skin tests in different Australian localities. Aust N Z J Med 1986; 16: 639-643.
- 15. Tovey ER, McDonald LG, Peat JK, Marks GB. Domestic mite species and der p 1 allergen levels in nine locations in Australia. Allergy Clin Immunol Int 2000; 12: 226-231.
- 16. Davies JM, Li H, Green M, et al. Subtropical grass pollen allergens are important for allergic respiratory diseases in subtropical regions. Clin Transl Allergy 2012; 2: 4.
- 17. Arbes SJ, Gergen PJ, Elliott L, Zeldin DC. Prevalences of positive skin test responses to 10 common allergens in the US population: Results from the Third National Health and Nutrition Examination Survey. J Allergy Clin Immunol 2005; 116: 377-383.
- 18. D'Amato G, Cecchi L, Bonini S, et al. Allergenic pollen and pollen allergy in Europe. Allergy 2007; 62: 976-990.
- 19. Davies JM. Grass pollen allergens globally: the contribution of subtropical grasses to burden of allergic respiratory diseases. Clin Exp Allergy 2014; 44: 790-801.
- 20. Davies JM, Dang TD, Voskamp A, et al. Functional immunoglobulin E cross-reactivity between Pas n 1 of Bahia grass pollen and other group 1 grass pollen allergens. Clin Exp Allergy 2011; 41: 281-291.
- 21. Devillier P, Dreyfus JF, Demoly P, Calderon MA. A meta-analysis of sublingual allergen immunotherapy and pharmacotherapy in pollen-induced seasonal allergic rhinoconjunctivitis. BMC Med 2014; 12: 71.
- 22. Moral L, Roig M, Garde J, et al. Allergen sensitization in children with asthma and rhinitis: marked variations related to age and microgeographical factors. Allergol Immunopathol (Madr) 2008; 36: 128-133.
- 23. Garcia-Marcos L, Garcia-Hernández G, Suarez-Varela MM, et al. Asthma attributable to atopy: does it depend on the allergen supply? Pediatr Allergy Immunol 2007; 18: 181-187.
- 24. Australian Bureau of Statistics. 1379.0.55.001. National regional profile, 2009–13. June 2015. http://www.abs.gov.au/AUSSTATS/abs@.nsf/Lookup/1379.0.55.001Main+Features12009-13?OpenDocument (accessed Sept 2015).
- 25. Cohn RD, Arbes SJ, Jaramillo R, et al. National prevalence and exposure risk for cockroach allergen in US households. Environ Health Perspect 2006; 114: 522-526.
- 26. Sarpong SB, Hamilton RG, Eggleston PA, Adkinson NF. Socioeconomic status and race as risk factors for cockroach allergen exposure and sensitization in children with asthma. J Allergy Clin Immunol 1996; 97: 1393-1401.
Abstract
Objective: To examine patterns of airborne allergen (aeroallergen) sensitisation in the Greater Sydney area (Sydney), and their relationships with climate, coastal proximity and environment (urban v regional).
Design, setting, participants: Retrospective cross-sectional study of patients who underwent aeroallergen skin prick testing at three Sydney allergy clinics, January 2001 – October 2014.
Main outcome measurements: Proportions of patients sensitised to specific aeroallergen types; relationships between sensitisation patterns and climate and geography.
Results: Of 1421 patients who met the selection criteria (mean age, 28.3 years [SD, 21.3]; 53.3% were female), 1092 (76.8%) were sensitised to at least one aeroallergen. Those living less than 15 km from the coast were less commonly sensitised to cockroach (< 15 km, 15.1%; 15–30 km, 40.0%; > 30 km, 39.7%; P < 0.001) and grass aeroallergens (< 15 km, 36.5%; 15–30 km, 52.2%; > 30 km, 58.1%; P < 0.001) than patients further inland; the same applied to mould, weed and tree aeroallergens. Subtropical grass sensitisation was more common in temperate/warm summer climates (about 50%) than in temperate/hot summer (27.1%) or subtropical climates (15%) (P < 0.001), and less common in urban (36.7%) than in regional areas (54%; P = 0.014). 72.4% of grass-sensitised patients were co-sensitised to both temperate and subtropical grasses. A selected ten-aeroallergen skin prick test panel identified 98.5% of atopic patients in this Sydney sample.
Conclusions: Environmental and geographic factors are associated with different patterns of allergic sensitisation in Sydney. Extensive co-sensitisation to subtropical and temperate grasses has implications for immunotherapy in Australia, where most currently available therapies are based on formulations directed at temperate grasses only.