


Lags between policy and outcomes mean it is important to have good metrics and the right expectations about timelines
It is well known that the health of Australia’s Aboriginal and Torres Strait Islander people is considerably poorer than that of their non-Indigenous counterparts.1 Strategies, policies, programs and funding over many years have been targeted toward improving the health of Indigenous Australians and closing the gap in health status between Indigenous and non-Indigenous Australians. In this article, we review trends in key mortality rates for both populations and two complementary indices of the gap between them, both of which are essential to understanding progress or otherwise in closing the mortality gaps. Importantly, we also discuss the time required until the impact of policy changes can be assessed.
Measures of “the gap”
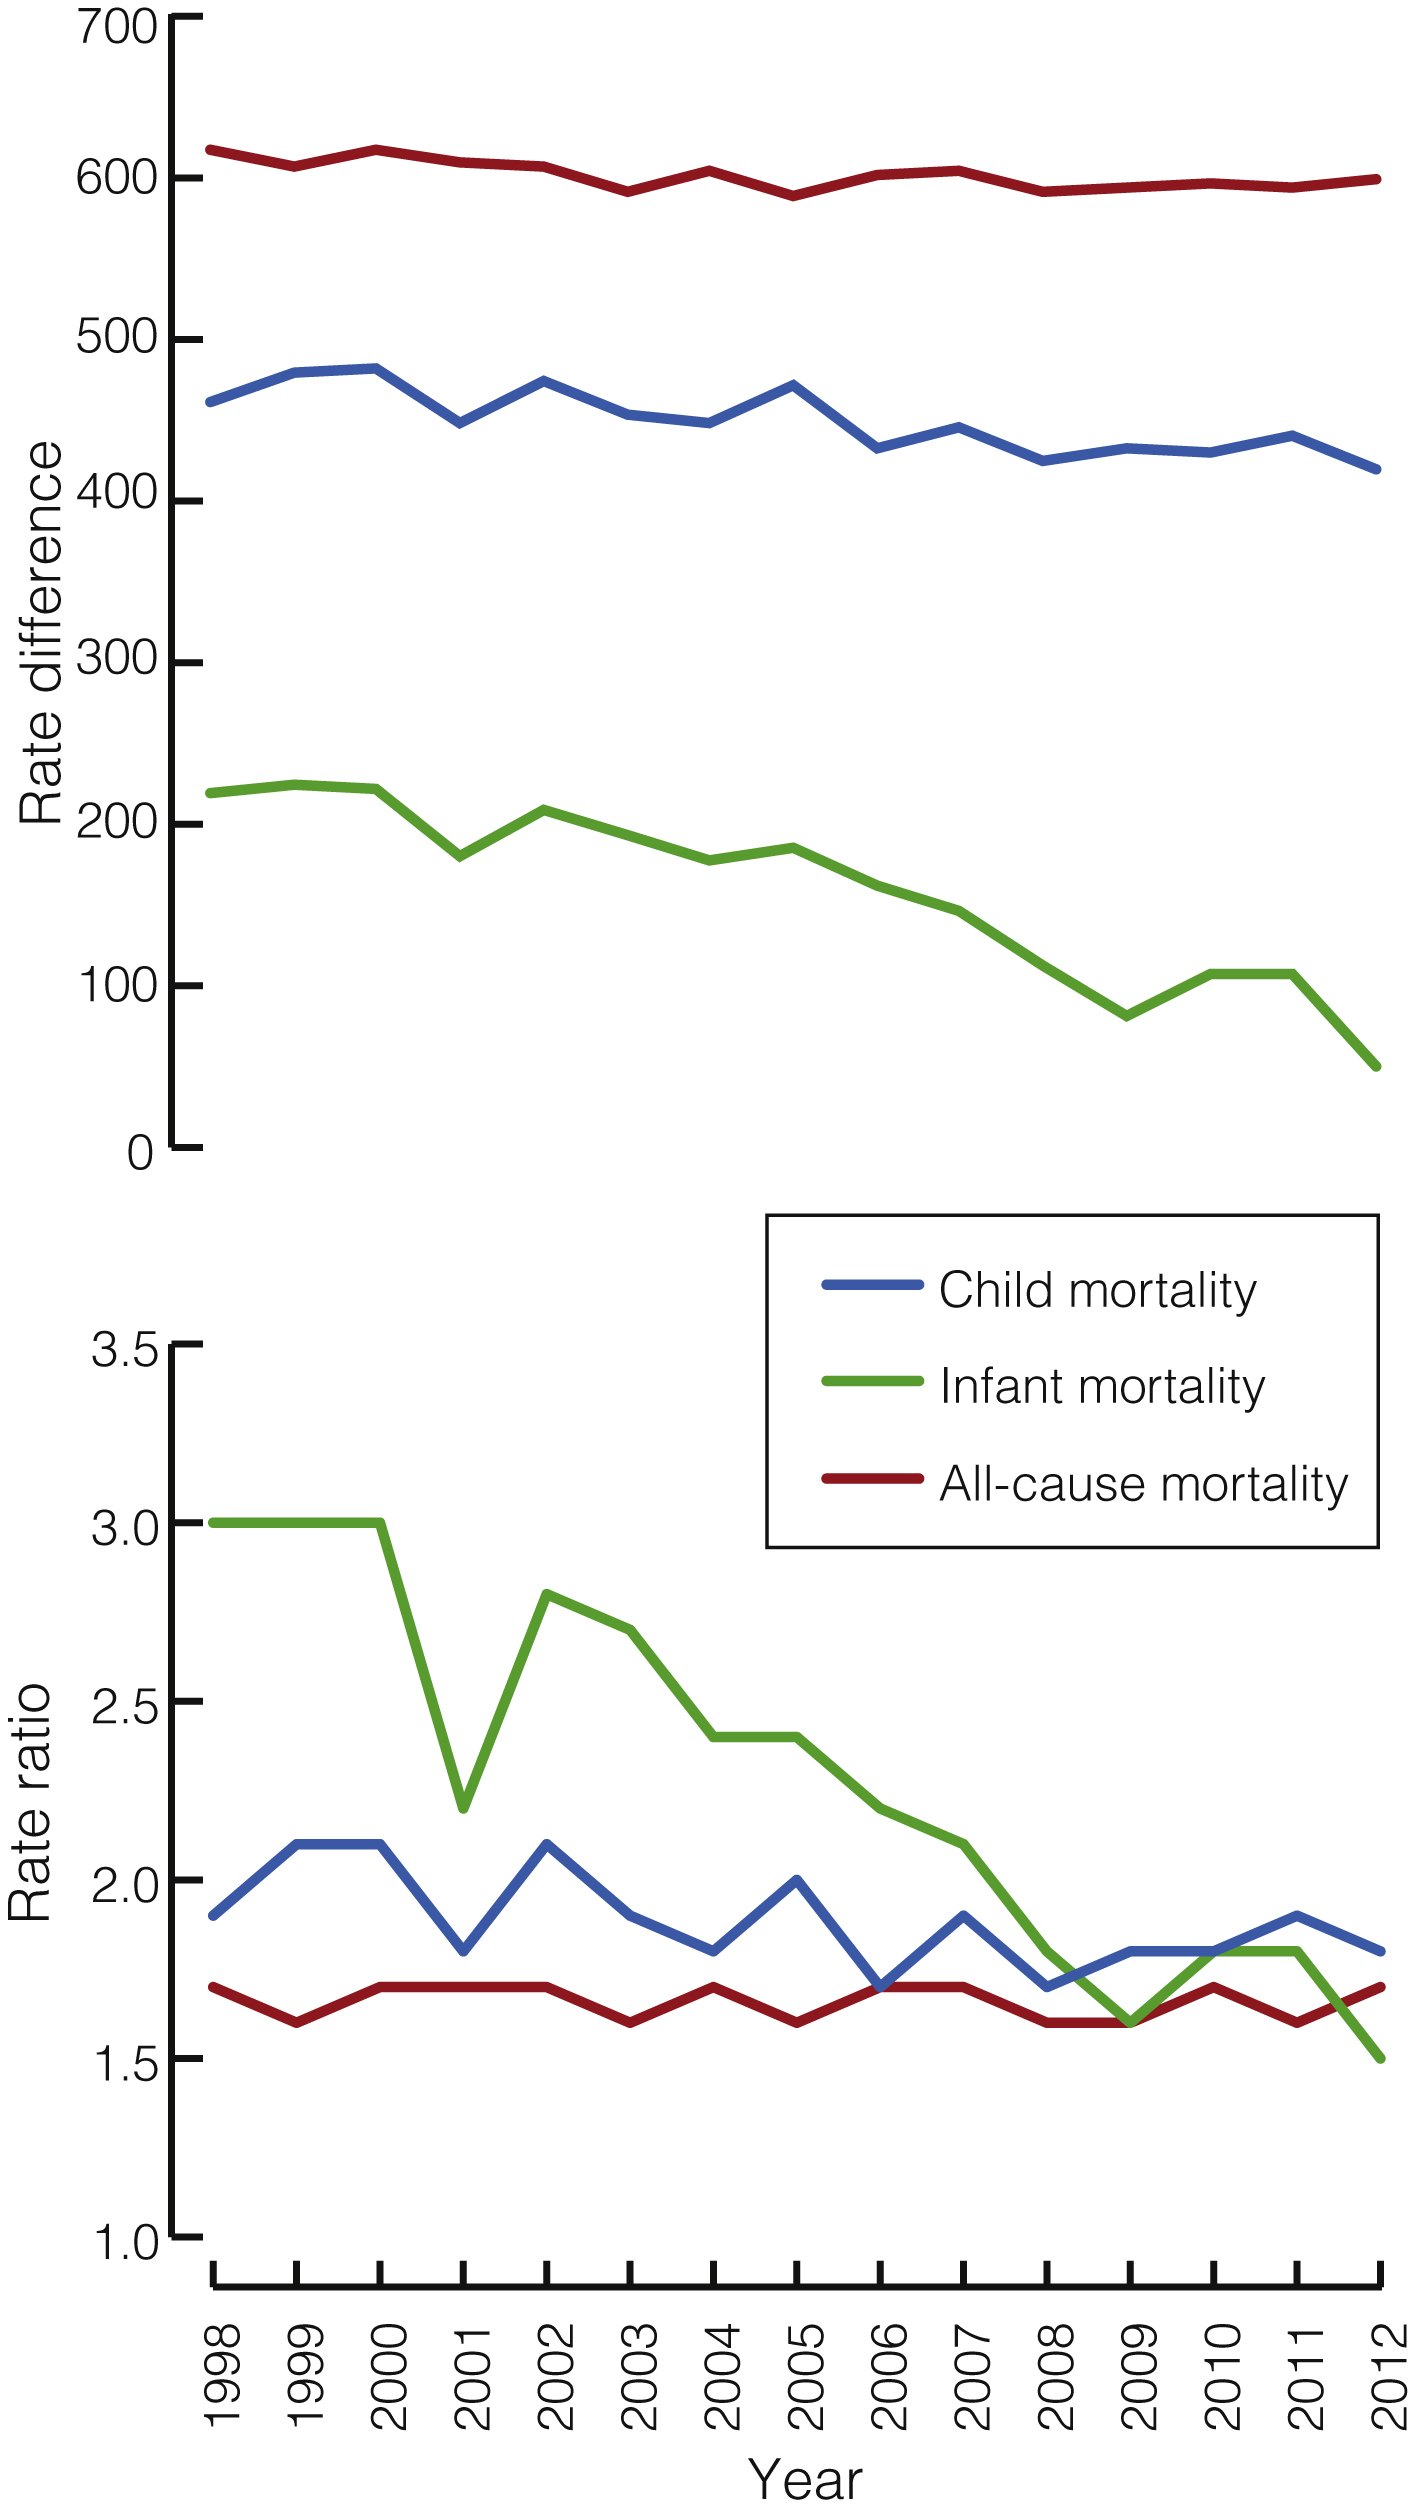
An understanding of changes in mortality over time requires: (i) graphing the non-Indigenous and Indigenous rates to see whether they are declining, remaining stable or increasing; (ii) showing trends in the rate difference (obtained by subtracting the non-Indigenous rate from the Indigenous rate) to indicate movement in the absolute size of the difference and the magnitude of improvement required for the gap to close; and (iii) showing trends in the rate ratio (obtained by dividing the Indigenous rate by the non-Indigenous rate) to indicate whether the relative rate of improvement in Indigenous mortality is faster than for non-Indigenous mortality — the fundamental requirement for the “gap” to finally close.
Are the gaps closing?
Analysis of data from the Aboriginal and Torres Strait Islander Health Performance Framework 2014 report shows that the overall difference in death rates between Indigenous and non-Indigenous Australians during 2008 to 2012 was 389 deaths per 100 000, with a rate ratio of 1.7.2 The Box shows rate differences and rate ratios for mortality from all causes, child mortality and infant mortality among Indigenous and non-Indigenous Australians from 1998 to 2012.
There have been significant declines in the all-cause mortality rate for both Indigenous and non-Indigenous Australians from 1998 to 2012 (of 13.2 and 7.5 deaths per 100 000 per year respectively; both P < 0.001). The rate difference also declined significantly, by 5.8 deaths per 100 000 per year (P = 0.004). The rate ratio, however, did not decline significantly (P = 0.62), with Indigenous rates remaining about 70% higher than non-Indigenous rates throughout the period.
For cardiovascular disease, there have been significant declines in the mortality rate for both Indigenous and non-Indigenous Australians (of 12.3 and 7.7 deaths per 100 000 per year respectively; both P < 0.001). The rate difference also declined significantly, by 4.6 deaths per 100 000 per year (P < 0.001), but the rate ratio, although showing a slight downward trend, did not decline significantly (P = 0.64).
For cancer, there was a significant decline in the mortality rate for non-Indigenous Australians (of 1.3 deaths per 100 000 per year; P = 0.009) but a significant increase in the Indigenous mortality rate (of 2.1 deaths per 100 000 per year; P < 0.001). The rate difference therefore widened significantly by 3.4 deaths per 100 000 per year (P < 0.001). The rate ratio also increased significantly (by 0.02 per year; P < 0.001).
For child mortality, there was a significant decrease in the mortality rate for both Indigenous and non-Indigenous children (of 5.5 and 2.1 deaths per 100 000 per year respectively; both P < 0.001), a significant decrease in the rate difference (by 3.4 deaths per 100 000 per year; P < 0.001) and a small but significant decrease in the rate ratio (by 0.02 per year; P = 0.03).
Most childhood deaths (around 80%) occur in the first year of life.1 Between 1998 and 2012, Indigenous infant mortality rates declined more quickly than non-Indigenous rates (0.7 and 0.1 deaths per 1000 live births per year respectively; both P < 0.001), and so the gap is closing. In 2012 Indigenous infant mortality was 5.0 per 1000 live births, compared with 3.3 for non-Indigenous infant mortality, a gap of 1.7 deaths per 1000 live births. The rate ratio in 2012 was 1.5.
The rate difference and rate ratio provide different but complimentary perspectives on changes in the gap over time. When the Indigenous rate is much higher, a larger (in absolute terms) reduction in the Indigenous rate is required to achieve the same proportionate reduction as an equivalent relative change in the non-Indigenous rate. This means that the rate difference can decline while the rate ratio remains relatively constant, as with cardiovascular disease.
Should the gaps be closing yet?
A wide range of strategies, policies and programs aimed at improving Indigenous health have been implemented over many years, from the establishment of Aboriginal health units in several states in the late 1960s and the initiation of the first Aboriginal Medical Service in Redfern in 1971, to the development of a National Aboriginal Health Strategy in the late 1980s, the establishment of the Healthy for Life program in the mid-2000s, through to the Closing the Gap targets on life expectancy and childhood mortality set by the Council of Australian Government (COAG) in 2008, and beyond. With any policy, however, there is a lead time between when the policy is announced and when it is fully implemented through programs and interventions on the ground. Significant lead and lag times can occur between:
the policy announcement and the full implementation of the program;
program implementation and improvements in health;
improvements in health and the consequent reduction in mortality; and
when a death occurs and the data become available.
An analysis of the expected length of time required to implement programs designed to promote maternal and child health, the resultant improvements in birth outcomes and infant and child health, the consequent reduction in child mortality and the availability of data to confirm this reduction estimated there would be a lag of about 10 years between implementation of a program and the ability to measure its effects.3 A number of intermediate measures that are available in shorter time frames can be used to indicate whether or not infant and child health are improving. These include the take up of antenatal care programs, the prevalence of smoking and alcohol use during pregnancy, breastfeeding and vaccination rates, the incidence of low birth weight, pre-term births and infant and childhood disease, and neonatal and infant mortality.3
The mortality outcomes shown in this article are at least in part the result of policies and programs implemented many years ago. It is likely that the added effect of the COAG child and maternal health initiatives announced in 2008 will not show up in mortality data until around 2018, which will be available for reporting in 2020.
Similarly, it is likely that the additional effects of the COAG smoking initiatives announced in 2008 might be assessed from changes in smoking rates from 2014 onwards, measured in national survey data collected in the financial year 2017–18, with consequent reductions in smoking-related cardiovascular and respiratory mortality from 2018 onwards, reported from 2020 onwards. The much longer lag times for lung cancer could mean that the first effects of the COAG smoking initiatives on cancer mortality may not be seen until 2030.
Implications
Australian governments have made major commitments to tackling critical areas in Indigenous health to close the health gap between Indigenous and non-Indigenous Australians. While changes to these indicators cannot be attributed to the policy context alone, ongoing monitoring of relevant indicators and the size of the gap, and assessment of whether it is changing over time, is required to further inform policy and program direction.
The different perspectives of the rate ratio and the rate difference provide useful information regarding whether the gap is closing. The rate ratio assesses the relative rates of improvement for Indigenous and non-Indigenous populations, while the rate difference provides information about the size of the task to be achieved. Both measures, set in the context of the observed rates, provide information on the closing or widening of the health gap. For all measures apart from cancer, the rate differences are declining significantly, but for the gaps to ultimately close, improvements in Indigenous rates need to occur significantly faster than in the non-Indigenous population, as is happening for infant mortality and, to a much lesser degree, for child mortality.
The changes in mortality rates we describe reflect, at least in part, the cumulative effects of many years of policies and programs aimed at improving Indigenous health, and were occurring before the effects of the Closing the Gap initiatives had sufficient time to appear in currently available data. At this stage it is too early to see whether the health gaps are closing because of the added effect of the Closing the Gap programs. Lags between policy decisions, the implementation of programs and policies aimed at reducing the gap, the effects on risk factors and health-related outcomes, and the availability of data to monitor these outcomes mean that the additional impact on mortality of the Closing the Gap agenda and related initiatives will not be able to be assessed until 2018 onwards.
Provenance: <p>Not commissioned; externally peer reviewed.</p>
- 1. Australian Institute of Health and Welfare. The health and welfare of Australia’s Aboriginal and Torres Strait Islander people: an overview 2011 (AIHW Cat. No. IHW 42). Canberra: AIHW, 2011. http://www.aihw.gov.au/publication-detail/?id=10737418989 (accessed May 2016).
- 2. Australian Institute of Health and Welfare. Aboriginal and Torres Strait Islander health performance framework 2014 report: detailed analyses (AIHW Cat. No. IHW 167). Canberra: AIHW, 2015. http://www.aihw.gov.au/publication-detail/?id=60129550779 (accessed Dec 2015).
- 3. Australian Institute of Health and Welfare. Timing impact assessment for COAG Closing the Gap targets: child mortality (AIHW Cat. No. IHW 124). Canberra: AIHW, 2014. http://www.aihw.gov.au/publication-detail/?id=60129547194 (accessed Dec 2015).
No relevant disclosures.