


Best practice guidelines assist clinicians and health services deliver optimal care to men diagnosed with prostate cancer (CaP),1-3 but little is known about whether optimal approaches to care have been delivered to patients with CaP in Australia. A large United States study that investigated compliance with structural and process of care quality indicators (QIs) highlighted considerable deficits across institutions in care provided to men with localised CaP.4
The Prostate Cancer Outcomes Registry–Victoria (PCOR-Vic), formerly the Victorian Prostate Cancer Clinical Registry (Vic PCR), was established with the aim of improving knowledge of patterns of care and outcomes for men diagnosed with CaP in Victorian hospitals.5 Since its inception in 2009, PCOR-Vic has progressively enlarged its recruitment scope: by 2013 the registry had collected data from 75% of the Victorian target population. To achieve its objectives, a set of QIs was developed after reviewing guidelines and published literature on CaP QIs, and through a consensus process by members of the PCOR-Vic Steering Committee.5 Data on these QIs are reported to contributing clinicians and health services every 6 months after the initial 12-month period following diagnosis.
The registry routinely reports on four outcome measures: patient-reported urinary, bowel and sexual bother, and survival. It also reports on three processes of care indicators. Firstly, it reports to hospitals and clinicians the percentage of men with established low risk disease who have received active treatment during the initial 12-month period after diagnosis (Indicator 1, QI-1). There is now good evidence that active surveillance (AS) is a more appropriate approach than immediate invasive treatment for many men with low risk CaP.6 The Prostate Cancer Research International Active Surveillance (PRIAS) project was initiated in 2006 to describe patterns of care for men on AS and to provide guidance about the AS regimen.7 The Urological Society of Australia and New Zealand has formally endorsed the PRIAS criteria for AS, and has supported the recruitment of patients for PRIAS since 2010.8 Participation in PRIAS is at the discretion of the clinician and patient and thus does not provide a community-based estimate of the uptake of AS.
PCOR-Vic also provides reports about men diagnosed with high risk and locally advanced CaP for whom active treatment was not initiated (Indicator 2, QI-2). The standard approach to treating high risk CaP in patients with an otherwise good life expectancy is prompt initiation of surgery or radiation therapy, the latter with androgen deprivation therapy.2 Delay from the date of biopsy to the date of surgery, particularly for high risk men, may be associated with poorer pathological outcomes.9 There is some evidence that delay in initiating appropriate treatment (based on the risk of disease progression) after the diagnosis of CaP can cause psychological distress.10 More recent evidence indicates that the risk of suicide immediately after diagnosis is 70% higher than for the general population, and that this risk is greatest for men with regionally advanced disease.11
The third process of care indicator routinely measured by the registry relates to risk-adjusted percentages of positive surgical margins (PSMs) following radical prostatectomy (Indicator 3, QI-3). PSM status is important in evaluating quality of care in managing CaP because it is associated with an increased risk of biochemical recurrence after radical prostatectomy12 and is a significant predictor of the need for additional radiotherapy and/or androgen deprivation therapy, even after taking stage of disease into account.13
Patients who are identified as meeting either QI-1 or QI-2 selection criteria are notified to their treating or diagnosing clinicians and hospitals. QI-3 is reported to hospitals and clinicians in the form of risk-adjusted funnel plots if there are more than 20 patients meeting the inclusion criteria. These funnel plots are de-identified with regard to other clinicians, and visually depict variations beyond the mean of two or three standard deviations. Funnel plots were chosen to allow clinicians and health services to compare their performances with those of other providers; to visualise variation in compliance with the indicator; and to stimulate competition in improving outcomes for men with CaP. As with QI-1 and QI-2, hospitals and clinicians are also provided with the names of patients who meet QI-3 criteria (constituting the numerator).
This article reports the overall performance of the Victorian health system over a 5-year period (2009–2013) according to the three processes of care indicators reported by the registry.
Methods
Study population
Men are eligible to be included in PCOR-Vic if they are diagnosed with CaP or treated for CaP at a recruiting hospital after ethics approval at the site; have pathologically confirmed CaP; and are treated by a clinician who has provided consent for patients to be approached and enrolled in the registry. Details of the number of hospitals recruited since 2009 and the average number of patients in each hospital are summarised in Box 1.
Recruitment
The recruitment strategy and data collection methodology of the PCOR-Vic have been previously described.5 In summary, all men identified as having pathologically confirmed CaP notified to the Victorian Cancer Registry and who have not died within 10 months of diagnosis are sent a letter inviting them to participate. We have ethics committee approval to waive patient consent to access management details for men who have died within 10 months; otherwise, an opt-off recruitment strategy is used. Data are collected from hospitals and private consulting suites by trained data collectors. Men are telephoned at 12 and 24 months to confirm that treatment details are accurate and up-to-date, and that they include the most recent prostate-specific antigen (PSA) result.
Statistical analysis
Patients classified as having low risk CaP (ie, if they met the selection criteria of the PRIAS protocol:7 clinical stage T1/T2, PSA ≤ 10 ng/mL, one or two positive biopsy cores, and prostate biopsy Gleason score ≤ 6 based on their most recent biopsy) were included in QI-1. “Most recent biopsy” was defined as the latest biopsy performed during the 12-month period following diagnosis or the initial biopsy at diagnosis if no subsequent biopsy was performed. Men whose initial biopsy or most recent biopsy indicated a higher risk of CaP (ie, no longer met all criteria of the PRIAS protocol) were not included in QI-1. PSA density was omitted in this classification, as the prostate volume (required to calculate PSA density) is not part of the PCOR-Vic minimum dataset.5 Men were deemed to be non-compliant with the PRIAS protocol if they were eligible for PRIAS based on their most recent biopsy and invasive treatment was undertaken within 12 months of diagnosis.
The National Comprehensive Cancer Network (NCCN) definition was used to assess appropriateness of care for high risk and locally advanced disease;1 ie, PSA > 20 ng/mL or Gleason score > 7 or clinical stage ≥ T3a, and not over 80 years of age at diagnosis. Men who met these criteria were included in QI-2, and were deemed to not be receiving appropriate care if active treatment had not been initiated within 12 months of definitive diagnosis of CaP.
Only patients with organ-confined disease (pathological T category 2) were included in the analysis of change in PSM rate over time. Margin status was unequivocal for 2313 patients (98.5%), but in 36 men (1.5%) a definitive status could not be established because the sample was insufficient (four patients), documentation was unclear (seven patients) or the margin status was not stated in the pathology report (25 patients). These cases were not included in further analyses.
Trend analysis was conducted to monitor performance with respect to QI-1, QI-2 and QI-3 for men diagnosed with CaP between 2009 and 2013. Autocorrelation of the month-year data was first assessed by plotting the partial autocorrelation function. We used the autoregressive integrated moving average (ARIMA) model to account for any inherent autocorrelation in the data when analysing the monthly incidence of each indicator. Differences in the annual figures for the indicators across years were also analysed by aggregating data by year and applying the ARIMA model. Data were analysed in Stata 13.0 (StataCorp); P < 0.05 was defined as statistically significant.
Ethics approval
This project received ethics approval from the human research ethics committees of Monash University (reference CF09/0931-2009000436), Cancer Council Victoria (reference 0908) and of each participating health service.
Results
A total of 4708 men were diagnosed with CaP in recruiting hospitals between 1 January 2009 and 31 December 2013 and met at least one of the QI-1, QI-2 or QI-3 inclusion criteria. The PCOR-Vic recorded an opt-off rate of 2.7% over the 5-year period. About 2% of men could not be recruited because their treating doctor had not provided consent for participating in the registry. The demographic and diagnostic details of the men contributing to each indicator are outlined in Box 2.
QI-1: Percentage of men with low risk disease receiving active treatment (non-compliance with PRIAS recommendations)
The proportion of men with low risk disease who underwent active treatment declined between 2009 and 2013. The mean percentage of PRIAS non-compliance had increased non-significantly from 45% in 2009 to 55% (2010) and 50% (2011), but a downward trend was evident in 2012 (40%) and 2013 (34%); this achieved statistical significance in 2013 (P = 0.024).
QI-2: Percentage of men with high risk or locally advanced disease receiving treatment within 12 months of CaP diagnosis
During the 5 years there was a gradual but statistically non-significant increase in the percentage of men with high risk or locally advanced disease receiving treatment within 12 months of diagnosis; 88% of men in these risk groups received immediate active treatment in 2009, rising to 89% in 2010, 91% in 2011 and 2012, and 93% in 2013.
QI-3: Percentage of PSMs for organ-confined pathological T2 disease
The PSM rate for men with organ-confined (pT2) CaP in 2009 was 24%, and rose slightly (by 3.4 percentage points) in 2010. A significant decline was first measured in 2011 (7 percentage point reduction in pT2 prostatectomy PSM; P = 0.031). Further significant improvements were measured for radical prostatectomies performed in 2012 and 2013, when the PSM rate remained steady at 12% (Box 3, Box 4).
Discussion
Given the prevalence of CaP,14 attention to the quality of CaP care has become an important health care issue not only for authorities and policy makers, but also for health service providers and patients. There is broad consensus on the need for regular assessment and monitoring of clinical performance, both for professional development and for quality improvement.15 National data on CaP treatment are limited, and PCOR-Vic was set up as a quality improvement project in 2009 to address this need.5
Our analysis found a downward trend over a 5-year period in the percentage of men with low risk disease who underwent active treatment, an upward trend in the percentage of those with high risk and locally advanced disease who received active treatment within 12 months of diagnosis, and a decline in PSM in men with pathological T2 disease after radical prostatectomy.
The decline in the proportion of men with low risk disease receiving active treatment predated the increased use of transperineal biopsies in Victoria from 2013. AS is a practicable and recommended strategy for reducing overtreatment of patients with low risk CaP.7 The overall level of surveillance of men with low risk CaP in 2012 and 2013 that we found (60%) was higher than that reported by the Michigan Urological Surgery Improvement Collaborative (US) registry which used the D’Amico classification to define low risk CaP (49%).16 Similarly, data from the CaPSURE registry (US) had shown that AS for low risk disease (as defined by the Cancer of the Prostate Risk Assessment [CAPRA] score) had increased sharply from 14.4% in 2009 to 40.4% in 2013.17
We also found that a larger proportion of men in the high risk and locally advanced disease groups were receiving prompt treatment in 2013 (93%) than 5 years previously (88%); the increase, however, was not statistically significant. A number of studies have found that active treatment, such as radical prostatectomy or a combination of external beam radiotherapy and androgen deprivation therapy, was associated with significant benefits in local disease control, reducing the development of metastases, and improving disease-free survival.18,19 Further, mortality among men aged 75 years or more with high risk tumours who receive local therapy is 46% lower than for those treated conservatively, after controlling for age, comorbidities, and risks.20
The change in PSM rate in our study (from 21% in 2009 to 12% in 2012) was similar in proportion to that reported by Cancer Care Ontario (from 37% in 2009 to 21% in 2012).21 Another study that exclusively examined outcomes for patients who had undergone robot-assisted laparoscopic radical prostatectomy procedures reported much lower pT2 prostatectomy margin positivity (4.5% in 2009; 3.0% in 2012)22 than the 12% we found. PCOR-Vic has progressively accrued hospitals, and the number of robot-assisted radical prostatectomy procedures has increased significantly compared with other surgical methods, from 15% of all procedures in 2010 to 60% in 2013. There is evidence that surgical technique, surgeon proficiency and clinical and pathological features of the cancer may affect the risk of a positive margin in patients undergoing radical prostatectomy.23,24
The overall improvements we report across the three QIs are likely to be due to a combination of factors, including an improved knowledge and acceptance of management for low and high risk CaP; technical advances and refinements in surgical technique; and possibly the feedback mechanism provided by the registry, providing hospitals and clinicians with benchmark reports on their performance relative to their peers.
A major strength of our analysis is that PCOR-Vic is a community-based comprehensive quality registry system that captures data about patterns of presentation, management of CaP, treatment procedures, interventions, and patient-reported outcomes related to quality of life, complications, and the effects of CaP treatment on daily living. The data collected by PCOR-Vic are increasingly valuable not only for policy makers and health care providers for guiding best clinical practices and processes and to improve quality of patient care, but also for researchers undertaking relevant investigations of CaP.
Several limitations affect the interpretation of our data. First, the improvement in QIs was detected using PCOR-Vic as a single population, but there may be institutional variations in quality improvement. Second, the process of engagement of hospitals with PCOR-Vic often took a number of months; each hospital started contributing data at different time points that depended on when their individual engagement process was completed. Third, our sample (health services participating in the PCOR-Vic) was restricted to about 75% of the target population, so that generalising our results to the entire target population could be difficult. However, the participating health services are spread broadly across the state and closely reflect the regional/metropolitan and public/private distribution of all CaP care in Victoria.
In conclusion, the community-based PCOR-Vic has identified an overall improvement in the three assessed QIs during its first 5 years of operation. Men in the low risk disease group are less likely to undergo active treatment, showing an increased awareness of adherence to PRIAS recommendations. At the other end of the spectrum, our analysis found that more men with high risk and locally advanced disease are receiving active treatment within 12 months of diagnosis. Finally, the proportion of men with organ-confined (pT2) CaP who had PSM after radical prostatectomy declined across the 5-year period.
Clinical QIs are valuable tools for linking quality registries to improve clinical outcomes. This performance analysis of historical trends in QIs will not only provide important insights into how the PCOR-Vic may have contributed to the outcomes of patients in Victorian hospitals with CaP during its first 5 years of operation, but will also provide the basis for further development of clinical indicators by the binational registry, the PCOR-ANZ,25 and for the implementation of specific evidence-based interventions for optimising CaP care in areas identified as needing improvement.
Box 1 – Number of hospitals contributing to the Prostate Cancer Outcomes Registry–Victoria, 2009–2013
Year of authorisation* |
Number of hospitals (cumulative) |
Average number of consented patients in each hospital |
|||||||||||||
2009 |
9 |
133 |
|||||||||||||
2010 |
15 |
91 |
|||||||||||||
2011 |
33 |
76 |
|||||||||||||
2012 |
33 |
77 |
|||||||||||||
2013 |
33 |
67 |
|||||||||||||
* Each hospital has an authorisation date which signifies the earliest date at which a patient’s diagnosis date was considered eligible for participation. | |||||||||||||||
Box 2 – Demographic and clinical characteristics of men diagnosed with prostate cancer (CaP) in the Prostate Cancer Outcomes Registry–Victoria, 2009–2013
Low risk disease (Indicator 1) |
High risk and locally advanced disease (Indicator 2) |
Radical prostatectomy (Indicator 3) |
|||||||||||||
Total number of contributing men |
1117 |
1840 |
2349 |
||||||||||||
Age group |
≤ 55 years |
245 (21.9%) |
109 (5.9%) |
506 (21.5%) |
|||||||||||
56–65 years |
548 (49.1%) |
543 (29.5%) |
1147 (48.8%) |
||||||||||||
66–75 years |
307 (27.5%) |
886 (48.2%) |
684 (29.1%) |
||||||||||||
> 75 years |
17 (1.5%) |
302 (16.4%) |
12 (0.5%) |
||||||||||||
PSA at diagnosis |
≤ 4 ng/mL |
289 (25.9%) |
117 (6.4%) |
509 (21.7%) |
|||||||||||
4.01–10 ng/mL |
828 (74.1%) |
736 (40.0%) |
1584 (67.4%) |
||||||||||||
10.01–20 ng/mL |
NA |
421 (22.9%) |
193 (8.2%) |
||||||||||||
≥ 20.1 ng/mL |
NA |
549 (29.8%) |
35 (1.5%) |
||||||||||||
Unknown |
NA |
17 (0.9%) |
28 (1.2%) |
||||||||||||
Gleason score at diagnosis |
≤ 6 |
1117 (100%) |
112 (6.1%) |
856 (36.4%) |
|||||||||||
7 (3 + 4) |
NA |
185 (10.1%) |
957 (40.7%) |
||||||||||||
7 (4 + 3) |
NA |
178 (9.7%) |
315 (13.4%) |
||||||||||||
8–10 |
NA |
1357 (73.8%) |
209 (8.9%) |
||||||||||||
Unknown |
NA |
8 (0.4%) |
12 (0.5%) |
||||||||||||
Clinical T category |
T1–T2a |
1052 (94.2%) |
643 (34.9%) |
1570 (66.8%) |
|||||||||||
T2b–T2c |
65 (5.8%) |
370 (20.1%) |
256 (10.9%) |
||||||||||||
T3a |
NA |
445 (24.2%) |
30 (1.2%) |
||||||||||||
T3b–T4 |
NA |
82 (5.0%) |
1 (< 0.1%) |
||||||||||||
Unknown |
NA |
290 (15.8%) |
492 (20.9%) |
||||||||||||
NCCN risk group |
Low |
1047 (93.7%) |
NA |
563 (24.0%) |
|||||||||||
Intermediate |
70 (6.3%) |
NA |
1350 (57.5%) |
||||||||||||
High |
NA |
1748 (95.0%) |
256 (10.9%) |
||||||||||||
Locally advanced |
NA |
92 (5.0%) |
1 (< 0.1%) |
||||||||||||
Metastatic |
NA |
NA |
10 (0.4%) |
||||||||||||
Unknown |
NA |
NA |
169 (7.2%) |
||||||||||||
Diagnostic method |
Transrectal ultrasound (TRUS) |
1102 (98.7%) |
1692 (92.0%) |
2278 (97.0%) |
|||||||||||
Transperineal template biopsy |
15 (1.3%) |
35 (1.9%) |
19 (0.8%) |
||||||||||||
Transurethral resection of the prostate (TURP) |
NA |
100 (5.4%) |
42 (1.8%) |
||||||||||||
Transurethral resection of bladder tumour (TURBT) |
NA |
4 (0.2%) |
NA |
||||||||||||
Other |
NA |
3 (0.2%) |
4 (0.2%) |
||||||||||||
Unknown |
NA |
6 (0.3%) |
6 (0.3%) |
||||||||||||
Surgical approach |
Open prostatectomy |
NA |
NA |
1013 (43.1%) |
|||||||||||
Laparoscopic prostatectomy |
NA |
NA |
150 (6.4%) |
||||||||||||
Robot-assisted laparoscopic prostatectomy |
NA |
NA |
1179 (50.2%) |
||||||||||||
Other prostatectomy |
NA |
NA |
6 (0.3%) |
||||||||||||
Unknown type of prostatectomy |
NA |
NA |
1 (< 0.1%) |
||||||||||||
Number of men for year of diagnosis (Indicators 1 and 2) or surgery (Indicator 3) | |||||||||||||||
2009 |
164 (14.7%) |
240 (13.0%) |
188 (8.0%) |
||||||||||||
2010 |
181 (16.2%) |
256 (13.9%) |
287 (12.2%) |
||||||||||||
2011 |
353 (31.6%) |
474 (25.8%) |
672 (28.6%) |
||||||||||||
2012 |
264 (23.6%) |
467 (25.4%) |
661 (28.1%) |
||||||||||||
2013 |
155 (13.9%) |
403 (21.9%) |
541 (23.0%) |
||||||||||||
NA = not applicable; NCCN = National Comprehensive Cancer Network; PSA = prostate-specific antigen level. | |||||||||||||||
Box 3 – Changes in QI-1, QI-2 and QI-3 between 2009 and 2013, using an autoregressive integrated moving average (ARIMA) model
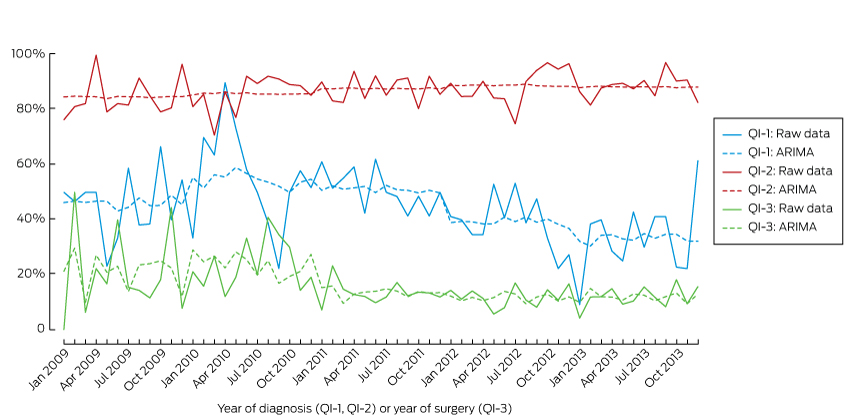
QI-1 = Men with low risk prostate cancer (CaP) who underwent active treatment; QI-2 = men with high risk or and locally advanced CaP who underwent active treatment within 12 months of diagnosis; QI-3 = positive surgical margins in organ-confined (pT2) disease.
Box 4 – Changes in the three process quality indicators QI-1, QI-2 and QI-3 (baseline: 2009)
Year |
QI-1 |
QI-2 |
QI-3 |
||||||||||||
% |
Change since 2009 (95% CI) |
P* |
% |
Change since 2009 (95% CI) |
P* |
% |
Change since 2009 (95% CI) |
P* |
|||||||
2009 |
45.1% |
88.3% |
20.9% |
||||||||||||
2010 |
55.3% |
10.2 (–1.6 to 17.7) |
0.101 |
89.5% |
1.2 (–4.0 to 6.5) |
0.648 |
24.3% |
3.4 (–1.1 to 5.9) |
0.170 |
||||||
2011 |
50.4% |
5.3 (–10.4 to 20.0) |
0.536 |
90.7% |
2.4 (–2.2 to 8.3) |
0.251 |
13.8% |
–7.1 (–14.9 to –0.7) |
0.031 |
||||||
2012 |
39.8% |
–5.3 (–20.6 to 6.3) |
0.297 |
90.8% |
2.5 (–0.4 to 8.8) |
0.074 |
12.0% |
–8.9 (–17.2 to –2.2) |
0.012 |
||||||
2013 |
34.2% |
–10.9 (–23.4 to –1.7) |
0.024 |
92.8% |
4.5 (–1.7 to 9.1) |
0.181 |
11.7% |
–9.2 (–18.1 to –0.6) |
0.036 |
||||||
QI-1 = Men with low risk prostate cancer (CaP) who underwent active treatment; QI-2 = men with high risk or and locally advanced CaP who underwent active treatment within 12 months of diagnosis; QI-3 = positive surgical margins in organ-confined (pT2) disease. * For change since 2009. | |||||||||||||||
Received 14 September 2015, accepted 4 February 2016
- Fanny Sampurno1
- Arul Earnest1
- Patabendi B Kumari1
- Jeremy L Millar2
- Ian D Davis3
- Declan G Murphy4
- Mark Frydenberg5,6
- Paul A Kearns6
- Sue M Evans1
- 1 Monash University, Melbourne, VIC
- 2 Alfred Health, Melbourne, VIC
- 3 Eastern Health Clinical School, Monash University, Melbourne, VIC
- 4 The Peter MacCallum Cancer Centre, Melbourne, VIC
- 5 Monash Health, Melbourne, VIC
- 6 Geelong Urology, Melbourne, VIC
We gratefully acknowledge funding for this project provided by the Australian Department of Health and Ageing, Cancer Australia, and the Movember Foundation. We also acknowledge the contributions of Graham G. Giles (Victorian Cancer Registry), Albert G. Frauman (Austin Health), Damien Bolton (Austin Health), Anthony J. Costello (Royal Melbourne Hospital) and John McNeil (Monash University) for their direct work with this clinical registry. Ian Davis is supported by an NHMRC Practitioner Fellowship (APP1102604).
No relevant disclosures.
- 1. National Comprehensive Cancer Network. NCCN clinical practice guidelines in oncology: prostate cancer. Version 2.2014. https://www.tri-kobe.org/nccn/guideline/urological/english/prostate.pdf (accessed Feb 2016).
- 2. Cancer NCCN. Prostate cancer: diagnosis and treatment (NICE Clinical Guideline 175). London: National Institute for Health and Clinical Excellence (NICE), 2014. http://www.nice.org.uk/guidance/cg175/resources/prostate-cancer-diagnosis-and-management-35109753913285 (accessed Feb 2016).
- 3. Mottet N, Bastian PJ, Bellmunt J, et al. Guidelines on prostate cancer. European Association of Urology, 2014. http://uroweb.org/wp-content/uploads/1607-Prostate-Cancer_LRV3.pdf (accessed Sept 2015).
- 4. Miller DC, Spencer BA, Ritchey J, et al. Treatment choice and quality of care for men with localized prostate cancer. Med Care 2007; 45: 401-409.
- 5. Evans SM, Millar JL, Wood JM, et al. The Prostate Cancer Registry: monitoring patterns and quality of care for men diagnosed with prostate cancer. BJU Int 2013; 111: E158-E166.
- 6. Cheng JY. The Prostate Cancer Intervention Versus Observation Trial (PIVOT) in perspective. J Clin Med Res 2013; 5: 266-268.
- 7. Bul M, Zhu X, Valdagni R, et al. Active surveillance for low-risk prostate cancer worldwide: the PRIAS study. Eur Urol 2013; 63: 597-603.
- 8. Urological Society of Australia and New Zealand. Urological Society joins major international study and adopts “Active Surveillance” as treatment for early prostate cancer [media release]. 11 Aug 2010. http://www.usanz.org.au/uploads/65337/ufiles/Urologist_adopt_PRIAS.pdf (accessed Sept 2015).
- 9. Berg WT, Danzig MR, Pak JS, et al. Delay from biopsy to radical prostatectomy influences the rate of adverse pathologic outcomes. Prostate 2015; 75: 1085-1091.
- 10. Paul C, Carey M, Anderson A, et al. Cancer patients’ concerns regarding access to cancer care: perceived impact of waiting times along the diagnosis and treatment journey. Eur J Cancer Care 2012; 21: 321-329.
- 11. Smith D, Bang A, Egger S, O’Connell D. Risk of suicide after a prostate cancer diagnosis; a population wide study in New South Wales (NSW), Australia [meeting abstract]. BJU Int 2015; 116 Suppl 1: 22.
- 12. Swindle P, Eastham JA, Ohori M, et al. Do margins matter? The prognostic significance of positive surgical margins in radical prostatectomy specimens. J Urol 2008; 179 (5 Suppl): S47-S51.
- 13. Evans SM, Millar JL, Frydenberg M, et al. Positive surgical margins: rate, contributing factors and impact on further treatment: findings from the Prostate Cancer Registry. BJU Int 2014; 114: 680-690.
- 14. Australian Institute of Health and Welfare. Australian Cancer Incidence and Mortality (ACIM) books [website]. http://www.aihw.gov.au/acim-books/ (accessed Sept 2015).
- 15. Joniau S, Pfister D, de la Taille A, et al. Controversies on individualized prostate cancer care: gaps in current practice. Ther Adv Urol 2013; 5: 233-244.
- 16. Womble PR, Montie JE, Ye ZJ, et al. Contemporary use of initial active surveillance among men in Michigan with low-risk prostate cancer. Eur Urol 2015; 67: 44-50.
- 17. Cooperberg MR, Carroll PR. Trends in management for patients with localized prostate cancer, 1990–2013. JAMA 2015; 314: 80-82.
- 18. Bolla M, Collette L, Blank L, et al. Long-term results with immediate androgen suppression and external irradiation in patients with locally advanced prostate cancer (an EORTC study): a phase III randomised trial. Lancet 2002; 360: 103-108.
- 19. Hull GW, Rabbani F, Abbas F, et al. Cancer control with radical prostatectomy alone in 1000 consecutive patients. J Urol 2002; 167: 528-534.
- 20. Bechis SK, Carroll PR, Cooperberg MR. Impact of age at diagnosis on prostate cancer treatment and survival. J Clin Oncol 2011; 29: 235-241.
- 21. Srigley J, Lankshear S, Brierley J, et al. Closing the quality loop: facilitating improvement in oncology practice through timely access to clinical performance indicators. J Oncol Pract 2013; 9: e255-e261.
- 22. Bernie A, Ramasamy R, Ali A, Tewari AK. Changes in pathologic outcomes and operative trends with robot-assisted laparoscopic radical prostatectomy. Indian J Urol 2014; 30: 378-382.
- 23. Eastham JA, Kattan MW, Riedel E, et al. Variations among individual surgeons in the rate of positive surgical margins in radical prostatectomy specimens. J Urol 2003; 170: 2292-2295.
- 24. Webster TM, Newell C, Amrhein JF, Newell KJ. Cancer Care Ontario Guidelines for radical prostatectomy: striving for continuous quality improvement in community practice. Can Urol Assoc J 2012; 6: 442-445.
- 25. Evans S, Nag N, Roder D, et al. Development of an international prostate cancer outcomes registry. BJU Int 2016; doi: 10.1111/bju.13258. [Epub ahead of print].
Abstract
Objective: To analyse the performance of the quality of prostate cancer (CaP) care over a 5-year period with reference to three quality indicators (QIs) reported by the Prostate Cancer Outcomes Registry–Victoria (PCOR-Vic):
QI-1: Alignment with the modified Prostate Cancer Research International Active Surveillance (PRIAS) protocol guideline;
QI-2: Timeliness of CaP care for men with high risk and locally advanced disease;
QI-3: Positive surgical margins (PSMs) for organ-confined pathological T2 disease.
Design, setting and participants: Between 1 January 2009 and 31 December 2013, 4708 men diagnosed with CaP who met the QI-1, QI-2 or QI-3 inclusion criteria were recruited from Victorian hospitals.
Outcome measures and statistical analysis: Trend analysis was conducted to monitor performance according to QI-1, QI-2 and QI-3. We used the autoregressive integrated moving average (ARIMA) model to account for any inherent autocorrelation in the data when analysing the monthly incidence of each indicator. Differences in the annual figures for the indicators across years were also analysed by aggregating data by year and applying the ARIMA model.
Results and limitations: There was a downward trend over the 5 years in the percentage of men with low risk disease who underwent active treatment (45% to 34%; P = 0.024), an upward trend in the percentage of those with high risk and locally advanced disease who received active treatment within 12 months of diagnosis (88% to 93%; P = 0.181), and a decline in PSM rate in men with pathological T2 disease after radical prostatectomy (21% to 12%; P = 0.036). Limitations of the study include the fact that the improvement in the QIs was detected using PCOR-Vic as a single population, but there may be institutional variations in quality improvement.
Conclusions: Over 2009–2013, the performance of the Victorian health system improved according to the three processes of care indicators reported by the PCOR-Vic.