


Cardiovascular disease (CVD) is the leading cause of morbidity and mortality internationally.1,2 A large proportion of CVD events are preventable by appropriate population-level interventions and individual management of risk. The potential for benefit, the balance of benefits and harms, and the cost-effectiveness of treatments to reduce CVD events are more closely related to an individual’s absolute CVD risk — the absolute probability that they will experience a CVD event in a given time period — than to isolated individual risk factors or relative risks.3,4
Accurate assessment of absolute CVD risk applies quantitative data on multiple factors that influence risk, including smoking status, blood pressure (BP), blood lipid levels, and diabetes status, to a person’s age- and sex-specific background level of absolute risk.3 Assessment that is based only on individual risk factors (eg, considering cholesterol levels alone) and does not use tools that allow quantification of overall absolute CVD risk leads to substantial misclassification, a general underestimation of risk, and under- and overtreatment.5 Quantitative absolute risk models that assess risk and guide management are central to the primary prevention of CVD, nationally and internationally.6-9
Population-level data on absolute CVD risk have the potential to inform programs, policy and planning, including those associated with implementing large scale treatment strategies according to absolute CVD risk.10 However, population-level data on absolute CVD risk are not available for most countries, including Australia.
Our investigation aimed to quantify absolute CVD risk in the Australian adult population, as well as treatment with BP- and lipid-lowering medications, using data from a representative health survey. It focused on individuals aged 45–74 years, the age group for which most risk calculators have been validated, and with the greatest population burden of premature CVD.
Methods
Study population
The study population comprised 9564 participants from the Australian Bureau of Statistics (ABS) Australian Health Survey11 aged 18 years or over who provided biomedical data for the National Health Measures Survey (NHMS) between March 2011 and September 2012. Details of the Australian Health Survey and NHMS are provided in the Appendix. Of the 30 329 respondents eligible to participate in the NHMS (ie, Australian Health Survey participants aged 5 years and over), 11 246 (37.1%) did so (46.5% of those aged 45–74 years).
Data and variables
Data on sociodemographic and health-related factors, including prior CVD, medical history and health behaviours, were provided by self-report at the home-based interview for the Australian Health Survey. Height, weight, waist circumference, and systolic and diastolic BP were measured directly, fasting blood samples taken and assayed, and a medications review conducted, using standard methods. Details of these methods and the derived variables (eg, diabetes status) are included in the Appendix, in reference and in Box 1.
Absolute risk of a primary CVD event
The absolute risk of a primary CVD event over the next 5 years for a participant without prior CVD was estimated by applying the Australian National Vascular Disease Prevention Alliance (NVDPA) risk assessment and risk management algorithm, which includes the Framingham CVD risk equation;7,11-13 see the Appendix for details. The absolute risk of a primary CVD event over the next 5 years was categorised using the cut-points: low (< 10%); moderate (10–15%); high (> 15%).7
Statistical methods
All analyses were conducted by staff at the ABS, in collaboration with the authors and using ABS statistical programs, in accordance with the Australian Census and Statistics Act 1905 (Cth), supplemented by calculations by the authors, based on these analyses.
The proportions of people with and without prior CVD were calculated for the entire population aged 18 years or more, as well as by sex and age group. Among those without prior CVD, the distributions of the risk factors contributing to the CVD risk algorithm were estimated for those aged 45 years or more.
The proportions of those aged 18 years or more with low, moderate and high absolute CVD risk were calculated for those without prior CVD and presented according to age group and sex. In those aged 45–74 years, the proportions of those with selected health characteristics and risk factors and the proportions receiving BP- and/or lipid-lowering medications were estimated according to prior CVD and absolute primary CVD risk.
Weights were applied to all prevalence estimates to account for the sampling strategy and non-response (see Appendix). The numbers of individuals in Australia with different CVD risk factors, absolute risk levels, and treatment profiles were estimated by applying the weighted proportions to Australian general population data.11 Standard errors were calculated, taking into account variability due to sampling and to random adjustment, as were 95% confidence intervals (CIs).
Ethics approval
Ethics approval for NHMS data collection was provided by the Australian Government Department of Health Human Research Ethics Committee (reference 2/2011). Additional approval was granted by the Australian National University Human Research Ethics Committee (reference 2014/208).
Results
Respondents for whom data were missing about previous CVD or any components of the risk assessment algorithm, including factors in the Framingham CVD risk equation, were excluded from the analyses; 1059 participants were excluded by these criteria. We therefore analysed the data for 8505 participants aged 18 years or more (3828 men and 4677 women), of whom 4844 were aged 45–74 years (2210 men, 2634 women). The Appendix includes the separate results for men and women.
Prior CVD and absolute risk of a primary CVD event
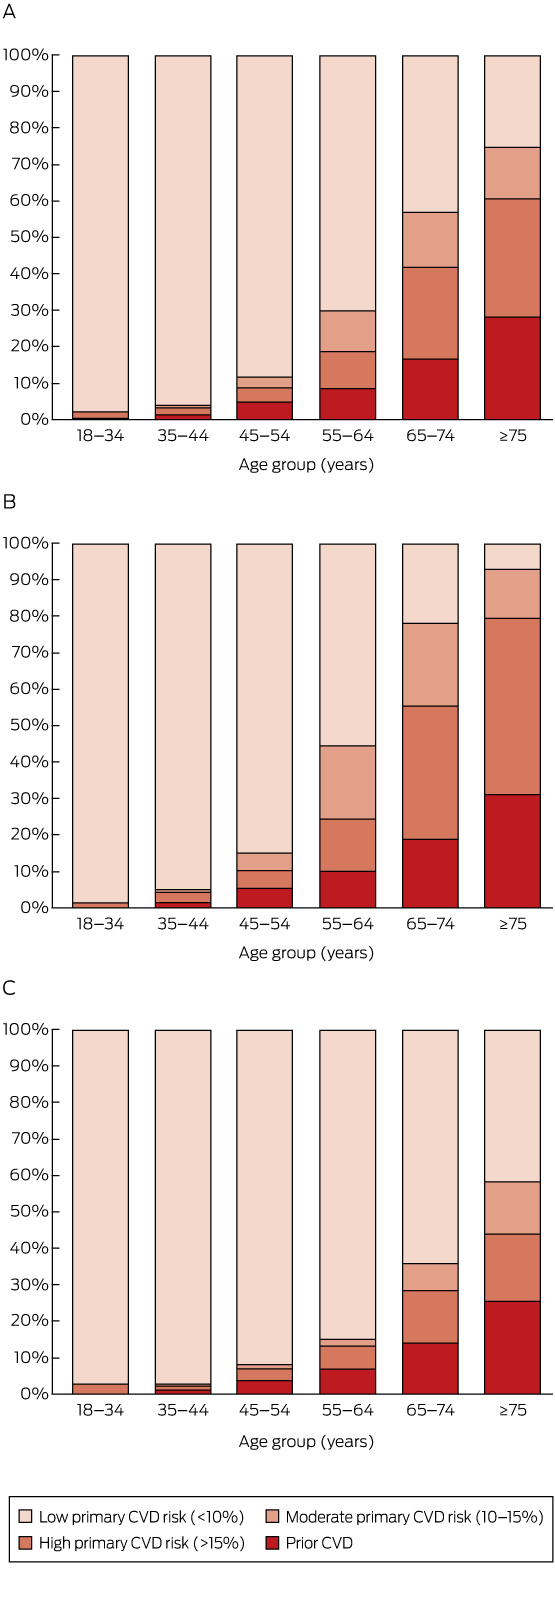
Overall, 6.2% of those aged 18 years or more (corresponding to an estimated 1 071 000 adults in Australia), including 8.7% (95% CI, 7.8–9.6%) of those aged 45–74 years (an estimated 634 000 adults), were classified as having prior CVD (Box 2).
A total of 8.2% of those aged 18 years or more (an estimated 1 412 000 adults) were at high absolute risk of a primary CVD event (Box 2). The proportion at high primary risk was 1.9% in those aged 18–44 years, and increased with age (Box 2, Box 3). Major risk factors were often present in those aged 45–74 years without prior CVD (Box 1, Appendix).
Among those aged 45–74 years, 71.5% (95% CI, 70.1–72.9%; an estimated 5 209 000 people) were at low risk of a primary CVD event, 8.6% (95% CI, 7.4–9.8%; an estimated 625 000 people) were at moderate primary risk, and 11.2% (95% CI, 10.2–12.2%; an estimated 811 000 people) were at high primary risk (Box 2).
Combining those with prior CVD and those at high risk of a primary event, an estimated 19.9% (95% CI, 18.5–21.3%) of people in Australia aged 45–74 years had a high 5-year risk of a CVD event (an estimated 1 445 000 people), including 25.8% (95% CI, 23.4–28.2%) of men (an estimated 925 000 people) and 14.2% (95% CI, 12.6–15.8%) of women (an estimated 522 000 people) in this age bracket (Box 2, Appendix). As would be expected, risk was related to major CVD risk factors (Appendix, Table S2).
BP- and lipid-lowering medications
Use of BP- and lipid-lowering medications was substantially more common in those with prior CVD and in those at higher primary risk than in those at lower risk (Box 4, Box 5; Appendix, Table S3). In those aged 45–74 years with prior CVD, 44.2% were receiving both BP- and lipid-lowering medications (an estimated 280 000 people), 35.4% were receiving only one of these medication types (an estimated 225 000 people), and 20.4% were receiving neither (an estimated 129 000 people) (Box 4).
Among people aged 45–74 years who did not have prior CVD and were at high absolute risk of a primary event, 24.3% were receiving both BP- and lipid-lowering medications (an estimated 197 000 people), 28.7% were receiving only one of these medication types (an estimated 233 000 people), and 47.1% were receiving neither (an estimated 382 000 people) (Box 4). Corresponding figures for those at moderate primary CVD risk were 13.2% (an estimated 82 000 people); 29.5% (an estimated 185 000 people); and 57.3% (an estimated 358 000 people). Of those at low primary CVD risk, 6.6% were receiving both BP- and lipid-lowering medications (an estimated 346 000 people), 18.6% were receiving only one of these medication types (an estimated 966 000 people), and 74.8% were receiving neither (an estimated 3 896 000 people) (Box 4).
Discussion
An estimated one-fifth of the Australian population aged 45–74 years, or about 1.4 million people, had a greater than 15% absolute risk of a CVD event in the next 5 years. This was made up of 11% of individuals aged 45–74 years (about 800 000 people) with a greater than 15% probability of a primary CVD event in the next 5 years, and 9% (about 630 000 people) with existing CVD. Although the risk assessment tools used have not generally been validated outside this age range, our data also suggest that around 2.6% of the population aged 18–44 years (about 230 000 people) and 60.6% of those aged 75 years or more (about 850 000 people) were at high absolute risk of a future CVD event. Levels of absolute CVD risk were higher for men than for women; risk also increased markedly with age.
The Australian NVDPA algorithm uses global CVD (which encompasses coronary heart disease, cerebrovascular disease, peripheral vascular disease and heart failure) as its predicted outcome.14 For more than a decade, Australian national guidelines have recommended lipid-lowering therapies for those at high absolute CVD risk, and consideration of absolute CVD risk in the management of hypertension.15,16 The 2012 NVDPA guidelines recommend combination treatment with BP- and lipid-lowering medications unless contraindicated or clinically inappropriate, together with lifestyle advice, for those with a 5-year primary CVD risk of more than 15%; it advises considering combination treatment for those at moderate risk (5-year primary CVD risk of 10–15%) if 3 to 6 months of lifestyle intervention does not reduce risk sufficiently, or if certain risk factors are present, such as a family history of premature CVD.7 Recently, United Kingdom and United States guidelines have changed from recommending lipid-lowering treatment for those with a 10-year CVD risk of 20% or greater (roughly equivalent to the Australian moderate and high risk categories) to recommending it for individuals with 10-year CVD risks of 10% (UK)9 or 7.5% (US)8 or greater.
We were unable to identify any previous studies that had profiled absolute global CVD risk for a national population, integrating representative information on the absolute risk of primary and secondary CVD events, and treatment with BP- and lipid-lowering medications. A recent article reported that 15.5% of the US population aged 20–79 years was at high absolute risk of a future coronary heart disease event (rather than global CVD event) within 10 years according to the US Adult Treatment Panel (ATP) III guidelines.17 Although CVD absolute risk is likely to vary by population and over time, these US results on coronary heart disease are comparable with our findings that 6.2% of those aged 18 years or more have prior CVD of any kind, and that 13.0% have at least a 10% primary risk of global CVD over the next 5 years.17,18
About half of those with prior CVD aged 45–74 years and one-quarter of those with a 5-year primary CVD risk above 15% were receiving both BP- and lipid-lowering medications, compared with one in 15 of those at low primary risk. This indicates that these medications were, to some extent, being targeted. At the same time, large opportunities for improvement in treatment are apparent, especially in the younger age group: 76% of individuals aged 45–74 years and 88% of individuals aged 45–59 years with a 5-year primary CVD risk greater than 15% were not receiving combination BP- and lipid-lowering treatment.
Applying our estimates to the general population in 2011–12, an estimated 510 000 individuals aged 45–74 years in Australia were at high risk of primary CVD or had prior CVD and were receiving neither BP-lowering nor lipid-lowering medications; a further 460 000 in these groups were receiving only one of the two medication types. This suggests that up to 970 000 people, or 13% of the Australian population aged 45–74 years, have a 5-year risk of a CVD event greater than 15% and are not receiving currently recommended combination BP- and lipid-lowering therapies. A further 620 000 people are at moderate absolute risk of CVD, with about 540 000 not receiving combination BP- and lipid-lowering therapies.
BP- and lipid-lowering treatments were the focus of our analyses because they are the main treatments for preventing CVD events, and are indicated in both primary and secondary prevention. Additional medications, including anti-platelet agents, are recommended for individuals with existing CVD. The treatment gaps we have identified are therefore likely to be underestimates.
The general findings that BP- and lipid-lowering treatment was more common among those at high risk than in those at low risk, and that there were considerable gaps in treatment, are broadly consistent with findings from earlier clinical and non-representative studies, despite the generally higher levels of CVD risk in these samples.19,20 These studies found that 40–75% of patients with existing CVD were receiving both BP- and lipid-lowering therapies,21-23 consistent with the 44% combined treatment rate we found. Also consistent are primary care data from Australia and New Zealand which indicate that about one-quarter of those with a 5-year primary risk of 15% or more are taking combination BP- and lipid-lowering treatments.19,20,22
Our findings concern the general population, a substantial proportion of whom are receiving treatment likely to influence their CVD risk and risk factors. The Framingham Risk Equation is aimed at treatment-naive individuals and will tend to underestimate risk in those receiving treatment. Ideally, absolute CVD risk should be assessed before commencing treatment; however, this is not practical for a population-based sample of this type. It is not possible to reliably ascertain the underlying prior absolute CVD risk status of those who are being treated with BP- and/or lipid-lowering medications and who are assessed as being at low or moderate absolute CVD risk, as they may have moved to a lower risk category because of changes in BP and/or blood lipid profiles. Further, treatment with BP- and lipid-lowering medication is still recommended in some contexts for individuals with abnormalities in single risk factors. Consequently, while lipid-lowering treatments are not recommended for those at low CVD risk, data from our study are relatively uninformative with regard to potential overtreatment in this group.
The gap between current guideline-recommended treatment and the use of BP- and lipid-lowering medications we describe is likely to be related to a number of factors, including the extent of absolute risk-based CVD assessment, appropriate prescribing and uptake, and continuation of treatment. In Australia, CVD risk assessment is recommended from age 45 for the general population and from age 35 for people of Aboriginal and/or Torres Strait Islander background.7 The fact that more than 97% of individuals aged 18–44 years in our study were estimated to be at low primary CVD risk supports the current age cut-off for assessment. It is not known what proportion of the general population undergoes guideline-based absolute CVD risk assessment. Recent evidence indicates that less than half of the eligible individuals attending primary care have had a documented quantitative CVD risk assessment.20,22,23 Although BP- and lipid-lowering medications are generally well tolerated and relatively safe, it is likely that their not being used is, in some cases, the result of contraindications, adverse drug events, a lack of prescription, cost, or their being declined by the patient. Further, international summary estimates of continuation with BP-lowering medications are 42–61% and 62–79% for primary and secondary prevention of coronary heart disease respectively; corresponding figures for statins are 57% and 76%.24
The NHMS assessed CVD risk and medication using inclusive home interview-based sampling and high quality methods. Despite its large size, particularly in comparison with other representative surveys, numbers were limited and confidence intervals were wide in some subgroups. There were insufficient numbers of Aboriginal and Torres Strait Islander participants to quantify risk in this group; relevant analyses would be beneficial when appropriate data become available. The study response rate was 46.5% in the target population (those aged 45–74 years) and the study methods produced estimates representative of the general non-institutionalised Australian population. The NHMS used validated data collection tools that have inherent limitations, including a range of measures based on self-report (such as smoking status, alcohol consumption, and previous CVD). Data were lacking for some measures incorporated into the NVDPA algorithm, including familial hypercholesterolaemia and persistent proteinuria. These limitations and the under-inclusion of institutionalised participants (who are more likely to be older and to have a greater illness burden) mean that absolute CVD risk may have been underestimated, particularly in those over 74 years of age.
Implications
Our results highlight the ongoing efforts and the major opportunities for reducing the frequency of CVD events. Implementation of large scale CVD risk assessment and treatment based on absolute risk is considered to be one of the most cost-effective interventions.25 We estimate that about 870 000 individuals aged 45–74 years at moderate to high absolute risk of CVD are receiving neither BP- nor lipid-lowering therapies. Broadly speaking, lowering systolic BP by around 8 mmHg in this group would prevent an estimated 20 to 37 cardiovascular events per 1000 treated;4 an estimated 31 to 61 events would be prevented for each 1 mmol/L reduction in low-density lipoprotein cholesterol levels.26 While detailed modelling is required for accurate quantification, these findings indicate that more extensive treatment of this single risk group alone could prevent tens of thousands of CVD events in Australia.
Box 1 – Estimated distribution of cardiovascular disease (CVD) risk factors included in the National Vascular Disease Prevention Alliance algorithm for the Australian-population without prior CVD, by age group
Characteristic |
Age group (years) |
||||||||||||||
45–54 |
55–64 |
65–74 |
≥ 75 |
Total (≥ 45) |
|||||||||||
Total number |
|||||||||||||||
Smoking status |
|||||||||||||||
Never smoked |
48.1% |
48.7% |
49.6% |
48.9% |
48.7% |
||||||||||
Ex-smoker |
37.8% |
38.6% |
43.4% |
48.4% |
40.4% |
||||||||||
Current smoker |
14.1% |
12.7% |
7.0% |
2.6% |
11.0% |
||||||||||
Systolic blood pressure |
|||||||||||||||
< 120 mmHg |
49.3% |
33.3% |
21.1% |
16.6% |
35.3% |
||||||||||
120–139 mmHg |
35.9% |
40.1% |
40.9% |
40.0% |
38.6% |
||||||||||
140–179 mmHg |
14.5% |
25.6% |
35.8% |
37.6% |
24.6% |
||||||||||
≥ 180 mmHg |
0.2% |
1.0% |
2.2% |
5.7% |
1.5% |
||||||||||
Diastolic blood pressure |
|||||||||||||||
< 90 mmHg |
83.0% |
84.3% |
86.8% |
91.3% |
85.1% |
||||||||||
90–109 mmHg |
16.7% |
15.3% |
12.5% |
8.0% |
14.5% |
||||||||||
≥ 110 mmHg |
0.3% |
0.4% |
0.7% |
0.7% |
0.4% |
||||||||||
Low density lipoprotein cholesterol |
|||||||||||||||
< 2.0 mmol/L |
2.0% |
4.0% |
9.1% |
12.4% |
5.2% |
||||||||||
2.0–3.5 mmol/L |
52.5% |
47.6% |
51.7% |
59.8% |
51.6% |
||||||||||
> 3.5 mmol/L |
45.4% |
48.4% |
39.2% |
27.8% |
43.2% |
||||||||||
High density lipoprotein cholesterol |
|||||||||||||||
≥ 1.0 mmol/L |
88.7% |
89.8% |
89.7% |
91.5% |
89.6% |
||||||||||
< 1.0 mmol/L |
11.3% |
10.2% |
10.3% |
8.5% |
10.4% |
||||||||||
Total cholesterol |
|||||||||||||||
< 4.0 mmol/L |
4.7% |
6.2% |
10.8% |
15.3% |
7.6% |
||||||||||
4.0–7.5 mmol/L |
92.8% |
91.5% |
87.0% |
83.3% |
90.2% |
||||||||||
> 7.5 mmol/L |
2.5% |
2.3% |
2.2% |
1.5% |
2.2% |
||||||||||
Total cholesterol:high density lipoprotein cholesterol ratio |
|||||||||||||||
< 4.5 |
62.3% |
67.8% |
73.7% |
79.7% |
68.2% |
||||||||||
4.5–5.9 |
28.3% |
24.1% |
20.1% |
16.5% |
24.0% |
||||||||||
≥ 6 |
9.4% |
8.2% |
6.2% |
3.7% |
7.7% |
||||||||||
Diabetes |
4.7% |
8.1% |
14.5% |
11.2% |
8.4% |
||||||||||
Diabetes with microalbuminuria |
0.8% |
1.4% |
4.5% |
4.0% |
2.1% |
||||||||||
Moderate to severe chronic kidney disease |
0.1% |
0.4% |
1.7% |
6.8% |
1.3% |
||||||||||
Box 2 – Estimated proportions and numbers of individuals in the Australian population with prior cardiovascular disease (CVD), and among those without prior CVD with low, moderate or high absolute 5-year risk of a primary CVD event, by age group and sex
Age group and sex |
No prior CVD |
Prior CVD |
|||||||||||||
|
Absolute CVD risk category |
|||||||||||||||
|
Low (< 10%) |
Moderate (10–15%) |
High (> 15%) |
|||||||||||||
% [95% CI] |
N* |
% [95% CI] |
N* |
% [95% CI] |
N* |
% [95% CI] |
N* |
||||||||
Total population | |||||||||||||||
18–34 years |
97.8 [96.6–99.0] |
5271 |
0.0 [0.0–0.0] |
0 |
1.8 [0.8–2.8] |
98 |
0.4 [0.0–0.8] |
19 |
|||||||
35–44 years |
96.3 [95.2–97.4] |
3042 |
0.3 [0.0–0.6] |
9 |
2.1 [1.3–2.9] |
68 |
1.3 [0.5–2.1] |
41 |
|||||||
45–54 years |
88.4 [86.5–90.3] |
2685 |
3.0 [1.7–4.3] |
90 |
4.0 [2.7–5.3] |
121 |
4.6 [3.3–5.9] |
139 |
|||||||
55–64 years |
70.3 [67.7–72.9] |
1800 |
11.0 [8.9–13.1] |
281 |
10.2 [8.3–12.1] |
263 |
8.5 [6.7–10.3] |
218 |
|||||||
65–74 years |
43.1 [39.7–46.5] |
724 |
15.1 [12.7–17.5] |
254 |
25.4 [22.5–28.3] |
427 |
16.4 [13.9–18.9] |
277 |
|||||||
≥ 75 years |
25.6 [20.4–30.8] |
359 |
13.8 [10.8–16.8] |
194 |
32.4 [27.5–37.3] |
456 |
28.2 [23.1–33.3] |
396 |
|||||||
Total |
80.8 [80.0–81.6] |
13 923 |
4.8 [4.3–5.3] |
828 |
8.2 [7.5–8.9] |
1412 |
6.2 [5.6–6.8] |
1071 |
|||||||
Men | |||||||||||||||
18–34 years |
98.5 [97.3–99.7] |
2693 |
0.0 [0.0–0.0] |
0 |
1.4 [0.3–2.5] |
40 |
0.0 [0.0–0.0] |
0 |
|||||||
35–44 years |
95.1 [93.2–97.0] |
1492 |
0.4 [0.0–0.9] |
6 |
3.1 [1.4–4.8] |
48 |
1.4 [0.3–2.5] |
23 |
|||||||
45–54 years |
85.0 [81.7–88.3] |
1278 |
4.9 [2.5–7.3] |
74 |
4.8 [2.6–7.0] |
72 |
5.4 [3.1–7.7] |
81 |
|||||||
55–64 years |
55.5 [51.1–59.9] |
706 |
20.1 [16.0–24.2] |
256 |
14.3 [11.4–17.2] |
183 |
10.0 [7.1–12.9] |
128 |
|||||||
65–74 years |
21.9 [17.6–26.2] |
182 |
22.7 [18.8–26.6] |
188 |
36.6 [31.4–41.8] |
305 |
18.8 [14.7–22.9] |
156 |
|||||||
≥ 75 years |
7.1 [3.0–11.2] |
41 |
13.3 [9.3–17.3] |
78 |
48.5 [41.5–55.5] |
285 |
31.1 [24.6–37.6] |
183 |
|||||||
Total |
74.8 [73.5–76.1] |
6361 |
7.2 [6.2–8.2] |
615 |
11.1 [10.1–12.1] |
943 |
6.8 [5.9–7.7] |
579 |
|||||||
Women | |||||||||||||||
18–34 years |
97.1 [95.2–99.0] |
2577 |
0.0 [0.0–0.0] |
0 |
2.2 [0.5–3.9] |
59 |
0.7 [0.0–1.5] |
19 |
|||||||
35–44 years |
97.5 [96.2–98.8] |
1552 |
0.2 [0.0–0.6] |
3 |
1.2 [0.5–1.9] |
19 |
1.2 [0.2–2.2] |
19 |
|||||||
45–54 years |
91.8 [89.5–94.1] |
1405 |
1.1 [0.2–2.0] |
18 |
3.3 [1.8–4.8] |
51 |
3.8 [2.3–5.3] |
59 |
|||||||
55–64 years |
84.8 [81.6–88.0] |
1093 |
1.9 [1.1–2.7] |
26 |
6.2 [4.0–8.4] |
80 |
7.0 [5.1–8.9] |
90 |
|||||||
65–74 years |
64.0 [59.7–68.3] |
544 |
7.5 [5.1–9.9] |
64 |
14.4 [11.8–17.0] |
122 |
14.1 [10.9–17.3] |
120 |
|||||||
≥ 75 years |
41.6 [33.3–49.9] |
340 |
14.3 [9.9–18.7] |
117 |
18.5 [12.1–24.9] |
151 |
25.6 [18.1–33.1] |
210 |
|||||||
Total |
86.6 [85.6–87.6] |
7570 |
2.4 [1.9–2.9] |
210 |
5.3 [4.4–6.2] |
466 |
5.6 [4.8–6.4] |
490 |
|||||||
* N = estimated number, in thousands, of persons in each category in Australia. Weighting and missing values mean that numbers do not always sum to totals. | |||||||||||||||
Box 3 – Estimated distribution of prior cardiovascular disease (CVD) and absolute risk of a primary CVD event over the next 5 years by age group, in the total Australian population aged 18 years or more (A) and for men (B) and women (C) separately
Box 4 – Estimated proportions and numbers of individuals aged 45 or more in the Australian who were receiving blood pressure (BP)-lowering* and/or lipid-lowering† medications, according to cardiovascular disease (CVD) risk
|
No prior CVD |
Prior CVD |
Total |
|||||||||||||
|
Absolute primary CVD risk category |
|||||||||||||||
|
Low (<10%) |
Moderate (10-15%) |
High (>15%) |
|||||||||||||
% [95% CI] |
N‡ |
% [95% CI] |
N‡ |
% [95% CI] |
N‡ |
% [95% CI] |
N‡ |
% [95% CI] |
N‡ |
||||||
Population aged 45–74 years | |||||||||||||||
Lipid-lowering medication |
13.7 [11.4–16.0] |
714 |
20.1 [13.2–27.0] |
126 |
32.5 [25.9–39.1] |
265 |
55.7 [47.0–64.4] |
354 |
19.8 [17.8–21.8] |
1438 |
|||||
No lipid-lowering medication |
86.3 [83.9–88.7] |
4494 |
79.9 [73.0–86.8] |
499 |
67.5 [60.9–74.1] |
548 |
44.3 [35.5–53.1] |
281 |
80.2 [78.2–82.2] |
5842 |
|||||
BP-lowering medication |
18.1 [15.9–20.3] |
945 |
35.8 [27.1–44.5] |
223 |
44.7 [37.7–51.7] |
362 |
68.1 [60.5–75.7] |
432 |
26.6 [24.3–28.9] |
1940 |
|||||
No BP-lowering medication |
81.9 [79.7–84.1] |
4262 |
64.2 [55.5–72.9] |
401 |
55.3 [48.3–62.3] |
449 |
31.9 [24.3–39.5] |
202 |
73.4 [71.1–75.7] |
5340 |
|||||
BP- and lipid-lowering medication |
6.6 [5.1–8.1] |
346 |
13.2 [7.7–18.7] |
82 |
24.3 [18.3–30.3] |
197 |
44.2 [36.8–51.6] |
280 |
12.2 [10.6–13.8] |
889 |
|||||
Taking one medication only |
18.6 [16.2–21.0] |
966 |
29.5 [21.8–37.2] |
185 |
28.7 [22.7–34.7] |
233 |
35.4 [27.8–43.0] |
225 |
22.0 [20.1–23.9] |
1599 |
|||||
Taking neither medication |
74.8 [72.2–77.4] |
3896 |
57.3 [48.4–66.2] |
358 |
47.1 [39.9–54.3] |
382 |
20.4 [13.9–26.9] |
129 |
65.8 [63.3–68.3] |
4792 |
|||||
Population aged ≥ 75 years | |||||||||||||||
Lipid-lowering medication |
39.3 [25.5–53.1] |
142 |
30.8 [16.7–44.9] |
60 |
43.0 [30.8–55.2] |
196 |
59.7 [45.9–73.5] |
236 |
44.1 [36.6–51.6] |
621 |
|||||
No lipid-lowering medication |
60.7 [46.9–74.5] |
219 |
69.2 [55.1–83.3] |
134 |
57.0 [44.8–69.2] |
259 |
40.3 [26.5–54.1] |
160 |
55.9 [48.4–63.4] |
785 |
|||||
BP-lowering medication |
51.0 [35.3–66.7] |
184 |
56.9 [38.9–74.9] |
110 |
66.6 [58.6–74.6] |
304 |
79.1 [69.5–88.7] |
313 |
63.9 [58.0–69.8] |
899 |
|||||
No BP-lowering medication |
49.0 [33.3–64.7] |
176 |
43.1 [25.2–61.0] |
84 |
33.4 [25.3–41.5] |
152 |
20.9 [11.3–30.5] |
83 |
36.1 [30.2–42.0] |
507 |
|||||
BP- and lipid-lowering medication |
24.2 [12.9–35.5] |
87 |
28.9 [14.5–43.3] |
56 |
34.9 [24.2–45.6] |
158 |
48.3 [35.0–61.6] |
192 |
34.3 [27.8–40.8] |
482 |
|||||
Taking one medication only |
41.9 [28.8–55.0] |
151 |
30.0 [15.9–44.1] |
59 |
39.8 [28.4–51.2] |
181 |
42.3 [29.6–55.0] |
167 |
39.4 [32.2–46.6] |
555 |
|||||
Taking neither medication |
33.9 [19.7–48.1] |
121 |
41.2 [23.6–58.8] |
81 |
25.3 [16.2–34.4] |
115 |
9.4 [2.9–15.9] |
37 |
26.3 [19.7–32.9] |
369 |
|||||
* Hypertension medications includes Anatomic Therapeutic Chemical Classification C02 (antihypertensives), C03 (diuretics), C07 (beta blocking agents), C08 (calcium channel blockers) and C09 (agents acting on the renin–angiotensin system). † Lipid-lowering medications include Anatomic Therapeutic Chemical Classification C10 (lipid modifying agents, plain and combinations. ‡ N = estimated number, in thousands, of persons in each category in Australia. Weighting and missing values mean that numbers do not always sum to totals. | |||||||||||||||
Box 5 – Estimated distribution of Australians receiving blood pressure (BP)-lowering* and/or lipid-lowering† medications, by absolute risk of primary cardiovascular disease (CVD) event or prior CVD, by sex and age group
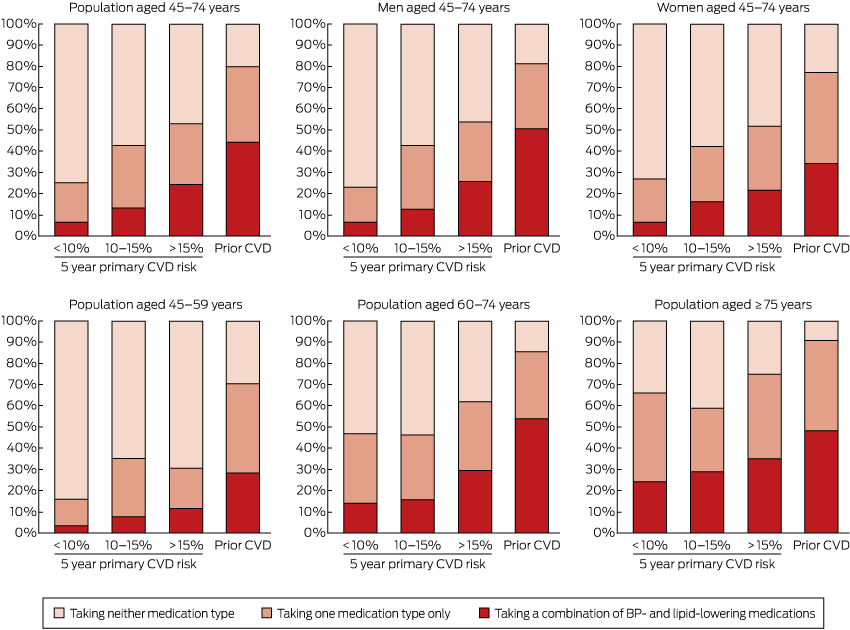
* Hypertension medications includes Anatomic Therapeutic Chemical Classification C02 (antihypertensives), C03 (diuretics), C07 (beta blocking agents), C08 (calcium channel blockers) and C09 (agents acting on the renin–angiotensin system). † Lipid-lowering medications include Anatomic Therapeutic Chemical Classification C10 (lipid modifying agents, plain and combinations.
Received 4 September 2015, accepted 13 January 2016
- Emily Banks1,2
- Simon R Crouch3
- Rosemary J Korda1
- Bill Stavreski4
- Karen Page5
- Katherine A Thurber1
- Robert Grenfell1
- 1 National Centre for Epidemiology and Population Health, Australian National University, Canberra, ACT
- 2 Sax Institute, Sydney, NSW
- 3 Melbourne School of Population and Global Health, The University of Melbourne, Melbourne, VIC
- 4 National Heart Foundation of Australia, Melbourne, VIC
- 5 Deakin University, Melbourne, VIC
This project was conducted in partnership with the National Heart Foundation of Australia, with support from a National Health and Medical Research Council of Australia (NHMRC) Partnership Project (reference 1092674) and the NHMRC Centre for Research Excellence in Medicines and Ageing (reference 1060407). Emily Banks is supported by the NHMRC (reference 1042717).
Robert Grenfell, Simon Crouch and Karen Page were employees of the National Heart Foundation of Australia at the time of analysis and writing, and participated fully as authors, independently of the funding division of the organisation. The funding sources thus had no role in the study design; collection, analysis, or interpretation of data; in the writing of the report; or in the decision to submit the article for publication.
- 1. Murray CJ, Vos T, Lozano R, et al. Disability-adjusted life years (DALYs) for 291 diseases and injuries in 21 regions, 1990-2010: a systematic analysis for the Global Burden of Disease Study 2010. Lancet 2012; 380: 2197-2223.
- 2. Lozano R, Naghavi M, Foreman K, et al. Global and regional mortality from 235 causes of death for 20 age groups in 1990 and 2010: a systematic analysis for the Global Burden of Disease Study 2010. Lancet 2012; 380: 2095-2128.
- 3. Jackson R, Lawes CM, Bennett DA, et al. Treatment with drugs to lower blood pressure and blood cholesterol based on an individual’s absolute cardiovascular risk. Lancet 2005; 365: 434-441.
- 4. Blood Pressure Lowering Treatment Trialists Collaboration, Sundstrom J, Arima H, et al. Blood pressure-lowering treatment based on cardiovascular risk: a meta-analysis of individual patient data. Lancet 2014; 384: 591-598.
- 5. Turnbull F, Arima H, Heeley E, et al. Gender disparities in the assessment and management of cardiovascular risk in primary care: the AusHEART study. Eur J Cardiovasc Prev Rehabil 2011; 18: 498-503.
- 6. New Zealand Guidelines Group. The assessment and management of cardiovascular risk. Wellington: New Zealand Guidelines Group, 2003. https://www.health.govt.nz/system/files/documents/publications/cvd_risk_full.pdf (accessed Mar 2015).
- 7. National Vascular Disease Prevention Alliance. Guidelines for the management of absolute cardiovascular disease risk. Canberra: NVDPA, 2012. https://strokefoundation.com.au/∼/media/strokewebsite/resources/treatment/absolutecvd_gl_webready.ashx?la=en (accessed Mar 2015).
- 8. Goff DC, Lloyd-Jones DM, Bennett G, et al. 2013 ACC/AHA guideline on the assessment of cardiovascular risk: a report of the American College of Cardiology/American Heart Association Task Force on Practice Guidelines. Circulation 2014; 129: S49-S73.
- 9. JBS3 Board. Joint British Societies’ consensus recommendations for the prevention of cardiovascular disease (JBS3). Heart 2014; 100 Suppl 2: ii1-ii67.
- 10. Stone NJ, Robinson JG, Lichtenstein AH, et al. 2013 ACC/AHA guideline on the treatment of blood cholesterol to reduce atherosclerotic cardiovascular risk in adults: a report of the American College of Cardiology/American Heart Association Task Force on Practice Guidelines. Circulation 2014; 129: S1-S45.
- 11. Australian Bureau of Statistics. 4363.0.55.001. Australian Health Survey: users’ guide, 2011–13 [website]. 2013. http://www.abs.gov.au/ausstats/abs@.nsf/mf/4363.0.55.001 (accessed May 2015).
- 12. Anderson KM, Wilson PW, Odell PM, et al. An updated coronary risk profile. A statement for health professionals. Circulation 1991; 83: 356-362.
- 13. D’Agostino RB, Vasan RS, Pencina MJ, et al. General cardiovascular risk profile for use in primary care: the Framingham Heart Study. Circulation 2008; 117: 743-753.
- 14. Jackson R, Kerr A, Wells S. Vascular risk calculators: essential but flawed clinical tools? Circulation 2013; 127: 1929-1931.
- 15. National Heart Foundation of Australia. Hypertension management for doctors 2004. Canberra: NHFA, 2003.
- 16. National Heart Foundation of Australia; Cardiac Society of Australia and New Zealand. Position statement on lipid management. Heart Lung Circ 2005; 14: 275-291.
- 17. Tattersall MC, Gangnon RE, Karmali KN, et al. Trends in low-density lipoprotein cholesterol goal achievement in high risk United States adults: longitudinal findings from the 1999–2008 National Health and Nutrition Examination Surveys. PLoS One 2013; 8: e59309.
- 18. Tattersall MC, Karmali KN, Gangnon RE, et al. The population effects of the global cardiovascular risk model in United States adults: findings from the National Health and Nutrition Surveys, 2005–2006. J Clin Lipidol 2011; 5: 166-172.
- 19. Mehta S, Wells S, Grey C, et al. Initiation and maintenance of cardiovascular medications following cardiovascular risk assessment in a large primary care cohort: PREDICT CVD-16. Eur J Prev Cardiol 2014; 21: 192-202.
- 20. Heeley E, Peiris DP, Patel AA, et al. Cardiovascular risk perception and evidence — practice gaps in Australian general practice (the AusHEART study). Med J Aust 2010; 192: 254-259. <MJA full text>
- 21. Peiris DP, Patel AA, Cass A, et al. Cardiovascular disease risk management for Aboriginal and Torres Strait Islander peoples in primary health care settings: findings from the Kanyini Audit. Med J Aust 2009; 191: 304-309. <MJA full text>
- 22. Webster RJ, Heeley EL, Peiris DP, et al. Gaps in cardiovascular disease risk management in Australian general practice. Med J Aust 2009; 191: 324-329. <MJA full text>
- 23. Sheppard JP, Fletcher K, McManus RJ, et al. Missed opportunities in prevention of cardiovascular disease in primary care: a cross-sectional study. Br J Gen Pract 2014; 64: e38-e46.
- 24. Naderi SH, Bestwick JP, Wald DS. Adherence to drugs that prevent cardiovascular disease: meta-analysis on 376, 162 patients. Am J Med 2012; 125: 882-887.
- 25. Vos T, Carter R, Barendregt J, et al. Assessing cost-effectiveness in prevention. ACE-Prevention. Final report. Brisbane, University of Queensland and Melbourne: Deakin University, 2010. https://public-health.uq.edu.au/filething/get/1836/ACE-Prevention_final_report.pdf (accessed Mar 2015).
- 26. Cholesterol Treatment Trialists’ (CTT) Collaborators. The effects of lowering LDL cholesterol with statin therapy in people at low risk of vascular disease: meta-analysis of individual data from 27 randomised trials. Lancet 2012; 380: 581-590.
Abstract
Objective: To quantify absolute cardiovascular disease (CVD) risk and treatment in Australian adults.
Design, participants: Cross-sectional representative study of 9564 people aged 18 years or more who had participated in the 2011–12 Australian National Health Measures Survey (response rate for those aged 45–74 years: 46.5%).
Main outcome measures: Prior CVD was ascertained and 5-year absolute risk of a primary CVD event calculated (using the Australian National Vascular Disease Prevention Alliance algorithm; categories: low [< 10%], moderate [10–15%], and high [> 15%] risk) on the basis of data on medical history, risk factors and medications, derived from interviews, physical measurements, and blood and urine samples.
Results: Absolute CVD risk increased with age and was higher among men than women. Overall, 19.9% (95% CI, 18.5–21.3%) of Australians aged 45–74 years had a high absolute risk of a future CVD event (an estimated 1 445 000 people): 8.7% (95% CI, 7.8–9.6%) had prior CVD (estimated 634 000 people) and 11.2% (95% CI, 10.2–12.2%) had high primary CVD risk (estimated 811 000 people). A further 8.6% (95% CI, 7.4–9.8%, estimated 625 000) were at moderate primary CVD risk. Among those with prior CVD, 44.2% (95% CI, 36.8–51.6%) were receiving blood pressure- and lipid-lowering medications, 35.4% (95% CI, 27.8–43.0%) were receiving only one of these, and 20.4% (95% CI, 13.9–26.9%) were receiving neither. Corresponding figures for high primary CVD risk were 24.3% (95% CI, 18.3–30.3%); 28.7% (95% CI, 22.7–34.7%); and 47.1% (95% CI, 39.9–54.3%).
Conclusions: About one-fifth of the Australian population aged 45–74 years (about 1.4 million individuals) were estimated to have a high absolute risk of a future CVD event. Most (estimated 970 000) were not receiving currently recommended combination blood pressure- and lipid-lowering therapy, indicating substantial potential for health gains by increasing routine assessment and treatment according to absolute CVD risk.