


Katherine Hospital services a very large (340 000 km2) and remote tropical region in northern Australia. The population of the region (20 000 people, 51% of whom are Aboriginal) is centred on the town of Katherine, 320 km southeast of Darwin.
As with all hospitals, frequent attenders (FAs) to the emergency department (ED) represent a significant proportion of the acute care workload. Local and international medical literature has defined FAs as patients who present to an ED between four and six times within a year;1,2 associations with homelessness, poverty, alcohol misuse and chronic illness have been documented.3-7 This literature, however, is predominantly focused on urban and non-tropical environments, and problems specific to northern Australian hospitals have not been investigated.
Severe and chronic homelessness is a major problem for Aboriginal people in the Northern Territory. It is closely coupled with social determinants of health and complicated by the harsh and remote environment. More than 7% of Aboriginal people in the region are considered homeless, a rate that is about 15 times the national average.8 Services for homeless people in the region are limited, in terms of both crisis and longer term accommodation, as well as with regard to access to food and hygiene facilities.
There is evidence that ED-based social interventions for FAs and homeless people, including providing housing and case management, reduce the number of presentations to EDs.9-11 Australian research suggests that providing specific non-emergency interventions targeted at FAs can reduce the burden of overcrowding for EDs.12
We aimed to identify factors, unrelated to chronic health problems, that contribute to frequent presentation to Katherine Hospital, which serves a young Aboriginal population with very high rates of homelessness, significant burdens of disease associated with poverty and poor housing, and limited access to services that provide safe housing.
Methods
Study design and setting
We performed a non-matched case–control study that included all adult patients who presented to Katherine Hospital ED between 1 January and 31 December 2012. During this period, a total of 8340 people were seen in 14 895 separate ED presentations. Ethics approval for the study was granted by the Human Research Ethics Committee of the Menzies School of Health Research (reference, 2013-2096).
Selection of cases and controls
The required case sample size for the study was calculated as being 137 patients; this was adequate to detect an effect size yielding an odds ratio (OR) of at least 2.0 with α = 0.05 and a power of 0.8.
The electronic patient database (Caresys) was used to identify all patients presenting to the ED during 2012. Cases were defined as those with six or more presentations during that period. A single presentation episode was randomly selected from all the presentations by an FA, and clinical and non-clinical data were extracted from the hospital electronic records for that single presentation.
The study excluded those with chronic health problems associated with a predictable need for multiple presentations. Exclusion criteria included patients needing peritoneal or haemodialysis, ambulatory care (including wound dressings, follow-up of test results, medication administration, and device management), obstetric patients, and those with chronic severe health conditions resulting in end-stage renal, hepatic, cardiac, respiratory or endocrine dysfunction or active malignancy.
We restricted our sample to residents of the NT to reduce a possible bias in the control population (high frequency of tourists during the dry season). As our focus was the adult population, we also excluded patients under the age of 18 years.
Unmatched controls were randomly selected (1:1) from the 5376 individuals who presented to the Katherine Hospital ED only once during the study period and who did not meet the exclusion criteria. Controls were not matched to cases, as we aimed to compare all differences in environmental, demographic and social variables between the two groups.
Ascertainment of risk factors and exposures
Patient data collected included age, sex, Indigenous status, alcohol intake and violence relevant to the presentation, triage score, discharge destination (admitted to ward or discharged from ED), and medical diagnosis (International Statistical Classification of Diseases, 10th revision, Australian modification [ICD-10-AM] categories). Records were linked with hospital mortality data, which were available to January 2015.
Living arrangements were classified as residential, homeless, or out-of-town; the last category included people visiting Katherine, predominantly from remote communities in the region, but also visitors from other NT towns.
Historical weather data were obtained from the Australian Bureau of Meteorology: rainfall (mm) on the day of presentation, and during the preceding 7 and 30 days, and minimum and maximum temperatures on the day of presentation. For analysis, the data were coded as dichotomous variables: rainy day (yes v no), minimum temperature under 12°C (yes v no) and maximum temperature over 38°C (yes v no).
Analysis
We performed our analysis with Stata 13.0 (StataCorp). We used simple unpaired two-sided t tests (continuous data) and χ2 tests (categorical data) to compare differences in exposures for the case and control groups. Fisher exact tests were used to compare triage categorisation in the two groups. Statistical significance was defined as P < 0.05. We performed individual, unadjusted logistic regression analyses of each social and weather variable to assess the association between each exposure and subsequent admission to hospital and the likelihood of frequent presentation to the Katherine Hospital ED. Interactions between individual variables were tested by regression analysis.
A backwards stepwise logistic regression model was used to identify factors that predicted frequent presentation to the Katherine Hospital ED; the individual significance of each variable to be included in the model was set at P < 0.20.
Results
A total of 227 individuals were classified as FAs; they made 1948 ED presentations, or 13% of all ED presentations for the year. Ninety FAs met our exclusion criteria, leaving 137 cases for the study. The number of presentations by each FA during the 12 months ranged between six (47 patients) and 27 (1 patient), with the distribution skewed to the lower end of the distribution. A total of 137 FA cases and 136 controls were included in the study.
The age and sex characteristics of the FAs and controls were similar (Box 1). There was a statistically significant difference between groups in terms of homelessness (OR, 16.44; P < 0.001) and unstable living conditions (homeless or out-of-town) (OR, 3.02; P < 0.001). The proportion of individuals who identified as Aboriginal also differed between the two groups (OR, 2.16; P < 0.001), as did the proportion of presentations in which alcohol use was involved (OR, 2.77, P = 0.001). Although presentations by 15.3% of FAs involved violence, compared with 10.1% in the control group, this difference was not statistically significant (P = 0.189).
The type of clinical presentation as defined by the presenting complaint was somewhat heterogeneous, with different patterns for FAs and controls (Box 2). Triage classification was statistically different between the two groups (P = 0.004). While there were more category 1 presentations by controls (nine controls v one case), there were also more category 4 presentations (94 controls v 79 cases); there were more category 3 presentations by FA compared to controls (41 cases v 23 controls) (Box 1). Two-year mortality in the case group was 7.3% (ten deaths) and 2.8% (four deaths) in the control group; this difference was not statistically significant (P = 0.094).
FAs were more likely than controls to be admitted to hospital as a result of their presentation, although the difference was not statistically significant (OR, 1.63; P = 0.09). Aboriginal people (P = 0.004) and those who were homeless or had insecure housing (P = 0.04) were significantly more likely to be admitted. There was no association between admission status and cold weather, but patients in both groups were more likely to be admitted during hot weather (P = 0.007). There was no difference between groups with respect to temperature or rainfall on the day of attendance.
The results of unadjusted logistic regression analysis of social variables were consistent with these findings. Alcohol was more likely to be involved in presentations by FAs (OR, 2.84; P = 0.002); FAs were more likely to identify as Aboriginal (OR, 3.93; P < 0.001), and to be homeless (OR, 20.4; P < 0.001) or from out of town (OR, 1.95; P = 0.019). There were no statistically significant differences between cases and controls for age, sex or the involvement of violence. Unadjusted logistic regression analysis of annual weather variables (baseline: August, in the dry season) indicated that presentations by FAs were particularly frequent in February (OR, 6.07; P = 0.012). Frequent presentation was more likely during the hot and wet season and on rainy days, but neither association was statistically significant (Box 3, Box 4).
There were no statistically significant interactions between the number of rainy days, homelessness, Indigenous status, and alcohol involved in presentation with respect to frequent presentation. Compared with FAs who had secure housing, FAs who were homeless presented more frequently on a rainy day (OR, 31.7; P = 0.001) than did those who were from out of town (OR, 2.3; P = 0.009), although no statistically significant interaction between the two variables was identified. For FAs there were no statistically significant interactions between rainy day and Indigenous status, rainy day and alcohol contributing to presentation, Indigenous status and alcohol, or homelessness and alcohol.
Backwards stepwise logistic regression indicated that the following variables predicted frequent presentation: Aboriginal status, alcohol use as contributing factor, homelessness, and rainfall on the day of presentation (pseudo-R2 = 0.18; P < 0.001) (Box 5). When tested independently, alcohol use was positively associated with frequent presentation (OR, 2.84; P = 0.002); however, in the regression model this association was attenuated by the joint inclusion of alcohol and Aboriginal status (OR, 1.54; P = 0.238), joint inclusion of alcohol and homelessness (OR, 1.05; P = 0.92); the association was reversed when homelessness and Aboriginal status were both included (OR, 0.47; P = 0.155). None of these findings were statistically significant.
Discussion
This is the first robustly designed case–control study to have clearly defined a group of FAs to a hospital ED without a unifying clinical reason for their frequent presentations. For each FA, we randomly selected a single instance from their presentations over a 12-month period, and compared their clinical and non-clinical variables with those of a control group. This rigorous study design minimised the possibility of confounding and bias, and provided clear insights into reasons for frequent presentations to the hospital by certain individuals. It is also the first study to examine the problems associated with FAs in a tropical Australian region with a large Aboriginal population.
Our study identified a very strong association between frequent ED attendance and each of homelessness and Aboriginal identity, and also a strong association with alcohol (but not violence) as a contributor to the presentation. It is not surprising that being Aboriginal was predictive of frequent presentation, as this group is overwhelmingly affected by homelessness, an association clearly identified as a predictor of frequent attendance by previous studies.2-8
Our results also confirm that presentations by FAs are for genuine acute clinical reasons; although the pattern of triage categories differed between the case and control groups, diagnoses at presentation and rates of admission to hospital were similar. FAs present to ED with genuine clinical needs.
Alcohol is a significant contributor to morbidity and mortality among FAs. However, the effect of the role of alcohol in contributing to the presentation disappeared when both homelessness and Aboriginal status were included in the regression analysis model. This implies that FAs presenting to the ED who are neither Aboriginal nor homeless may have a higher burden of alcohol-related harm than Aboriginal or homeless FAs, who undoubtedly also suffer alcohol-related harm. Further statistical exploration of this phenomenon revealed that the change in the shape of association with frequent attendance was mainly explained by the interaction between alcohol use and homelessness.
The predictive value of weather is more complex. The tropical weather of the Top End of the NT is extreme: the build-up season from October to December, characterised by very hot and humid weather; monsoonal rains from January to March; and the dry season from April to September.
Logistic regression analysis indicated that the effect of the only weather variable predictive of frequent presentation (rain) was only weak. There was a statistically significant spike in presentations by FAs during February, a particularly hot and wet time of the year. It is possible that such weather leads to homeless people attending hospital for shelter, although studies from non-tropical areas have not found such an association.13 It is more likely, particularly given that admission rates for both cases and controls were higher during hotter months, that tropical weather contributes to acute illness that leads to presentation, consistent with local and international research in whole populations.14,15
FAs were responsible for 13% of all ED presentations to this hospital. As these presentations were for genuine emergency medical care, the reasons for an annual death rate among FAs not meeting the exclusion criteria for our study that was 6.8 times as high as the national average16 need to be understood. Although the difference between mortality rates for cases and controls in our small study did not achieve statistical significance, it is likely that FAs have higher age-adjusted mortality rates. Further research is needed to confirm this, and interventions that target the root causes of poor health outcomes for FAs should be offered and evaluated. This includes hospitals recognising the unmet needs of FAs, ensuring that treatable medical problems are diagnosed, and mitigating social and other risks during presentation to an ED.
As a result of our study, Katherine Hospital is instituting a targeted intervention for FAs. Patients presenting to the ED on more than five occasions in the past year will trigger a Frequent Presenter Pathway, with pre-discharge review by an FA team, in which social, medical, and drug and alcohol problems will be identified and addressed.
Limitations to our study include the fact that there were only small numbers of FAs at this hospital, limiting the capacity to detect statistically significant interactions between the analysed characteristics. This study also excluded FAs with chronic health conditions, whose clinical presentations and outcomes are probably different but no less valid than those of the patients in this study. This study did not examine all the variables likely to contribute to frequent attendance, including social and cultural variables (such as events causing remote residents to visit town), access to motor vehicles, financial influences (such as welfare and royalty payments), and environmental variables other than weather (such as bushfire smoke). Clinical data were collected from the patients’ electronic records, and these may not have been complete. True rates of homelessness have probably been under-estimated in this study, as our estimate is based on hospital data that do not include definitions of overcrowded housing and other factors contributing to accommodation instability.
Homelessness in the NT is often referred to as “long-grassing”. This term subtly implies that homelessness is a cultural or lifestyle choice, but there is really no choice involved in the situations in which these people find themselves. The term suggests that homelessness is a contemporary cultural norm for Aboriginal people in the NT. There are a core group of chronically homeless people in fringe-dwelling communities with poor access to services. Many remote Aboriginal people visiting town for social and other needs find themselves temporarily homeless. Adding to this complex situation in other parts of northern Australia is a push to defund and effectively close remote Aboriginal communities, actions that could acutely worsen the situation. The core problem is a lack of housing and accommodation options for rural and remote Aboriginal people.
For towns where homelessness and alcohol misuse are as pervasive as in the Katherine region, there is an ongoing need to redress the root problems by implementing evidence-based alcohol harm minimisation strategies,17 establishing innovative facilities for homeless people that deliver the necessary hygiene and basic environmental protection, and providing greater access to appropriate accommodation. Such measures could reduce the burden of acute presentations to local hospitals, and improve their dignity, so that homeless Aboriginal people may possibly begin to heal.
Box 1 – Demographic and clinical characteristics of the cases (frequent presenters) and controls
Frequent attenders |
Controls |
P |
|||||||||||||
Number of patients |
137 |
136 |
|||||||||||||
Age, years |
42.9 (SD, 15.2) |
40.8 (SD, 16.7) |
0.295 |
||||||||||||
Sex (female) |
57.7% |
52.2% |
0.272 |
||||||||||||
Aboriginal |
70.8% |
53.0% |
< 0.001 |
||||||||||||
Living arrangements |
|||||||||||||||
Unstable (homeless or out-of-town) |
48.1% |
23.7% |
< 0.001 |
||||||||||||
Homeless |
19.7% |
1.4% |
< 0.001 |
||||||||||||
Alcohol as contributing factor |
25.6% |
10.8% |
0.001 |
||||||||||||
Violence as contributing factor |
15.3% |
10.1% |
0.189 |
||||||||||||
Triage category |
|||||||||||||||
1 |
1 |
9 |
0.004 |
||||||||||||
2 |
7 |
7 |
|||||||||||||
3 |
41 |
23 |
|||||||||||||
4 |
79 |
94 |
|||||||||||||
5 |
9 |
3 |
|||||||||||||
Mortality at 2 years |
7.3% |
2.9% |
0.094 |
||||||||||||
SD = standard deviation. | |||||||||||||||
Box 2 – Presentation diagnoses for 137 frequent attenders and 136 controls
Presentation diagnosis |
Frequent attenders |
Controls |
|||||||||||||
Cardiology (chest pain, arrhythmia) |
9 |
9 |
|||||||||||||
Endocrinology (diabetes) |
1 |
0 |
|||||||||||||
Ear/nose/throat and eye (eye injury or symptom, tonsillitis, otitis externa or interna) |
7 |
10 |
|||||||||||||
Gastrointestinal (diarrhoea/vomiting, pancreatitis, gastrointestinal bleed, gastroenteritis, hepatitis) |
7 |
5 |
|||||||||||||
Infection (undifferentiated infection, cellulitis) |
10 |
8 |
|||||||||||||
Neurology (stroke, dizziness, headache, seizure: including in contact of alcohol) |
10 |
7 |
|||||||||||||
Pain (as predominant complaint; diagnosis unclear) |
30 |
39 |
|||||||||||||
Psychiatric (not including intoxication) |
3 |
0 |
|||||||||||||
Respiratory (asthma, chest infection, shortness of breath) |
19 |
12 |
|||||||||||||
Surgical (appendicitis, abscess, foreign body; not eye) |
1 |
2 |
|||||||||||||
Trauma and assault |
9 |
13 |
|||||||||||||
Urological or renal (urinary tract infection, pyelonephritis, renal calculi, retention) |
2 |
5 |
|||||||||||||
Wound |
12 |
5 |
|||||||||||||
Alcohol intoxication (as the sole reason for presentation) |
7 |
4 |
|||||||||||||
Other (social reasons, medical certificates, other non-medical reasons) |
10 |
17 |
|||||||||||||
Box 3 – Odds ratio for presentation to the emergency department of Katherine Hospital by frequent attenders, by month, compared with monthly rainfall data*
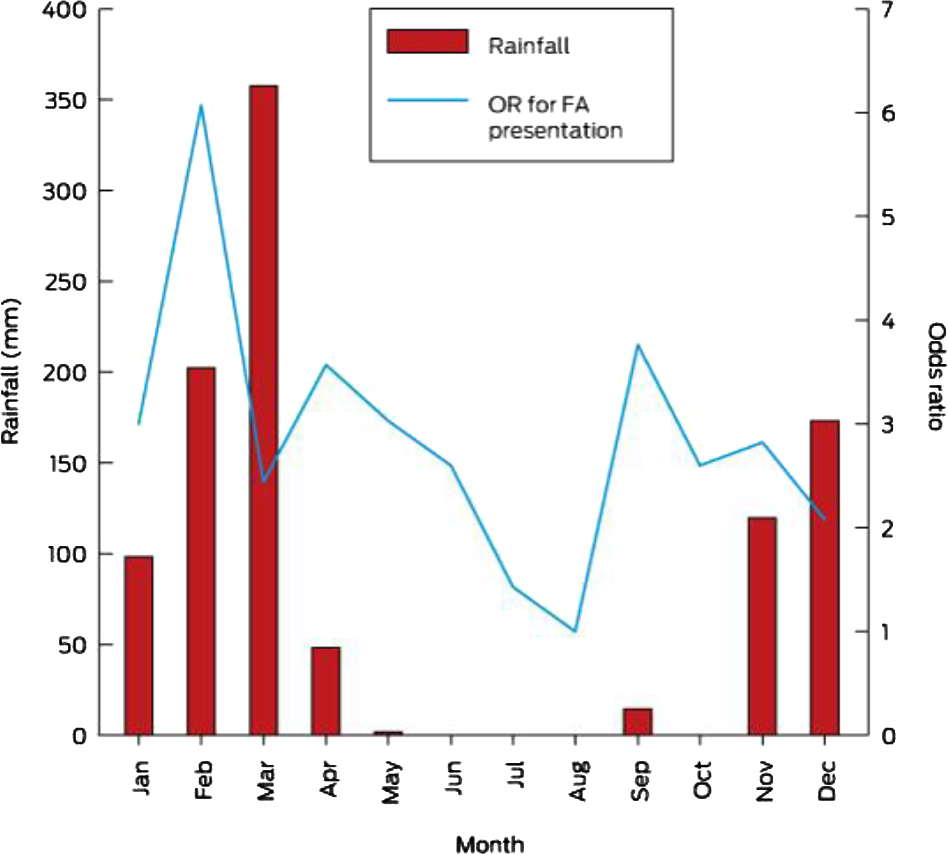
* Reference month for odds ratios is August.
Box 4 – Odds ratio for presentation to the emergency department of Katherine Hospital by frequent attenders, by month, compared with monthly temperature data*
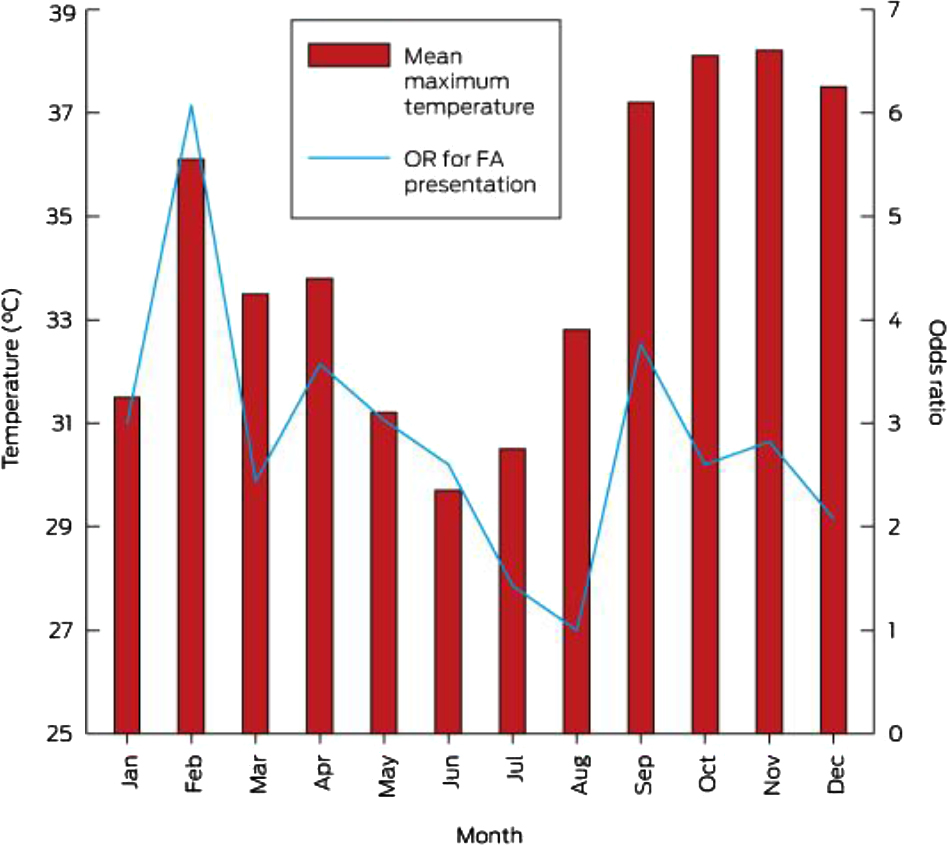
* Reference month for odds ratios is August.
Box 5 – Backwards stepwise logistic regression of frequent presenters to the emergency department of Katherine Hospital
Presentation characteristics |
Odds ratio (95% CI) |
P |
|||||||||||||
Aboriginal |
2.06 (1.41–2.84) |
< 0.001 |
|||||||||||||
Alcohol involved in presentation |
0.46 (0.16–1.34) |
0.154 |
|||||||||||||
Homeless |
14.17 (2.98–67.43) |
0.001 |
|||||||||||||
Rain on day |
1.55 (0.78–3.07) |
0.212 |
|||||||||||||
Constant |
0.37 (0.23–0.58) |
0.001 |
|||||||||||||
Model: Frequent attender = 0.37 + 2.01(Aboriginal) + 0.46(alcohol) + 14.17(homeless) + 1.55(rain on day). Model statistics: likelihood ratio (χ2[4] = 50.51; overall probability, P < 0.001; pseudo-R2 = 0.18. | |||||||||||||||
Received 3 June 2015, accepted 29 October 2015
- Simon Quilty1,2
- Geordan Shannon3
- Anthony Yao4
- William Sargent5
- Michael F McVeigh6
- 1 Katherine Hospital, Katherine, NT
- 2 Menzies School of Health Research, Darwin, NT
- 3 University College London, London, UK
- 4 Austin Hospital, Heidelberg, VIC
- 5 Royal Darwin Hospital, Darwin, NT
- 6 Geelong Hospital, Melbourne, VIC
No relevant disclosures.
- 1. Moore G, Gerdtz M, Manias E, et al. Socio-demographic and clinical characteristics of re-presentation to an Australian inner-city emergency department: implications for service delivery. BMC Public Health 2007; 7: 320.
- 2. Koskela TH, Rynanen OP, Soini EJ. Risk factors for persistent frequent use of the primary health care services among frequent attenders: a Bayesian approach. Scand J Prim Health Care 2010; 28: 55-61.
- 3. Dent AW, Phillips GA, Chenhall AJ, McGregor LR. The heaviest repeat users of an inner city emergency department are not general practice patients. Emerg Med (Fremantle) 2003; 15: 322-329.
- 4. Liu SW, Nagurney JT, Chang Y, et al. Frequent ED users: are most visits for mental health, alcohol and drug related complaints? Am J Emerg Med 2013; 31: 1512-1515.
- 5. Mandelberg JH, Kuhn RE, Kohn MA. Epidemiologic analysis of an urban, public emergency department’s frequent users. Acad Emerg Med 2000; 7: 637-646.
- 6. Geurts J, Palatnick W, Strome T, Weldon E. Frequent users of an inner-city emergency department. Can J Emerg Med 2012; 14: 306-313.
- 7. DiPietro BY, Kindermann D, Schenkel SM. Ill, itinerant, and insured: the top 20 users of emergency departments in Baltimore city. Sci World J 2012; 2012: 726598.
- 8. Australian Bureau of Statistics. Census of population and housing: estimating homelessness, 2011. Canberra: ABS, 2012. (Cat. No. 2049.0). http://www.ausstats.abs.gov.au/Ausstats/subscriber.nsf/0/EB59F237159F7102CA257AB100170B61/$File/20490_2011.pdf (accessed Nov 2015).
- 9. Sadowski LS, Kee RA, VanderWeele TJ, Buchanan D. Effect of a housing and case management program on emergency department visits and hospitalizations among chronically ill homeless adults: a randomized trial. JAMA 2009; 301: 1771-1778.
- 10. Althaus F, Paroz S, Hugli O, et al. Effectiveness of interventions targeting frequent users of emergency departments: a systematic review. Ann Emerg Med 2011; 58: 41-52.
- 11. Tadros AS, Castillo EM, Chan TC, et al. Effects of an emergency medical services-based resource access program on frequent users of health services. Prehosp Emerg Care 2012; 16: 541-547.
- 12. Kirby SE, Dennis SM, Jayasinghe UW, Harris MF. Frequent emergency attenders: is there a better way? Aust Health Rev 2011; 35: 462-467.
- 13. Brown AJ, Goodacre SW, Cross S. Do emergency department attendances by homeless people increase in cold weather? Emerg Med J 2010; 27: 526-529.
- 14. Cheng AC, Jacups SP, Gal D, et al. Extreme weather events and environmental contamination are associated with case clusters of melioidosis in the Northern Territory of Australia. Int J Epidemiol 2006; 35: 323-329.
- 15. Williams S, Nitschke M, Weinstein P, et al. The impact of summer temperatures and heatwaves on mortality and morbidity in Perth, Australia 1994–2008. Environ Int 2012; 40: 33-38.
- 16. Australian Bureau of Statistics. 3302.0 – Deaths, Australia, 2014. Dec 2015 [website]. (Cat. No. 3302.0.) http://www.abs.gov.au/ausstats/abs@.nsf/mf/3302.0 (accessed Dec 2015).
- 17. Room R, Babor T, Rehm J. Alcohol and public health. Lancet 2005; 365: 519-530.
Abstract
Objectives: To determine the clinical and environmental variables associated with frequent presentations by adult patients to a remote Australian hospital emergency department (ED) for reasons other than chronic health conditions.
Design: Unmatched case–control study of all adult patients attending Katherine Hospital ED between 1 January and 31 December 2012.
Participants: Cases were defined as frequent attenders (FAs) without a chronic health condition who presented to the ED six or more times during the 12-month period. A single presentation was randomly selected for data collection. Controls were patients who presented on only one occasion.
Outcome measures: Basic demographic data were collected, including clinical outcomes, Indigenous status, living arrangements, and whether alcohol and violence contributed to the presentation. Environmental variables were extracted from the Bureau of Meteorology database and mapped to each presentation.
Results: FAs were much more likely to be homeless (odds ratio [OR], 16.4; P < 0.001) and to be Aboriginal (OR, 2.16; P < 0.001); alcohol as a contributing factor was also more likely (OR, 2.77; P = 0.001). FAs were more likely to present in hotter, wetter weather, although the association was statistically weak. Clinical presentations by cases and controls were similar; the annual death rates for both groups were high (3.6% and 1.5%, respectively).
Conclusions: There was a strong association between FA and Aboriginal status, homelessness and the involvement of alcohol, but alcohol was more likely to contribute to presentation by non-Aboriginal FAs who had stable living conditions. FAs and non-FAs had similar needs for emergency medical care, with strikingly higher death rates than the national average in both groups. As a result of this study, Katherine Hospital has initiated a Frequent Attender Pathway that automatically triggers a dedicated ED service for those at greatest clinical risk. Homelessness is a serious problem in the Northern Territory, and is associated with poor health outcomes.