


Asthma is one of the most common chronic diseases in Australia, affecting 10% of the population1 and is a National Health Priority Area. Despite this, there is a widespread perception that it is no longer a problem in Australia, especially as asthma mortality has fallen by 70% from its peak in the 1980s. Asthma mortality in this country nevertheless remains high by international comparisons, particularly in young people (those aged 5–34 years).1 Further, asthma was the seventh-highest cause of years lived with disability in Australasia in 2010.2
Since 1989, Australia has taken a lead in developing and updating clinical practice guidelines for asthma. In March 2014, the new national guidelines3 were launched, and effective asthma control was affirmed as the key goal of treatment. Consistent with international recommendations,4,5 two domains of asthma control are now assessed: symptom control and the future risk of adverse outcomes, such as flare-ups (exacerbations). Asthma control is also one of the recommended National Asthma Indicators for monitoring asthma in Australia.6
To improve clinical practice and asthma policy, reliable population-based data on asthma control in Australia are needed. While statistics for several asthma indicators are available, including prevalence, general practice encounters, hospitalisations and mortality,1 there is little information on measures of asthma control. A recent review could find no population-level Australian data for validated composite measures of asthma control, such as the Asthma Control Test (ACT). Even the most recent population-based surveys of individual asthma control measures were conducted more than 10 years ago.7
Population-based data would also enable the impact of asthma treatment to be assessed. Asthma-related expenditure in Australia during the 2008–09 financial year was $655 million, of which 50% was spent on prescription pharmaceuticals.8 Preventer medications for asthma, such as inhaled corticosteroids (ICS) alone or in combination with long-acting β2-agonists (LABA), are subsidised by the Pharmaceutical Benefits Scheme (PBS), but analysis of PBS data1 indicates that they are prescribed at much higher doses and in more expensive combination formulations than necessary,3 and are also prescribed together with antibiotics for short-term respiratory conditions.9Further, of adults who are dispensed any preventer medication, only 9%–30% have it dispensed as often as would be consistent with minimal regular use.1 These data indicate that there are substantial quality problems in Australia with respect to both the prescribing and use of preventer medications.
Past gold standard approaches to population studies involved random-digit dialling and postal surveys of randomly selected participants. The declining ownership of telephone landlines in Australian homes, however, and survey participation rates below 30% (eg, in the study by Toelle and colleagues10) have increased the risk of both selection and response biases. Internet access is rapidly increasing across the socioeconomic spectrum, and there is growing interest in well designed, rigorously reported web-based surveys to minimise these problems.11
The aim of our study was to establish the relationship between control of asthma symptoms, medication use and health care utilisation by Australians aged 16 years and over with current asthma.
Methods
Study design and ethics
We undertook a cross-sectional web-based survey of adult Australians with current asthma (details [Checklist for Reporting Results of Internet E-Surveys, CHERRIES] in Appendix 1). Ethics approval was obtained from the Human Research Ethics Committee, Concord Hospital, NSW. All participants provided informed consent.
Inclusion criteria and recruitment
The target population was Australians aged 16 years and over with current asthma. Participants were recruited from an online panel of 224 898 people provided by Survey Sampling International (Melbourne, Australia). To minimise response bias, a three-stage randomised selection process was used: (i) panel members were randomly invited to take a survey, without specifying the topic of the survey; (ii) respondents were shown initial randomly selected profiling questions that included one which asked whether they had ever experienced any of several health conditions, including asthma; and (iii) those responding that they had experienced asthma were asked two questions, similar to those in the Australian Health Survey, to identify those with “current asthma”: “Have you ever been told by a health professional that you have asthma?” and “Have you had symptoms of asthma or taken medication for asthma in the last 12 months?” Those who responded “Yes” to both questions were included in the study sample. Recruitment was stratified by sex, age and state of residence, according to Australian data for people with asthma (2011–12 Australian Health Survey).12 Participants received “points” to a value of about $1.50 from the panel provider.
Questionnaire
The design of the survey instrument was based on information drawn from relevant scientific publications, qualitative research, and professional health care reviews; it was then cognitively tested in five people with current asthma and piloted in 600 panel members with current asthma. Survey topics included basic demographics, asthma history, asthma treatment and frequency of routine and emergency health care utilisation for asthma. Asthma symptom control was assessed with a validated five-item tool (Asthma Control Test; ACT13), used under licence from QualityMetric Incorporated. Symptom control was classified, according to standard cut-off points, as “well controlled” (ACT score of 20–25 points), “not well controlled” (16–19 points) or “very poorly controlled” (5–15 points). Overall health status was assessed with a question from the Australian Health Survey, “In general, would you say your health is….?”, with five response options ranging from “excellent” to “poor”. A standard screening question for assessing health literacy was included: “How confident are you filling out medical forms by yourself?”, with response options ranging from 1 (“not at all”) to 7 (“extremely”); responses of 4 (“somewhat”) or less indicate limited health literacy.14 Self-reported adherence to asthma treatment was assessed by asking “How often do you use your [inhaler name]?”, with eight responses ranging from “every day” to “a few times a year”.
Data analysis
Data were analysed using SPSS 19.0 (SPSS Inc). Analyses were weighted according to Australian asthma population benchmarks by age group, sex and state, based on data for people with current asthma in the 2011–12 Australian Health Survey.12 Results were reported using descriptive statistics, with means and 95% CIs Logistic regression analysis tested the effects of age, sex, Socio-Economic Indexes for Areas (SEIFA) scores,15 smoking status, health literacy, education level, and age at asthma diagnosis on the level of asthma control.
Results
Demographics and medications
The flow chart of participant selection is included in Appendix 2. Of the 80 518 panel members randomly invited to participate, 27 606 accepted and were shown the profiling questions (panel participation rate, 34.3%). Of these, 3033 people with current asthma were selected at recruitment stage (iii), and invited to participate in the survey; 3018 did so (asthma participation rate, 99.5%), and 2686 completed the survey (response rate, 89.0%). The demographic distribution of the sample closely matched national data for people with asthma (Appendix 3).
Box 1 includes the detailed demographic characteristics of the study sample. Of the respondents, 57.1% were women, and 40.4% were aged 50 years and over. A health care concession card was held by 54.7% of participants, and 40.7% lived in areas in the two lowest SEIFA quintiles (greatest socioeconomic disadvantage); 11.5% of participants responded “somewhat” or less to the question about confidence in completing medical forms, consistent with limited health literacy.14 One fifth of participants were current smokers, consistent with national data for people with asthma.1
In the past 12 months, 92.6% of participants reported using a short-acting β2-agonist reliever inhaler, and 60.8% reported using one or more ICS-containing medications, with 49.6% using combination ICS/LABA and 17.1% using ICS-only medications. Of the 1601 participants using ICS or ICS/LABA inhalers, 43.2% reported using them less frequently than 5 days a week, and 30.5% less than weekly (Box 2).
Asthma symptom control and health care utilisation
The mean ACT score of the 2686 participants was 19.2 (range 5–25; 95% CI, 18.9–19.3). Asthma was “well controlled” in 54.4%, “not well controlled” in 22.7%, and “very poorly controlled” in 23.0%. Multivariable analysis identified being male and a history of smoking (daily, less than daily, or in the past), as demographic characteristics that were significantly associated with “very poorly controlled” asthma, but not age group, education level, SEIFA category or age at asthma diagnosis (Appendix 4).
Only half (50.5%) of the 2686 participants reported having seen their general practitioner for a non-urgent asthma review during the previous year, and only 20.4% had discussed their asthma with a pharmacist; 10.6% had consulted a specialist regarding their asthma. Guidelines recommend that every patient with asthma should have a routine review at least yearly. Almost a quarter of participants (23.3%) had visited a general practitioner urgently about asthma at least once during the previous year, and 10.0% had attended a hospital or emergency department one or more times, with, in total, 28.6% reporting an urgent visit. Of the participants with “very poorly controlled” asthma, 44.2% reported one or more urgent GP visits during the previous year, compared with 12.5% of those with “well controlled” asthma (adjusted odds ratio [AOR], 5.98; 95% CI, 4.75–7.54). Similarly, 17.8% of those with “very poorly controlled” asthma had visited an emergency department or hospital, compared with 6.5% of those with “well controlled” asthma (AOR, 2.59; 95% CI, 1.91–3.53).
Preventer use and asthma control
Box 2 and Box 3 classify participants according to asthma symptom control and self-reported frequency of ICS-containing preventer medication use. Participants who reported using both an ICS-only medication and a non-ICS preventer in the past 12 months were excluded from this part of the analysis, as the structure of the questionnaire did not permit the frequency of use of these medications to be individually distinguished (these 32 participants (1.2% of sample) were asked how often they had used these medications, but not to break this down by specific medications).
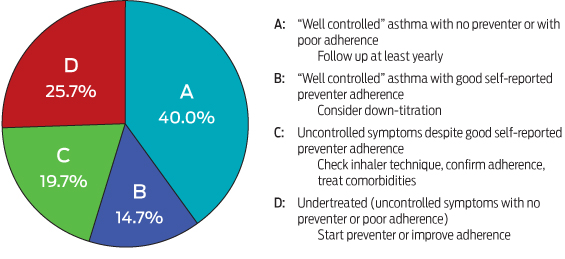
Four main groups could be identified. Group A (40.0% of participants) had “well controlled asthma” while using a preventer less than 5 days a week or not at all; these patients are considered to have mild asthma.5 Group B (14.6%) had “well controlled” asthma while using a preventer at least 5 days a week. Conversely, group C (19.7%) had uncontrolled symptoms (ie, “not well controlled” or “very poorly controlled”) despite reportedly using their preventer medication at least 5 days a week. Group D (25.7%) had uncontrolled symptoms, and used no preventer medicine at all, or used it infrequently.
Discussion
This study provides the first nationally representative data on asthma control in Australian adults. Participants were recruited from a web-based panel of almost a quarter of a million Australians, using a three-stage randomised selection process to minimise selection and response biases. We identified significant personal and economic burdens associated with asthma. Symptom control was poor in 45% of participants, while 29% had needed urgent health care for their asthma during the previous year. The data indicated significant problems regarding the prescribing of asthma medications: in contrast with guidelines, many more participants had been prescribed expensive combination ICS/LABA inhalers than had been prescribed ICS alone. Adherence to inhaled maintenance therapy was also poor: 43% of preventer medication users reported taking it less than 5 days a week, and 31% used it less than weekly. Of the participants with uncontrolled asthma symptoms, 23% used preventer medication less than 5 days a week, while 34% did not use any preventer. Taken together, these findings indicate that a significant proportion of asthma morbidity and its associated costs in Australia are preventable.
Study strengths and limitations
Rigorous web-based surveys can be valuable for assessing the impact of asthma policy and practice in Australia. Obtaining a representative sample is crucial, and we chose a web-based design being aware of the low response rates associated with surveys that employ random digit dialling and postal questionnaires,16 and high levels of home internet access. For example, 83% of Australian households had home internet access in 2012–2013, including 59% and 77% of those in the lowest and second lowest quintiles of equivalised household income, respectively; 60% of those aged 55 years or over had accessed the internet in the previous 12 months.17
A further strength of our study was that it complied with the requirements of the CHERRIES criteria for reporting e-health surveys (Appendix 1).11 Many earlier internet surveys were advertised on open websites, and investigators could not accurately identify the denominator population (ie, those who had seen the invitation to participate), and were also subject to response bias resulting from topic-specific survey invitations. The potential for selection and responder biases was minimised in our study by the three-stage random selection of participants from a large web-based panel, by the stratification of recruitment and weighting of analyses by age, sex and state according to national data on people with asthma, and by the completion rate of 89%. We do not know whether our findings can be generalised to people without internet access, but comparisons of recruitment methods have found that probability-based internet sampling achieves the best balance of sample composition and accuracy.18,19 The use of a validated asthma control tool also increased the reliability of the findings.
The major limitations of our study were those associated with any asthma survey: the individual diagnoses of asthma cannot be confirmed, medication doses cannot be accurately established, self-reported adherence to treatment schedules may be overestimated, and inhaler technique (an important contributor to poorly controlled asthma20) cannot be assessed. However, our study fills important gaps in our knowledge about asthma in Australia and, if repeated in the future, would enable assessment of trends in asthma treatment outcomes.
Clinical implications of the study
Both poor asthma symptom control and flare-ups are effectively prevented by regular ICS-containing preventer medications, even at low doses. Despite the ready availability of these medications and the fact that they are subsidised by the PBS, we found significant treatment problems relevant to asthma control. It is difficult to assess the appropriateness of preventer prescribing for individual patients without information about past treatment adjustments and currently prescribed doses, but some patterns were nevertheless clear. Australian guidelines emphasise that good asthma control can be achieved in most patients with ICS alone, and only some need combination ICS/LABA medications, which are substantially more expensive for both government and patient.3 However, nearly three times as many participants reported using a combination ICS/LABA medication in the past 12 months as those who used ICS alone.
To elicit the key clinical implications of these data, we intentionally took a broad approach based on clinical information that is emphasised by asthma guidelines and is readily available to general practitioners: asthma symptom control and adherence to prescribed preventer medication. Four groups were identified that have differing implications for clinical practice (Box 3). The 40% of participants with “well controlled” asthma while using preventer medication infrequently or not at all (Group A) would generally be considered to have mild asthma, but may still be at risk of flare-ups,5 so their asthma and its management should be reviewed at least annually.3 For the 14.7% with “well controlled” asthma while using preventer medication at least 5 days a week (Group B), down-titration should be considered once symptoms have been well controlled for 2–3 months, in order to find the minimum effective preventer dose.3 Patients in Group C (almost 20%) had apparently uncontrolled asthma despite regular asthma preventer use; while some respiratory symptoms may be due to concomitant conditions, such as chronic obstructive pulmonary disease, and while patients often overstate their adherence to medication,21 much of the symptom burden in this group is probably due to incorrect inhaler technique.20 Finally, the 25.7% of participants with uncontrolled asthma symptoms while using no preventer treatment or taking it infrequently (Group D) are at significant risk of severe flare-ups, and interventions are needed to initiate preventer medication or to improve adherence to prescribed therapy.
Few previous Australian statistics on asthma control are available for comparison with our findings. No previous population-based studies have used validated asthma control tools, but it was found that 40% of adults in a 2007 non-random sample had poorly controlled asthma as indicated by an Asthma Control Questionnaire score of 1.5 or more.22 The most recent population-based data (from 2002–20077) suggested that asthma symptom control was poor in 12%–37% of adult patients. The level of control, however, may have been overestimated, as only individual control parameters were assessed.23 An urgent visit to a general practitioner because of asthma in the previous year was reported by 23% of the present sample, compared with 14.3% in a 2003 population-based survey.24 The proportion of participants in the present study with suboptimal asthma control according to ACT score (45%) lies between the rates reported by recent population-based studies in the United States (41%)25 and Europe (50%).26
In conclusion, this study provides the first nationally representative data on asthma control and treatment for Australians with current asthma. Substantial problems with respect to prescribing and use of medications were identified. For almost half the participants there was a gap between the potential control of their asthma symptoms and the level currently experienced. These findings challenge the perception that asthma is a “solved” problem in Australia, a view that may contribute to lack of attention to asthma in clinical practice. Our findings reinforce the key recommendations for primary care in the recently published Australian Asthma Handbook,3 including regular and structured assessment to identify patients with poor asthma control; checking for common problems, such as poor adherence to therapy and inhaler technique; and appropriate prescribing of preventer medications to optimise outcomes and minimise costs and risks to the patient and to the community.
1 Demographic characteristics, asthma treatment and health care utilisation for the 2686 respondents with current asthma
Characteristic | Participants | ||||||||||||||
Age group* | |||||||||||||||
16–19 years | 207 (7.7%) | ||||||||||||||
20–29 years | 493 (18.4%) | ||||||||||||||
30–39 years | 523 (19.5%) | ||||||||||||||
40–49 years | 377 (14.0%) | ||||||||||||||
50–59 years | 441 (16.4%) | ||||||||||||||
60–69 years | 344 (12.8%) | ||||||||||||||
70 years or over | 302 (11.2%) | ||||||||||||||
Sex | |||||||||||||||
Female | 1534 (57.1%) | ||||||||||||||
Male | 1152 (42.9%) | ||||||||||||||
Smoking history | |||||||||||||||
Never smoked | 1293 (48.1%) | ||||||||||||||
Past smoker | 844 (31.4%) | ||||||||||||||
Current smoker | 549 (20.4%) | ||||||||||||||
Highest level of education | |||||||||||||||
Year 10 or below | 458 (17.1%) | ||||||||||||||
Year 11 or 12 | 518 (19.3%) | ||||||||||||||
Certificate or diploma | 908 (33.8%) | ||||||||||||||
University degree | 802 (29.9%) | ||||||||||||||
In possession of a government concession card | 1468 (54.7%) | ||||||||||||||
General health status* | |||||||||||||||
Excellent | 218 (8.1%) | ||||||||||||||
Very good | 872 (32.5%) | ||||||||||||||
Good | 1050 (39.1%) | ||||||||||||||
Fair | 402 (15.0%) | ||||||||||||||
Poor | 145 (5.4%) | ||||||||||||||
Medication use in the past 12 months† | |||||||||||||||
Short-acting β2-agonist (reliever) | 2488 (92.6%) | ||||||||||||||
ICS-only inhaler | 459 (17.1%) | ||||||||||||||
ICS/LABA inhaler | 1332 (49.6%) | ||||||||||||||
Any ICS-containing inhaler | 1634 (60.8%) | ||||||||||||||
LABA-only inhaler and one or more ICS-containing inhalers (not necessarily concurrently)‡ | 58 (2.2%) | ||||||||||||||
LABA-only inhaler without any ICS in past 12 months‡ | 17 (0.6%) | ||||||||||||||
Urgent health care for asthma in past 12 months | |||||||||||||||
Urgent general practitioner visit for asthma | 628 (23.3%) | ||||||||||||||
Hospital or emergency department visit for asthma | 269 (10.0%) | ||||||||||||||
Urgent general practitioner visit and/or hospital or emergency department visit for asthma | 769 (28.6%) | ||||||||||||||
Spent at least one night in hospital for asthma | 98 (3.7%) | ||||||||||||||
Non-urgent visit to general practitioner for review of asthma in past 12 months | 1355 (50.5%) | ||||||||||||||
ICS = inhaled corticosteroids; LABA = long-acting β2-agonist. Data were weighted for age, sex and state of residence.
* The disparity between the sum of the numbers in these groups and the total number of participants is the result of rounding weighted data to whole numbers.
† Participants were asked which treatments they had used in the past 12 months, with the images and brand names of relevant medications shown on screen.
‡ Use of LABA without concurrent ICS (either in combination or as separate inhalers) is strongly discouraged by asthma treatment guidelines.
2 Asthma symptom control and frequency of ICS-containing preventer use over the past 12 months by 2654 participants who had not used non-ICS-containing preventer medications*
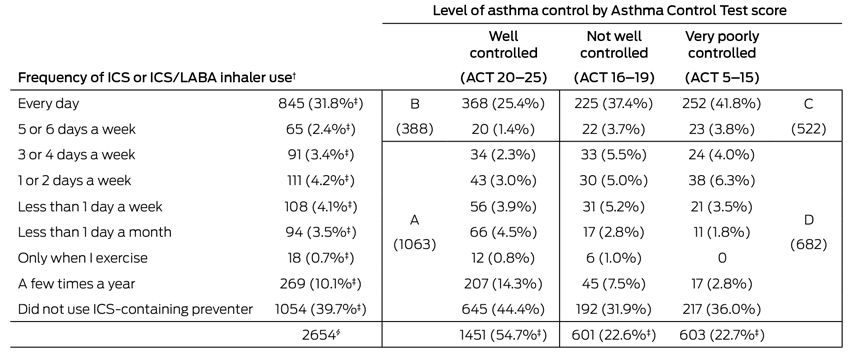
ICS = inhaled corticosteroids; LABA = long-acting β2-agonist. A = well controlled symptoms, infrequent or no preventer use; B = well controlled symptoms, regular preventer use; C = poorly controlled symptoms, frequent preventer use; D = poorly controlled symptoms, infrequent or no preventer use (see also Box 3 and discussion in text).
* 32 participants who had used an ICS-only and a non-ICS preventer in the past 12 months were excluded from this analysis because the questionnaire did not permit the frequency of use of the ICS to be distinguished. The medications used by the 32 excluded patients were: a leukotriene receptor antagonist (montelukast, 15 patients), cromones (sodium cromoglycate, 12 patients; or nedocromil sodium, 17 patients) and an anti-immunoglobulin E monoclonal antibody (omalizumab, four patients).
† ICS/LABA combinations (budesonide/eformoterol or fluticasone propionate/salmeterol) and/or ICS alone (beclomethasone, budesonide, ciclesonide, fluticasone propionate). For the 157 participants who reported using both an ICS and an ICS/LABA combination in the previous 12 months, the higher of the two reported frequencies was used.
‡ Percentage of total sample of 2654. All other percentages are based on the symptom control group.
§ The disparity between the sum of the numbers in these groups and the total number of participants is the result of rounding weighted data to whole numbers.
Received 8 November 2014, accepted 17 March 2015
- Helen K Reddel1
- Susan M Sawyer2,3,4
- Peter W Everett5
- Paul V Flood5,6
- Matthew J Peters7
- 1 Woolcock Institute of Medical Research, University of Sydney, NSW.
- 2 Centre for Adolescent Health, Royal Children's Hospital, Melbourne, VIC.
- 3 University of Melbourne, Melbourne, VIC.
- 4 Murdoch Childrens Research Institute, Melbourne, VIC.
- 5 InSync Surveys, Melbourne, VIC.
- 6 Frontrow Research, Melbourne, VIC.
- 7 Concord Repatriation General Hospital, Sydney, NSW.
The survey, statistical analysis and logistical support for investigator meetings were funded by AstraZeneca. The survey was hosted and data analysed by Ultrafeedback/InSync Surveys. The investigators were independently responsible for the final methods, questionnaire design, analysis plan and interpretation. We had full access to all study data, including statistical reports and tables. The manuscript was drafted by Helen Reddel, and all authors contributed to the discussion and editing of the final version. We acknowledge the contribution of Anne Mulham (deceased), Susan Miller and Ellen Vasiliauskas who were instrumental in the conception and execution of the background qualitative research and in this survey. We acknowledge the assistance of John Lipscomb of InSync Surveys for additional statistical analysis.
Helen Reddel and Matthew Peters have received honoraria for their memberships of committees and the provision of independent medical education for several companies that manufacture asthma medications, and Helen Reddel has also received unrestricted research grants from AstraZeneca and GlaxoSmithKline.
- 1. Australian Centre for Asthma Monitoring. Asthma in Australia 2011. Canberra: Australian Institute of Health and Welfare, 2011. (AIHW Cat. No. ACM 22; Asthma Series No. 4.) http://www.aihw.gov.au/publication-detail/?id=10737420159 (accessed Nov 2014).
- 2. Vos T, Flaxman AD, Naghavi M, et al. Years lived with disability (YLDs) for 1160 sequelae of 289 diseases and injuries 1990-2010: a systematic analysis for the Global Burden of Disease Study 2010. Lancet 2012; 380: 2163-2196.
- 3. National Asthma Council Australia. Australian asthma handbook, version 1.0 [website]. Melbourne: National Asthma Council Australia, 2014. http://www.asthmahandbook.org.au (accessed Nov 2014).
- 4. Global Initiative for Asthma. Global strategy for asthma management and prevention. Revised 2014. Vancouver: GINA, 2014. http://www.ginasthma.org/documents/4 (accessed Nov 2014).
- 5. Reddel HK, Taylor DR, Bateman ED, et al. An official American Thoracic Society/European Respiratory Society statement: Asthma control and exacerbations: Standardizing endpoints for clinical asthma trials and clinical practice. Am J Respir Crit Care Med 2009; 180: 59-99.
- 6. Australian Centre for Asthma Monitoring. Refining national asthma indicators: Delphi survey and correlation analysis. Canberra: Australian Institute of Health and Welfare, 2009. (Cat. No. ACM 15.) http://www.aihw.gov.au/WorkArea/DownloadAsset.aspx?id=6442453822 (accessed Nov 2014).
- 7. Reddel HK, Cooper S, Guevara-Rattray E, et al. Asthma control in Australia 1990-2011. 21 years since the introduction of asthma management guidelines — where are we now? Sydney: Woolcock Institute of Medical Research, 2013. http://www.woolcock.org.au/asthma-research/ (accessed Oct 2014).
- 8. Australian Institute of Health and Welfare. How much is spent on asthma? [website] http://www.aihw.gov.au/asthma/expenditure (accessed Mar 2015).
- 9. Poulos LM, Ampon RD, Marks GB, Reddel HK. Inappropriate prescribing of inhaled corticosteroids: are they being prescribed for respiratory tract infections? A retrospective cohort study. Prim Care Respir J 2013; 22: 201-208.
- 10. Toelle BG, Xuan W, Bird TE, et al. Respiratory symptoms and illness in older Australians: the Burden of Obstructive Lung Disease (BOLD) study. Med J Aust 2013; 198: 144-148. <MJA full text>
- 11. Eysenbach G. Improving the quality of Web surveys: the Checklist for Reporting Results of Internet E-Surveys (CHERRIES). J Med Internet Res 2004; 6: e34.
- 12. Australian Bureau of Statistics. Australian Health Survey: First results, 2011-12. Canberra: Australian Bureau of Statistics, 2012. (ABS Cat. No. 4364.0.55.001). http://www.abs.gov.au/AUSSTATS/abs@.nsf/DetailsPage/4364.0.55.0012011-12?OpenDocument (accessed Nov 2014).
- 13. Schatz M, Sorkness CA, Li JT, et al. Asthma Control Test: reliability, validity, and responsiveness in patients not previously followed by asthma specialists. J Allergy Clin Immunol 2006; 117: 549-556.
- 14. Wallace LS, Rogers ES, Roskos SE, et al. Brief report: screening items to identify patients with limited health literacy skills. J Gen Intern Med 2006; 21: 874-877.
- 15. Australian Bureau of Statistics. Socio-Economic Indexes for Areas (SEIFA) —-technical paper. Canberra: ABS, 2006. (ABS Cat. No. 2039.0.55.001). http://www.abs.gov.au/ausstats/abs@.nsf/mf/2039.0.55.001 (accessed Jan 2009).
- 16. Sinclair M, O'Toole J, Malawaraarachchi M, Leder K. Comparison of response rates and cost-effectiveness for a community-based survey: postal, internet and telephone modes with generic or personalised recruitment approaches. BMC Med Res Methodol 2012; 12: 132.
- 17. Australian Bureau of Statistics. Household use of information technology, Australia, 2012-13. Canberra: ABS, 2014. (ABS Cat. No. 8146.0). http://www.abs.gov.au/ausstats/abs@.nsf/mf/8146.0 (accessed Nov 2014).
- 18. Bambrick H, Fear J, Denniss R. What does $50,000 buy in a population survey? Characteristics of internet survey participants compared with a random telephone sample. Canberra: The Australia Institute, 2009. (Technical Brief No.4). http://www.tai.org.au/node/1575 (accessed Nov 2014).
- 19. Chang L, Krosnick JA. National surveys via RDD telephone interviewing versus the internet: comparing sample representativeness and response quality. Public Opin Q 2009; 73: 641-678.
- 20. Armour CL, Lemay K, Saini B, et al. Using the community pharmacy to identify patients at risk of poor asthma control and factors which contribute to this poor control. J Asthma 2011; 48: 914-922.
- 21. Foster JM, Smith L, Bosnic-Anticevich SZ, et al. Identifying patient-specific beliefs and behaviours for conversations about adherence in asthma. Intern Med J 2012; 42: e136-e144.
- 22. Reddel H, Bosnic-Anticevich S, Toelle B, et al. Identifying the needs of people with asthma in New South Wales. St Leonards (NSW): Asthma Foundation NSW, 2007. http://www.asthmaaustralia.org.au/uploadedFiles/Content/Research/asthma_nsw_survey_report_update.pdf (accessed Nov 2014).
- 23. Bateman ED, Clark TJH, Frith L, et al. Rate of response of individual asthma control measures varies and may overestimate asthma control: an analysis of the GOAL study. J Asthma 2007; 44: 667-673.
- 24. Marks GB, Abramson MJ, Jenkins CR, et al. Asthma management and outcomes in Australia: a nation-wide telephone interview survey. Respirology 2007; 12: 212-219.
- 25. Fuhlbrigge A, Reed ML, Stempel DA, et al. The status of asthma control in the U. S. adult population. Allergy Asthma Proc 2009; 30: 529-533.
- 26. Demoly P, Paggiaro P, Plaza V, et al. Prevalence of asthma control among adults in France, Germany, Italy, Spain and the UK. Eur Respir Rev 2009; 18: 105-112.
Abstract
Objective: To identify patterns of asthma control and treatment in Australian adults with asthma.
Design: Cross-sectional web-based survey, conducted 1–27 November 2012.
Participants: Adults with current asthma, at least 16 years of age, drawn randomly from a web-based panel and weighted to reflect national population proportions for people with asthma.
Main outcome measures: Asthma Control Test (ACT) scores; health care utilisation; medication use.
Results: 2686 participants completed the survey (57.1% female; median age group, 40-49 years). Mean ACT score was 19.2 (95% CI, 18.9–19.3), with asthma classified as “well controlled” for 54.4% of participants, “not well controlled” for 22.7% and “very poorly controlled” for 23.0%. 60.8% reported using preventer medication (mostly combined inhaled corticosteroid/long-acting β2-agonist) during the previous year. 23.4% had made at least one urgent visit to a general practitioner concerning their asthma, 10.0% at least one emergency department visit. Urgent consultations were more common for “very poorly controlled” than “well controlled” asthma (adjusted odds ratio, urgent GP visits 5.98 [95% CI, 4.75–7.54] and emergency department visits 2.59 [95% CI, 1.91–3.53] respectively).
Participants were classified according to asthma symptom control and frequency of preventer medication usage: Those with “well controlled” asthma included Group A (40.0% of participants) who used preventer medication infrequently (less than 5 days a week) or not at all, consistent with mild asthma, and Group B (14.7%), who used it at least 5 days a week. Uncontrolled asthma symptoms were reported by Group C (19.7%) despite regular preventer use, and by Group D (25.7%), who used none or little.
Conclusions: This study provides the first data about asthma control and its relationship with treatment in a large representative Australian population. The findings highlight significant preventable asthma morbidity in Australia.