


Patients presenting with chest pain represent a large group of adult emergency department (ED) presentations.1 The most common serious underlying causes for this symptom are acute coronary syndromes (ACS), incorporating acute myocardial infarction and unstable angina pectoris. Over 5.5 million people presented to EDs in the United States in 2007–2008 with a primary complaint of chest pain, yet only 13% of those were diagnosed with an ACS.1 The number of patients presenting to EDs in Australia with a possible ACS is unknown.
Many conditions cause chest pain, yet discriminating between an ACS and alternative and generally less serious aetiologies, such as gastro-oesophageal reflux, is difficult. The 2006 National Heart Foundation and Cardiac Society of Australia and New Zealand (NHF/CSANZ) guidelines on the management of ACS recommended stratifying patients into low-, intermediate- and high-risk categories,2 a strategy that remained unchanged in more recent updates.3 The guidelines recommended that low-risk patients be assessed using serial cardiac biomarkers and electrocardiography. High-risk patients require admission to hospital and intensive management, often including early invasive strategies. The largest group is the intermediate-risk cohort, who require serial testing of biomarkers and electrocardiography. If results of these are negative, further objective testing is required. The most commonly performed objective test in this intermediate-risk group is an exercise stress test (EST). Other more costly tests may include computed tomography coronary angiography, stress echocardiography, myocardial perfusion scanning and invasive angiography.
The costs of applying such guidelines to an undifferentiated population presenting with chest pain to EDs in Australia have not been described. The final diagnoses and 1-year outcomes of patients presenting to the ED with chest pain have also not been described. We aimed to characterise the demographics, length of hospital stay (LOS), final diagnoses, long-term outcome and costs associated with the population who presented to an Australian ED with symptoms of possible ACS.
Methods
Design and participants
We conducted a prospective, single-centre observational study between November 2008 and February 2011. Patients were included if they presented to the ED with at least 5 minutes of chest pain suggestive of an ACS (acute chest, epigastric, neck, jaw, or arm pain; or discomfort or pressure without an apparent non-cardiac source). Data were collected between 08:00 and 17:00.
Patients were excluded if they had a clear non-ACS cause for their symptoms, were unwilling or unable to provide informed consent (eg, dementia), were considered inappropriate for recruitment (eg, terminal illness), were pregnant, were recruited to the study within the past 45 days or were unable or unwilling to be contacted after discharge. Patients transferred to or from another hospital were excluded from the study, as we did not have data on costs or management for these patients. Consecutive eligible cases at the Royal Brisbane and Women's Hospital's ED were included. The study protocol was approved by the hospital's human research ethics committee (no 2008/101 and HREC/11/QRBW/493).
Patients were classified into risk groups according to the Queensland chest pain pathway (Appendix), based on the 2006 NHF/CSANZ guidelines.2 Low-risk and intermediate-risk patients were typically managed in the ED with admission to the ED short-stay unit (Box 1). High-risk patients and patients unable to perform an EST, owing to contraindication or inability, were referred to inpatient cardiology and general medical units for admission and further assessment. A small proportion of patients were managed in the ED (3.9%), while the remainder were transferred to the ED short-stay unit (46.7%) or the inpatient ward (49.4%). Patients requiring urgent cardiac surgery were transferred to another institution after inpatient admission.
Data collection
Research staff collected data using a standardised patient interview as soon as ED clinical assessment was complete. Interviews were cross-checked with patient notes. Blood samples taken on presentation (0 hour) and ≥ 6 hours later were sent to our laboratory for measurement of troponin and analysed using the second-generation AccuTnI (Beckman Coulter) assay. The 0-hour and ≥ 6-hour test results were used for patient care and cardiology end point adjudication. We used the manufacturer's 99th percentile cut-point to indicate a raised troponin value.
Data on the costs associated with investigation and care of patients during the index admission were extracted from hospital administration records. Inpatient costs were derived from procedure-related Australian refined diagnosis-related group reimbursement codes used for activity-based funding. These cost codes guide federal government payments and are designed to reflect the health care services used during each patient episode.4 To determine appropriate payments to hospitals, the weighted cost combines inputs such as staff time and consumables used for patient care.
ED costs reflect the payments received by the hospital based on triage categories of urgency. Total costs include fixed costs, which make up about 80% of overhead costs, and a variable activity-based component for pathology, imaging, pharmacy, clinical supplies and hotel services.4 Costs from 2008–2010 were adjusted for inflation by 3.4% per year to equate to 2011 costs.5 The 30-day clinical outcome was adjudicated independently by local cardiologists using predefined standardised reporting guidelines, with knowledge of all clinical information collected within a 30-day period.6 A second cardiologist conducted a blind review of all ACS cases and 10% of non-ACS cases. In cases of disagreement, end points were agreed by consensus. This was achieved for all end points.
The 30-day clinical outcomes were grouped into three categories that included cardiac-ACS-related, other cardiac and non-cardiac diagnoses. Cardiac-ACS-related diagnoses included ST-segment elevation myocardial infarction, non-ST-segment elevation myocardial infarction and unstable angina pectoris. These were categorised according to the universal definition.7 An end point of unstable angina pectoris was given for patients with negative serial troponin results, ischaemic symptoms and objective evidence of ischaemia on the EST, stress echocardiography, myocardial perfusion scanning, computed tomography coronary angiography or significant findings on coronary angiography.
Other diagnoses, such as cardiac but non-ACS (cardiac-other), and non-cardiac, were based on all available clinical data including investigations that had occurred within the 30-day period after presentation. A National Death Registry audit was performed in July 2014 to provide mortality data for patients who had consented to longer-term study participation.
Data analysis
Data were analysed using Stata, version 12 (StataCorp). Baseline characteristics of the sample were reported by outcome category using standard descriptive statistics. The baseline characteristics of patients with and without an ACS were compared using the χ2 test for categorical data and t test for continuous data.
Data on diagnosis, LOS and costs were also reported by outcome category. The LOS and cost data were right skewed and were reported in several ways. First, the median and interquartile range were reported to provide a good estimate of the LOS and cost for a typical patient. Second, for economic analysis, mean costs were reported. The mean is the correct estimator because decisionmakers need to understand total costs, which are predicted by the mean and the quantity of services used. Bias-corrected and accelerated bootstrap confidence intervals were calculated using 1000 replications.
One-year mortality was reported for a subset of patients who consented to ongoing participation in the study. Kaplan–Meier survival curves for time to death were generated by diagnostic group, and log-rank tests were used to compare survival curves.
The mean and median LOS and cost per patient were reported by NHF/CSANZ risk category. These data were broken down by ACS and non-ACS outcomes and included all patients within the diagnostic category, irrespective of whether objective testing was performed.
Results
Nine hundred and twenty-six patients were included (566 [61.1%] men; mean age 54.7 years). No patients were lost to 30-day follow up (Box 2) and 693 (74.8%) consented to one-year follow-up. Baseline characteristics are shown in Box 3.
Non-cardiac chest pain was diagnosed in 622 (67.2%) of the 926 patients (Box 3). One hundred and ninety-three patients (20.8%) were diagnosed with other cardiovascular conditions including pericarditis, atrial fibrillation and heart failure. Among those diagnosed with an ACS (103 [11.1%]), the most common condition was non-ST-segment elevation myocardial infarction (51.5% of total ACS group).
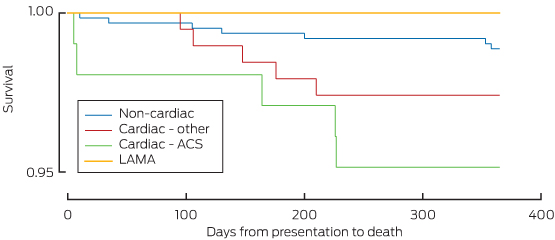
Three of the 926 patients died within 30 days; two of these were during the index admission. Two of the deaths were cardiac related. An additional 14 of the 693 patients involved in long-term follow-up died within 12 months (total, 17/693 patients [2.5%]; 95% CI, 1.4%–3.9%) (Box 4).
Kaplan–Meier curves for deaths within the diagnostic categories are shown in Box 5.
The outcomes and costs by NHF/CSANZ risk group are shown in Box 6. ACS events occurred in 0 and 11 (1.9%) of the low-risk and intermediate-risk groups, respectively. Ninety-two (28.0%) of the 329 high-risk patients had an ACS event. Ten patients were transferred for acute cardiac surgery.
Patients with an ACS, high-grade atrioventricular block, heart failure, syncope, pulmonary embolism and respiratory conditions had the longest median LOS (Box 4). Patients with an ACS incurred the highest mean cost per patient ($13 509), followed by other cardiovascular conditions ($7283). Patients with non-cardiac disease had the lowest cost of $3331 per patient.
Three hundred and fifty of the 580 intermediate-risk patients (60.3%) had an EST during the index admission. These patients incurred lower mean costs ($2316; 95% CI, $2126–$2507) than those who did not undergo an EST ($4806; 95% CI, $4094–$5516). Three hundred and six ESTs (87.4%) yielded a negative result. In contrast, 124 (53.9%) of the 230 patients who did not undergo an EST during the index presentation were admitted to an inpatient unit and incurred higher costs. Four hundred and sixty-six (80.3%) of the intermediate-risk patients received some objective testing within 30 days. The total cost for intermediate-risk patients was $1 916 100; if divided across the 11 ACS patients, this equates to $174 191 to identify one ACS event.
In the high-risk group, the mean LOS was 5 days and the mean cost was $8919. The cost of treating the 237 patients in this group who did not have an event was $7075 per patient, while the 92 patients who had an event incurred costs of $13 669. The total cost of investigating high-risk patients in this study was $2 934 317. If this value is divided across the 92 ACS events, this equates to an average of $31 895 spent to identify and treat one ACS event.
Overall, the total ED cost for investigating the 926 patients in this study was $904 221, while inpatient costs totalled $3 977 234. Total ED LOS was 5575.9 hours, making the average cost per hour in ED $162. Total LOS as an inpatient was 59 061.9 hours, making the average inpatient cost $67 per hour.
Discussion
This is the first evaluation of the characteristics, final diagnoses, outcomes and costs for an Australian ED cohort investigated for possible ACS based on the NHF/CSANZ guidelines.2,3 In keeping with other international reports, the final proportion of patients with a diagnosis of ACS was 11.1%, with 20.8% of patients having other cardiovascular causes diagnosed.8-11
Our study shows that significant resources are consumed in investigating ACSs; however, in the absence of research identifying a “negligible risk” group who do not require objective testing, such resource use is necessary. Alternative strategies to reduce the LOS in a low-risk cohort have been reported,9,12-16 and some studies have reported on the implementation and effect of such accelerated protocols.17,18 At the time of this study, such strategies were not in use in our institution. Further research efforts should be directed to identifying patients who could be discharged without requiring additional cardiac investigations.
About one-fifth of intermediate-risk patients did not have objective cardiac testing in hospital or within 30 days of their presentation, against guideline recommendations.2 We did not record the reasons why clinicians deviated from the NHF/CSANZ guidelines; however, it is possible that clinical gestalt, prior recent investigation or known coronary artery disease may have influenced care.19 In addition, decision making may have been influenced by significant debate about the utility of objective testing such as EST for patients thought to be at minimal risk.20,21
No previous study in the Australian setting has examined the cost of assessing patients presenting with chest pain. We were able to show that costs are substantial and varied across the risk categories. The high-risk group incurred the highest cost per patient, but this group had a high rate of ACS. In contrast, the intermediate-risk group was the most resource-intensive, yet these costs were expended to diagnose a very small proportion (1.9%) of patients with ACS. The overall costs per event in the intermediate group were high ($174 191 per ACS event). An ideal accelerated diagnostic protocol would exclude from testing patients who have no risk of ACS. The effect would be to reduce the size of the intermediate-risk group and define them as low risk, saving resources but not having an adverse impact on health outcomes.
Few previous studies have reported the costs related to chest pain assessment in the ED, specifically. A recent publication by KP Health for Queensland Health titled “Report of the evaluation of the clinical services redesign program in Queensland hospitals” recorded an estimated released value of 1 hour of ED cubicle time to be $98 and of an inpatient bed-day to be $779 in the financial year 2013–14 (Sarah Bright, Senior Project Officer, Health Technology Assessment and Evaluation, Queensland Health, personal communication, March 2014). This figure is less than that reported in this study of $162 per hour for an ED bed. The difference is likely to be due to the high triage category assigned to patients presenting with chest pain and the extensive investigations required. These data provide the basis to test accelerated diagnostic protocols and build full cost-effectiveness models that quantify the potential changes to costs and health outcomes from their widespread adoption.
All patients were followed up at 30 days from presentation, and the death registry audit of survival at 1 year was done for patients who had consented; however, overseas deaths may have been missed. This is unlikely to be a significant number. All end points were adjudicated by cardiologists using available information. As such, the subcategories within the non-cardiac end points may not have the same diagnostic rigour as the cardiac end points. Non-cardiac investigations occurring away from the recruitment hospital were not obtained for outcome adjudication.
Patient recruitment was within midweek working hours, owing to the availability of research staff, and the extent of potential selection bias cannot be quantified; however, we have previously reported that there are no statistically significant differences in the demographics or outcomes of the two groups.22 A significant number of patients with ACS may present atypically, or without chest pain, and this cohort was not included in our study.
The cost estimates were derived from activity-based funding cost codes. While our cost estimates do not include microcounts and values for each resource used, they are likely to reflect the resources engendered for care of patients with chest pain. We did not include the surgical costs associated with patients transferred for acute surgical management of ACS.
In conclusion, most ED patients with symptoms of possible ACS do not have a cardiac cause for their presentation. The current guideline-based process of assessment of this cohort is lengthy and requires significant resources. Investigation of strategies to shorten this process or safely reduce the need for objective cardiac testing in patients at intermediate risk according to the NHF/CSANZ guidelines is required.
1 Process of care for patients with possible acute coronary syndrome
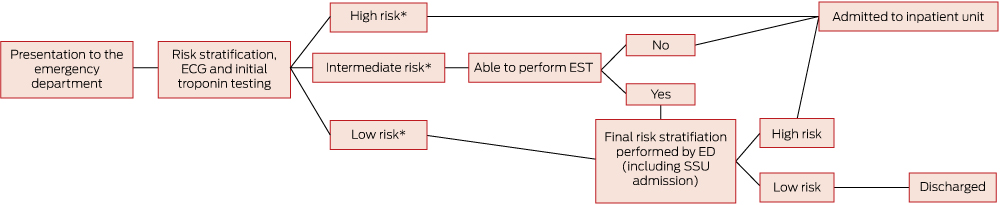
ECG = electrocardiography. EST =exercise stress test. ED = emergency department. SSU = short-stay unit. * Risk classifications according to the Queensland chest pathway (Appendix) based on the 2006 NHF/CSANZ guidelines.2
2 Patient flow within the study*
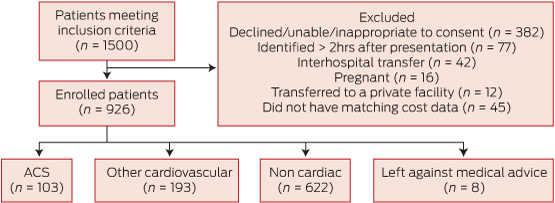
ACS = acute coronary syndromes. * According to Standards for the reporting of diagnostic accuracy studies (see http://www.stard-statement.org).
3 Baseline demographics of patients according to their final diagnosis category*
Baseline characteristics | Cardiac-ACS | Cardiac-other | Non-cardiac | No diagnosis (LAMA) | |||||||||||
(n = 103) | (n = 193) | (n = 622) | (n = 8) | ||||||||||||
Mean age, years (range) | 64.50 (33–96) | 59.32 (23–97) | 51.6 (19–93) | 55.13 (37–66) | |||||||||||
Women | 30 (29.1%) | 71 (36.8%) | 258 (41.5%) | 1 | |||||||||||
European ancestry | 97 (94.2%) | 166 (86.0%) | 542 (87.1%) | 7 | |||||||||||
Risk factors | |||||||||||||||
Dyslipidaemia | 65 (63.1%) | 113 (58.5%) | 280 (45.0%) | 1 | |||||||||||
Diabetes | 24 (23.3%) | 36 (18.7%) | 68 (10.9%) | 1 | |||||||||||
Hypertension | 64 (62.1%) | 119 (61.7%) | 269 (43.2%) | 2 | |||||||||||
Obesity (BMI > 30)† | 26 (27.1%) | 63 (33.2%) | 221 (36.4%) | 2 | |||||||||||
Smoking | 33 (32.0%) | 52 (26.9%) | 188 (30.2%) | 6 | |||||||||||
Medical history | |||||||||||||||
Angina | 40 (38.8%) | 78 (40.4%) | 111 (17.9%) | 2 | |||||||||||
Coronary artery disease | 43 (41.7%) | 81 (42.0%) | 93 (15.0%) | 1 | |||||||||||
AMI | 29 (28.2%) | 55 (28.5%) | 79 (12.7%) | 1 | |||||||||||
Arrhythmia | 15 (14.6%) | 49 (25.4%) | 38 (6.1%) | 0 | |||||||||||
Congestive heart failure | 11 (10.7%) | 29 (15.0%) | 21 (3.4%) | 0 | |||||||||||
CABG surgery | 14 (13.6%) | 21 (10.9%) | 24 (3.9%) | 1 | |||||||||||
Prior angioplasty | 19 (18.4%) | 37 (19.2%) | 51 (8.2%) | 0 | |||||||||||
Stroke | 10 (9.7%) | 30 (15.5%) | 47 (7.6%) | 2 | |||||||||||
Presentation with chest pain in the past year | 26 (25.2%) | 79 (40.9%) | 139 (22.3%) | 1 | |||||||||||
ACS = acute coronary syndromes. AMI = acute myocardial infarction. BMI = body mass index. CABG = coronary artery bypass graft. LAMA = Left against medical advice. * Data are no. (%) unless otherwise specified. † Denominators vary due to missing data: 26/96, 63/190, 221/608. | |||||||||||||||
4 Hospital length of stay, mortality, median and mean costs by diagnostic group
Diagnostic category | No. of patients (% of diagnostic group) | Median hospital length of stay, hours (25th–75th percentile) | Mean hospital length of stay, hours (95% CI) | No. of patients deceased at 1 year/no. in category* | Median costs (25th–75th percentile) | Mean costs (95% CI) | |||||||||
Cardiac-ACS | 103 (100.0%) | 97.6 (70.7–188.8) | 187.0 (125.3–248.8) | $12 002 ($7861–$16 517) | $13 509 ($11 794–$15 223) | ||||||||||
STEMI | 22 (21.4%) | 91.9 (74.1–142.9) | 151.5 (95.7–207.2) | 0/17 | $14 643 ($12 002–$17 323) | $18 297 ($13 487–$23 107) | |||||||||
NSTEMI | 53 (51.5%) | 101.3 (70.4–173.0) | 215.5 (105.0–325.9) | 5/35 | $11 705 ($8198–$15 196) | $12 829 ($11 028–$14 629) | |||||||||
UAP | 28 (27.2%) | 96.8 (44.2–191.2) | 161.1 (68.0–254.3) | 0/23 | $8311 ($4728–$17 860) | $11 033 ($8000–$14 067) | |||||||||
Cardiac-other | 193 (100.0%) | 52.1 (23.3–123.8) | 92.2 (75.5–108.8) | $4826 ($2020–$9297) | $7283 ($6152–$8415) | ||||||||||
Coronary vasospasm | 2 (1.0%) | – | – | 0/2 | |||||||||||
Stable CAD | 50 (25.9%) | 47.2 (22.0–97.1) | 81.4 (51.5–111.2) | 2/39 | |||||||||||
Pericarditis | 27 (14%) | 28.2 (10.8–65.9) | 46.5 (29.6–63.4) | 0/20 | |||||||||||
Atrial fibrillation | 33 (17.1%) | 53.7 (30.5–116.5) | 86.0 (53.7–118.2) | 2/30 | |||||||||||
High-grade atrioventricular block | 4 (2.1%) | 198.0 (138.2–281.4) | 209.8 (135.6–284.0) | 0/2 | |||||||||||
Other arrhythmias | 16 (8.3%) | 38.9 (10.5–155.8) | 86.5 (48.3–124.7) | 0/12 | |||||||||||
Heart failure | 15 (7.8%) | 196.3 (142.4–338.7) | 278.6 (161.3–395.9) | 1/9 | |||||||||||
Cardiomyopathy | 3 (1.6%) | – | – | 0/1 | |||||||||||
Valve disease | 7 (3.6%) | 30.8 (7.9–76.6) | 48.5 (16.4–80.6) | 0/4 | |||||||||||
Hypertension | 8 (4.1%) | 41.4 (17.5–77.8) | 53.5 (22.4–84.6) | 0/6 | |||||||||||
Syncope/presyncope | 10 (5.2%) | 76.1 (9.3–122.4) | 75.0 (36.9–113.2) | 0/8 | |||||||||||
Pulmonary embolism | 6 (3.1%) | 112.7 (101.0–172.8) | 140.0 (65.9–214.0) | 0/5 | |||||||||||
Other cardiac problems | 12 (6.2%) | 32.0 (10.8–57.9) | 39.7 (21.3–58.1) | 0/9 | |||||||||||
Non-cardiac | 622 (100.0%) | 24.8 (10.0–34.4) | 44.2 (36.8–51.6) | $1917 ($1392–$3479) | $3331 ($2976–$3685) | ||||||||||
No disease/chest pain not otherwise specified | 444 (71.4%) | 23.7 (9.8–30.6) | 37.7 (29.1–46.3) | 2/339 | |||||||||||
Gastrointestinal | |||||||||||||||
GOR/dyspepsia | 35 (5.6%) | 25.2 (10.2–48.8) | 38.3 (25.9–50.7) | 0/24 | |||||||||||
Other gastrointestinal | 12 (1.9%) | 33.0 (11.2–157.9) | 85.7 (33.1–138.3) | 0/8 | |||||||||||
Liver disease | 2 (0.3%) | – | – | 0/1 | |||||||||||
Respiratory | |||||||||||||||
Asthma/COAD | 5 (0.8%) | 30.7 (24.4–193.2) | 100.3 (11.8–188.9) | 0/2 | |||||||||||
Respiratory Infection | 22 (3.5%) | 25.0 (8.8–51.8) | 72.6 (27.8–117.4) | 1/16 | |||||||||||
Other respiratory | 5 (0.8%) | 105.9 (32.1–143.9) | 87.0 (35.8–138.3) | 1/3 | |||||||||||
Non-specified musculoskeletal pain | 64 (10.3%) | 22.7 (9.4–31.0) | 35.1 (23.3–47.0) | 0/49 | |||||||||||
Infection (non-respiratory) | 8 (1.3%) | 74.9 (39.3–133.5) | 127.8 (25.1–230.5) | 0/8 | |||||||||||
Neurovascular | |||||||||||||||
Stroke | 2 (0.3%) | – | – | 0/0 | |||||||||||
Neuropathic pain | 8 (1.3%) | 43.9 (16.7–126.6) | 78.5 (21.03–136.0) | 0/7 | |||||||||||
Cancers | 3 (0.5%) | – | – | 2/2 | |||||||||||
Other non-cardiac | 6 (1.0%) | 41.5 (10.5–58.0) | 58.8 (7.9–109.8) | 1/5 | |||||||||||
Anxiety/depression | 6 (1.0%) | 20.4 (8.6–49.7) | 36.2 (5.5–66.8) | 0/4 | |||||||||||
Left against medical advice | 8 (100.0%) | 14.1 (6.0–24.0) | 15.0 (8.5–21.5) | 0/3 | $1366 ($1007–$2027) | $1585 ($1128–$2042) | |||||||||
ACS = acute coronary syndromes. CAD = coronary artery disease. COAD = chronic obstructive airways disease. GOR = gastro-oesophageal reflux. NSTEMI = non- ST-segment elevation myocardial infarction. STEMI = ST-segment elevation myocardial infarction. UAP = unstable angina pectoris. * Mortality data are for the 693 patients who consented to 1-year follow-up. | |||||||||||||||
6 Median and mean cost and length of stay for ACS events and non-ACS-events among patients presenting to the emergency department with chest pain, stratified by NHF/CSANZ risk group
Category and event type | No. of patients (%) | Median cost (25th–75th percentile) | Mean cost per patient (95% CI) | Median length of stay, hours (25th–75th percentile) | Mean length of stay, hours (95% CI) | ||||||||||
All categories | 926 (100.0%) | $2443 ($1458–$6778) | $5272 ($4835–$5708) | 27.8 (10.5–75.0) | 69.8 (59.9–79.7) | ||||||||||
ACS | 103 (11.1%) | $12 003 ($7861–$16 517) | $13 509 ($11 794–$15 223) | 97.6 (70.7–188.8) | 187.0 (125.3–248.8) | ||||||||||
Non-ACS | 823 (88.9%) | $2127 ($1406–$5027) | $4241 ($3843–$4638) | 26.4 (10.2–52.5) | 55.13 (48.0–62.3) | ||||||||||
Low risk | 9 (1.0%) | $1530 ($1298–$3050) | $2040 ($1306–$2774) | 11.5 (11.3–29.6) | 20.4 (11.2–29.7) | ||||||||||
ACS | 0 (0) | $0 ($0) | $0 ($0) | 0.0 (0.0) | 0.0 (0.0) | ||||||||||
Non-ACS | 9 (1.0%) | $1530 ($1298–$3050) | $2040 ($1306–$2774) | 11.5 (11.3–29.6) | 20.4 (11.2–29.7) | ||||||||||
Intermediate risk | 580 (62.6%) | $1849 ($1376–$3570) | $3304 ($2963–$3644) | 24.5 (9.9–34.6) | 42.4 (34.6–50.2) | ||||||||||
ACS | 11 (1.9%) | $8082 ($7174–$18 554) | $12 169 ($6803–$17 536) | 99.1 (51.5–222.0) | 148.4 (66.1–230.8.8) | ||||||||||
Non-ACS | 569 (61.4%) | $1831 ($1372–$3338) | $3132 ($2844–$3420) | 23.9 (9.9–32.8) | 40.3 (33.2–47.5) | ||||||||||
High risk | 329 (35.5%) | $6452 ($2650–$11 829) | $8919 ($7971–$9867) | 72.3 (27.5–142.4) | 120.8 (97.8–142.9) | ||||||||||
ACS | 92 (9.9%) | $12 357 ($8216–$16 353) | $13 669 ($11 857–$15 481) | 97.2 (71.0–180.9) | 191.6 (116.7–266.6) | ||||||||||
Non-ACS | 237 (25.6%) | $4380 ($2151–$8812) | $7075 ($6013–$8137) | 50.4 (22.9–125.0) | 93.3 (77.7–108.9) | ||||||||||
Left against medical advice | 8 (0.9%) | $1366 ($1007–$2027) | $1585 ($1128–$2042) | 14.1 (6.0–24.0) | 15.0 (8.5–21.5) | ||||||||||
ACS | 0 (0) | $0 ($0) | $0 ($0) | 0.0 (0.0) | 0 (0.0) | ||||||||||
Non-ACS | 8 (0.9%) | $1366 ($1007–$2027) | $1585 ($1128–$2042) | 14.1 (6.0–24.0) | 15.0 (8.5–21.5) | ||||||||||
ACS = acute coronary syndromes. NHF = National Heart Foundation. CSANZ = Cardiac Society of Australia and New Zealand. * This group was added to the original NHF risk groups for completion. | |||||||||||||||
Received 31 March 2014, accepted 5 February 2015
- Louise Cullen1
- Jaimi Greenslade2
- Katharina Merollini2
- Nicholas Graves2
- Christopher J K Hammett1
- Tracey Hawkins1
- Martin P Than3
- Anthony F T Brown1
- Christopher B Huang4
- Seyed E Panahi4
- Emily Dalton1
- William A Parsonage1
- 1 Royal Brisbane and Women's Hospital, Brisbane, QLD.
- 2 Queensland University of Technology, Brisbane, QLD.
- 3 Christchurch Hospital, Christchurch, New Zealand.
- 4 University of Queensland, Brisbane, QLD.
This study was supported by a research grant from the Queensland Emergency Medical Research Foundation. We thank the Australian Institute of Health and Welfare for providing death registry data. We thank the patients who participated in the study and thank the research staff, emergency department staff and laboratory technicians of all participating sites for their invaluable efforts.
While some of the authors have been in receipt of funding from different commercial sources, at no time has there been any external influence on the study design, data collection, data analysis, data interpretation, writing of the report or decision to submit the article.
- 1. Bhuiya FA, Pitts SR, McCaig LF. Emergency department visits for chest pain and abdominal pain: United States, 1999-2008. NCHS Data Brief 2010; 43: 1-8.
- 2. Acute Coronary Syndrome Guidelines Working Group. National Heart Foundation of Australia, Cardiac Society of Australia and New Zealand guidelines for the management of acute coronary syndromes 2006. Med J Aust 2006; 184 (8 Suppl): S1-S32. https://www.mja.com.au/journal/2006/184/8/guidelines-management-acute-coronary-syndromes-2006. <MJA full text>
- 3. Chew DP, Aroney CN, Aylward PE, et al. Addendum to the National Heart Foundation of Australia/Cardiac Society of Australia and New Zealand Guidelines for the management of acute coronary syndromes (ACS) 2006. Heart Lung Circ 2011; 20: 487-502.
- 4. Queensland Health Finance Branch. Activity based funding model 2010-11. Technical paper 2011.
- 5. Australian Institute of Health and Welfare. Australia's Health 2010. Chapter 8: Expenditure and workforce. Canberra: AIHW, 2010. (Australia's Health Series No. 12. AIHW Cat. No. AUS 122.) http://www.aihw.gov.au/WorkArea/DownloadAsset.aspx?id=6442452958 (accessed Feb 2015).
- 6. Cullen L, Than M, Brown AF, et al. Comprehensive standardized data definitions for acute coronary syndrome research in emergency departments in Australasia. Emerg Med Australas 2010; 22: 35-55.
- 7. Thygesen K, Alpert JS, Jaffe AS, et al. Third universal definition of myocardial infarction. Circulation 2012; 126: 2020-2035.
- 8. Hess EP, Brison RJ, Perry JJ, et al. Development of a clinical prediction rule for 30-day cardiac events in emergency department patients with chest pain and possible acute coronary syndrome. Ann Emerg Med 2012; 59: 115-125.e1.
- 9. Body R, Carley S, McDowell G, et al. Rapid exclusion of acute myocardial infarction in patients with undetectable troponin using a high-sensitivity assay. J Am Coll Cardiol 2011; 58: 1332-1339.
- 10. Christenson J, Innes G, McKnight D, et al. A clinical prediction rule for early discharge of patients with chest pain. Ann Emerg Med 2006; 47: 1-10.
- 11. Domanovits H, Schillinger M, Paulis M, et al. Acute chest pain - a stepwise approach, the challenge of the correct clinical diagnosis. Resuscitation 2002; 55: 9-16.
- 12. Chew DP, French J, Briffa TG, et al. Acute coronary syndrome care across Australia and New Zealand: the SNAPSHOT ACS study. Med J Aust 2013; 199: 185-191.
- 13. Cullen L, Greenslade J, Hammett CJ, et al. Comparison of three risk stratification rules for predicting patients with acute coronary syndrome presenting to an Australian emergency department. Heart Lung Circ 2013; 22: 844-851.
- 14. Than M, Cullen L, Reid CM, et al. A 2-h diagnostic protocol to assess patients with chest pain symptoms in the Asia-Pacific region (ASPECT): a prospective observational validation study. Lancet 2011; 377: 1077-1084.
- 15. Than M, Cullen L, Aldous S. 2-Hour accelerated diagnostic protocol to assess patients with chest pain symptoms using contemporary troponins as the only biomarker: the ADAPT trial. J Am Coll Cardiol 2012; 59: 2091-2098.
- 16. Cullen L, Mueller C, Parsonage WA, et al. Validation of high-sensitivity troponin I in a 2-hour diagnostic strategy to assess 30-day outcomes in emergency department patients with possible acute coronary syndrome. J Am Coll Cardiol 2013; 62: 1242-1249.
- 17. George T, Ashover S, Cullen L, et al. Introduction of an accelerated diagnostic protocol in the assessment of emergency department patients with possible acute coronary syndrome: the Nambour Short Low-Intermediate Chest pain project. Emerg Med Australas 2013; 25: 340-344.
- 18. Than M, Aldous S, Lord SJ, et al. A 2-hour diagnostic protocol for possible cardiac Chest pain in the emergency department: a randomized clinical trial. JAMA Intern Med 2014; 174: 51-58.
- 19. Macdonald SP, Nagree Y, Fatovich DM, et al. Comparison of two clinical scoring systems for emergency department risk stratification of suspected acute coronary syndrome. Emerg Med Australas 2011; 23: 717-725.
- 20. Penumetsa SC, Mallidi J, Friderici JL, et al. Outcomes of patients admitted for observation of chest pain. Arch Intern Med 2012; 172: 873-877.
- 21. Prasad V, Cheung M, Cifu A. Chest pain in the emergency department: the case against our current practice of routine noninvasive testing. Arch Intern Med 2012; 172: 1506-1509.
- 22. Cullen L, Parsonage WA, Greenslade J, et al. Comparison of early biomarker strategies with the Heart Foundation of Australia/Cardiac Society of Australia and New Zealand guidelines for risk stratification of emergency department patients with chest pain. Emerg Med Australas 2012; 24: 595-603.
Abstract
Objectives: We sought to characterise the demographics, length of admission, final diagnoses, long-term outcome and costs associated with the population who presented to an Australian emergency department (ED) with symptoms of possible acute coronary syndrome (ACS).
Design, setting and participants: Prospectively collected data on ED patients presenting with suspected ACS between November 2008 and February 2011 was used, including data on presentation and at 30 days after presentation. Information on patient disposition, length of stay and costs incurred was extracted from hospital administration records.
Main outcome measures: Primary outcomes were mean and median cost and length of hospital stay. Secondary outcomes were diagnosis of ACS, other cardiovascular conditions or non-cardiovascular conditions within 30 days of presentation.
Results: An ACS was diagnosed in 103 (11.1%) of the 926 patients recruited. 193 patients (20.8%) were diagnosed with other cardiovascular-related conditions and 622 patients (67.2%) had non-cardiac-related chest pain. ACS events occurred in 0 and 11 (1.9%) of the low-risk and intermediate-risk groups, respectively. Ninety-two (28.0%) of the 329 high-risk patients had an ACS event. Patients with a proven ACS, high-grade atrioventricular block, pulmonary embolism and other respiratory conditions had the longest length of stay. The mean cost was highest in the ACS group ($13 509; 95% CI, $11 794–$15 223) followed by other cardiovascular conditions ($7283; 95% CI, $6152–$8415) and non-cardiovascular conditions ($3331; 95% CI, $2976–$3685).
Conclusions: Most ED patients with symptoms of possible ACS do not have a cardiac cause for their presentation. The current guideline-based process of assessment is lengthy, costly and consumes significant resources. Investigation of strategies to shorten this process or reduce the need for objective cardiac testing in patients at intermediate risk according to the National Heart Foundation and Cardiac Society of Australia and New Zealand guideline is required.