


Global rates of hospital-associated Clostridium difficile infection (HA-CDI) have increased dramatically over the past 10 years. The emergence of fluoroquinolone-resistant C. difficile polymerase chain reaction (PCR) ribotype (RT) 027 in North America in 2003 and in Europe in 2005 has been associated with increased morbidity and mortality.1,2 The appearance of RT027 in Australia was delayed, with the first reported case occurring in Western Australia in 2009 in a patient who apparently acquired the infection overseas.3 The first case of locally acquired infection did not occur until 2010 in Melbourne, Victoria.4 The reasons for this delay are unclear but could be due to Australia’s geography, which may impede the introduction of new strains into the country, and slow their spread due to the distances between major cities.5 Also, Australia’s conservative policies on fluoroquinolone use in humans and animals6 may have offered some protection.
Rates of community-associated CDI (CA-CDI) are also increasing worldwide.7,8 Patients with CA-CDI tend to be younger, less likely to have been exposed to antibiotics (although antibiotic exposure is still a major risk factor) and have fewer comorbidities than patients with HA-CDI.7
A recommendation from the Australian Commission on Safety and Quality in Health Care (ACSQHC) for hospital surveillance programs in all Australian states and territories to monitor C. difficile was approved by Australian health ministers in November 2008. In 2009, a surveillance definition was endorsed, and by 2011, all states and territories had acted on this recommendation. By late 2011, some states reported a substantial increase in the incidence of CDI,9,10 and reports from Tasmania9 and Victoria11 indicated that about 30%–40% of cases were CA-CDI. There has been no collation or analysis of surveillance data at a national level. Our aim was to collate results for the first 2 years of surveillance in all Australian states and territories, and to evaluate temporal trends for these data.
Each jurisdiction provided surveillance data, using the national definition of CDI and method for calculation of rates, from 1 January 2011 to 31 December 2012.12 Ethics approval was not required for the study because we collated and analysed aggregate-level data (not individual records).
The primary outcome was hospital-identified CDI (HI-CDI), defined as CDI diagnosed in a patient attending any area of an acute public hospital (ie, patients admitted to inpatient wards or units, including psychiatry, rehabilitation and aged care, and those attending emergency and outpatient departments). This reflects the burden of CDI on a hospital and includes both HA-CDI and CA-CDI, as well as infections of indeterminate or unknown origin.
A CDI case was defined as a patient having diarrhoea (an unformed stool taking the shape of the container), and the stool sample yielded a positive result in a laboratory assay for C. difficile toxin A and/or B, or a toxin-producing strain of C. difficile was detected in the stool sample by culture or PCR. Cases were only included once in an 8-week period, and patients < 2 years old at the date of collection were excluded.
As some jurisdictions undertook enhanced surveillance, HA-CDI and CA-CDI were included as secondary outcomes, with each CDI case classified according to the place of probable exposure, as follows:13
HA-CDI: diagnosis of CDI made > 48 h after admission to a hospital, or < 48 h after admission to a hospital but < 4 weeks after the last discharge from a hospital.
CA-CDI: symptom onset in the community or < 48 h after admission to a hospital provided that symptom onset occurred > 12 weeks after last discharge from a hospital.
Indeterminate/unknown: patient with CDI who does not fit any of the above criteria for exposure setting (eg, onset 4–12 weeks after last discharge from hospital) or exposure cannot be determined because of lack of data.
Data on HI-CDI were provided from 450 public hospitals in New South Wales, Queensland, South Australia, Tasmania, Victoria, Western Australia and the Australian Capital Territory, covering 92% of all patient-days in Australian acute public hospitals.14 No data were received from the Northern Territory. All participating jurisdictions used the national definition of HI-CDI, but there were variations in the denominator used to calculate rates. Qld, SA and Tas used patient-days (number of days of patients’ hospitalisation during a specified period), while the remainder used occupied bed-days (total daily numbers of occupied beds during a specified period). The yearly variance between these two measures is estimated to be < 1%, and we use the term patient-days (PD) in this study.15 In addition, all contributors except WA excluded patients < 2 years old from denominator data.
As not all hospitals in each jurisdiction undertook enhanced surveillance of CDI cases, we analysed three study samples: (i) data from all participating jurisdictions were used to analyse overall HI-CDI rates; (ii) data from the ACT, SA, Tas, Vic and WA allowed classification into HA-CDI and non-HA-CDI (ie, CA-CDI, indeterminate and unknown cases); (iii) data from Tas, Vic and WA allowed classification into HA-CDI and CA-CDI. WA obtained enhanced surveillance data from metropolitan public hospitals (accounting for 92% of all CDI cases in WA), but not rural public hospitals.
There were some differences in the definition of HA-CDI used. Tas, Vic and WA classified HA-CDI according to the national definition, whereas the ACT and SA defined it as cases where specimen collection occurred > 48 h after admission.
A total of 12 683 HI-CDI cases were identified during the study period, giving an aggregate incidence of 3.65/10 000 PD (95% CI, 3.58–3.71). The incidence varied from 2.10/10 000 PD in Qld to 6.60/10 000 PD in the ACT (Box 1).
The annual incidence rose by 24%, from 3.25/10 000 PD during 2011 to 4.03/10 000 PD during 2012, with a peak of 4.49/10 000 PD in October–December 2011 (Box 2). The incidence plateaued in January–March 2012 and then declined to 3.76/10 000 PD by July–September, after which the rate rose again to 4.09/10 000 PD in October–December 2012. The pattern for each state was broadly similar.
The two subgroups of jurisdictions with enhanced surveillance data had marginally higher HI-CDI rates than the aggregate rate from all contributing hospitals: 4.26/10 000 PD for the ACT, SA, Tas, Vic and WA; and 4.00/10 000 PD for Tas, Vic and WA.
Based on enhanced surveillance data from the ACT, SA, Tas, Vic and WA, 67% of HI-CDI (4446/6632) was identified as HA-CDI. The aggregate incidence of HA-CDI during the study period was 2.95/10 000 PD (95% CI, 2.86–3.04), about double the rate of non-HA-CDI (1.45/10 000 PD; 95% CI, 1.39–1.51) (Box 1).
The annual incidences of HA-CDI and non-HA-CDI rose by 18% and 30%, respectively, between 2011 and 2012, with both rates peaking in January–March 2012 (Box 3).
Based on enhanced surveillance data from Tas, Vic and WA, 26% of HI-CDI cases (1320/5109) were confirmed as CA-CDI (with 70% HA-CDI and 4% unknown). CA-CDI comprised 88% (1320/1501) of all non-HA-CDI cases.
The aggregate incidence of CA-CDI during the study period was 1.08/10 000 PD (95% CI, 1.02–1.13) (Box 1), rising by 24% between 2011 and 2012 (Box 3). Rates of CA-CDI doubled during 2011, declined slightly in mid 2012 and rose again by late 2012.
Box 4 plots the observed and predicted incidence for all HI-CDI (A), HA-CDI (B) and CA-CDI (C), with the corresponding percentage changes in incidence rates shown in Box 5. The data show that the incidence increased throughout 2011, particularly in the second half of the year, then declined in early 2012 before rising again in late 2012. The trends were similar for HA-CDI and CA-CDI, except that HA-CDI increased steadily throughout 2011, whereas the increase in CA-CDI occurred towards the end of the year. The late-year spring peak was repeated in 2012, albeit at a smaller magnitude than in 2011 for CA-CDI cases.
A standardised approach to the case definitions used for surveillance of HI-CDI was implemented by most Australian states and territories during 2010. Although we found differences in incidence rates between Australian jurisdictions, our analyses confirm that rates of HI-CDI increased Australia-wide during 2011 and remained high during 2012.
The incidence of CDI has increased in many industrialised countries in the past two decades.5 Since 2003, the escalation in rates of CDI in North America correlated with the emergence of a new C. difficile strain (RT027) that had higher than usual production of toxins A and B, possessed a third toxin (binary toxin) and was fluoroquinolone-resistant. Rates of CA-CDI are also increasing worldwide, estimated to comprise more than a third of all CDI cases in North America7 and Europe.8
Our findings are consistent with the overseas data, in that CA-CDI cases comprised 26% of all HI-CDI cases in Australia, and rates have substantially increased since 2011. Expansion of surveillance activities to incorporate C. difficile strain typing would give greater insight into the epidemiology of CDI in Australia, particularly in light of recent data from the United Kingdom showing that there is less inhospital transmission of CDI than previously thought.16
There are several potential explanations for the regional and temporal patterns we observed. Ascertainment bias due to increased case finding (eg, through greater awareness, improved surveillance and increased laboratory testing) cannot be ruled out, as the ACSQHC recommendations for hospital surveillance programs were implemented by the beginning of 2011, and the patterns may reflect differing adoption strategies across regions and over time. Changes in laboratory methods may also be a factor. Although many laboratories in Australia have now moved away from using insensitive enzyme immunoassays, this has occurred at different times, and methods still differ between areas.17 For example, WA used PCR for the entire study period; Qld, Tas and Vic used direct cytotoxin or toxigenic culture; and SA switched to PCR during 2012. Recent data from the United States demonstrate at least a 30% increase in the incidence of CDI attributable to adoption of more sensitive nucleic acid amplification tests.18 Implementation of more sensitive tests in Australia may have contributed to the observed overall increasing temporal trend, but it is less likely to explain the observed peaks at the end of each year (southern hemisphere spring–summer). Seasonality in HI-CDI has previously been described in Canada19 and Germany,20 and such peaks could be due to seasonal changes in risk factors for CDI, such as antibiotic prescription for respiratory tract infections during winter.19 Further investigation of the observed trends is necessary, and a longer period of data collection is required to substantiate a true seasonal effect in Australia.
The major strength of our study is the use of a standardised definition of HI-CDI across Australia, which, along with the establishment of surveillance systems for HI-CDI in each state and territory according to ACSQHC guidelines, enabled a study of national CDI rates. National CDI surveillance is predicated on a laboratory-based system and includes validation processes. Nevertheless, several limitations exist.
First, although a standardised definition of HI-CDI was used by all surveillance programs included in the analysis, and good coverage of hospital admissions was achieved for CDI surveillance (92% of all patient-days in Australian acute public hospitals), not all participating hospitals undertook enhanced surveillance for different CDI classifications, restricting the analyses that could be performed. Rates of CA-CDI were based on subgroup analyses of data from three states and may not be representative of Australia as a whole. However, the overall HI-CDI rate and the proportion of HA-CDI from this subgroup were similar to those from the fuller dataset and there is therefore no reason to suspect that CA-CDI rates are not nationally representative. There was also some variation in the definition of HA-CDI, although surveillance programs across Australia are increasingly adopting the recommended definition.
A second important limitation lies with the differences in the types of hospitals included. However, this limitation is reduced by restricting the analyses to public hospitals and using number of patient-days to calculate rates. Nevertheless, as the rates reported here do not take into account the different casemix of hospitals in each state or territory, comparison of rates between states and territories should be interpreted with caution. The study analysed aggregate rather than individual-level data, therefore important confounders (eg, comorbidity) that are not reported to the surveillance programs could also not be taken into account. Further, there was variation in the denominator data, with some jurisdictions using patient-days and others using occupied bed-days. However, the yearly variance between these was estimated to be less than 1%, although the monthly variance can be greater, particularly in small hospitals.15 In addition, all contributors except WA excluded patients aged < 2 years from the denominator. However, the 0–4-years age group accounts for less than 4% of hospital separations of all types in Australia, and inclusion of < 2-year-olds in the denominator is unlikely to substantially affect the results or alter the conclusions of this study.14
Despite these limitations, this is the first analysis of national CDI surveillance data and presents the best currently available snapshot of the burden of disease in Australia. The findings demonstrate a significant rise in both HA-CDI and CA-CDI cases identified through hospital surveillance in Australia since 2011. Further analysis of trends over time will aid understanding of the possible seasonality of CDI in Australia. In addition to enhancing coverage by existing surveillance strategies, studies are required to better characterise the epidemiology of CDI in Australia and to identify sources of CDI in the community.
1 Incidence of hospital-identified Clostridium difficile infection (HI-CDI) in Australia, January 2011 – December 2012, by state or territory
|
|
|
Rate per 10 000 patient-days (95% CI)* |
||||||||||||
State or territory |
Number of HI-CDI cases |
Number of patient-days |
All HI-CDI |
Hospital- associated CDI |
Non-hospital- associated CDI |
Community- associated CDI |
|||||||||
Australian Capital Territory |
307 |
465 270 |
6.60 (5.88–7.38) |
5.24 (4.61–5.95) |
1.35 (1.04–1.73) |
na |
|||||||||
New South Wales |
4 674 |
13 261 612 |
3.52 (3.42–3.63) |
na |
na |
na |
|||||||||
Queensland |
1 250 |
5 939 178 |
2.10 (1.99–2.22) |
na |
na |
na |
|||||||||
South Australia |
1 216 |
2 344 137 |
5.19 (4.90–5.49) |
2.53 (2.33–2.75) |
2.65 (2.45–2.87) |
na |
|||||||||
Tasmania |
357 |
601 534 |
5.93 (5.34–6.58) |
3.36 (2.91–3.85) |
2.58 (2.19–3.02) |
1.53 (1.23–1.88) |
|||||||||
Victoria |
3 411 |
9 009 788 |
3.79 (3.66–3.92) |
2.83 (2.72–2.94) |
0.95 (0.89–1.02) |
0.93 (0.86–0.99) |
|||||||||
Western Australia |
1 468 |
3 164 804 |
4.64 (4.40–4.88) |
3.21 (3.00–3.44) |
1.83 (1.67–2.00) |
1.48 (1.34–1.63) |
|||||||||
All states/territories |
12 683 |
34 786 323 |
3.65 (3.58–3.71) |
na |
na |
na |
|||||||||
ACT, SA, Tas, Vic, WA |
6759 |
15 585 533 |
4.26 (4.15–4.36) |
2.95 (2.86–3.04) |
1.45 (1.39–1.51) |
na |
|||||||||
Tas, Vic, WA |
5236 |
12 776 126 |
4.00 (3.89–4.11) |
2.94 (2.85–3.04) |
1.22 (1.16–1.29) |
1.08 (1.02–1.13) |
|||||||||
na = not applicable. * As WA obtained enhanced surveillance data from metropolitan public hospitals only, rates for hospital-associated CDI, non-hospital-associated CDI and community-associated CDI are based on data for 6632 HI-CDI cases and 15 080 652 patient-days in the ACT, SA, Tas, Vic and WA; and for 5109 HI-CDI cases and 12 271 245 patient-days in Tas, Vic and WA. |
|||||||||||||||
2 Incidence of hospital-identified Clostridium difficile infection in Australia over time, by state or territory
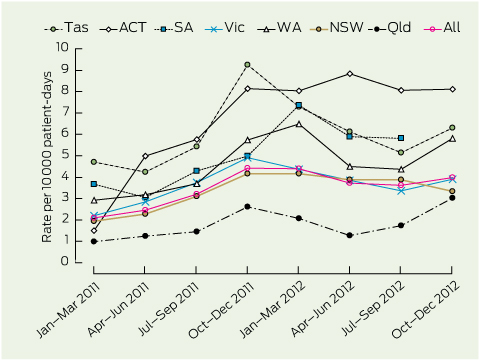
Tas = Tasmania. ACT = Australian Capital Territory. SA = South Australia. Vic = Victoria. WA = Western Australia. NSW = New South Wales. Qld = Queensland.
3 Incidence of hospital-identified Clostridium difficile infection (HI-CDI) in Australia, 2011–2012, by quarter
|
Rate per 10 000 patient-days (95% CI) |
||||||||||||||
Year and quarter |
Hospital- associated CDI* |
Non-hospital- associated CDI* |
Community- associated CDI† |
||||||||||||
2011 |
|
|
|
||||||||||||
January–March |
1.89 (1.69–2.10) |
1.03 (0.89–1.19) |
0.74 (0.61–0.90) |
||||||||||||
April–June |
2.35 (2.14–2.58) |
0.94 (0.81–1.09) |
0.68 (0.56–0.82) |
||||||||||||
July–September |
2.88 (2.64–3.13) |
1.27 (1.11–1.44) |
0.96 (0.81–1.12) |
||||||||||||
October–December |
3.65 (3.38–3.94) |
1.78 (1.60–1.99) |
1.43 (1.25–1.64) |
||||||||||||
Total |
2.70 (2.58–2.82) |
1.26 (1.18–1.34) |
0.96 (0.88–1.04) |
||||||||||||
2012 |
|
|
|
||||||||||||
January–March |
3.69 (3.41–3.98) |
1.83 (1.64–2.03) |
1.28 (1.11–1.48) |
||||||||||||
April–June |
3.15 (2.90–3.41) |
1.47 (1.30–1.66) |
1.10 (0.94–1.28) |
||||||||||||
July–September |
2.68 (2.45–2.92) |
1.58 (1.40–1.76) |
1.13 (0.97–1.30) |
||||||||||||
October–December |
3.30 (3.05–3.57) |
1.69 (1.51–1.89) |
1.27 (1.10–1.46) |
||||||||||||
Total |
3.19 (3.07–3.33) |
1.64 (1.55–1.73) |
1.19 (1.11–1.28) |
||||||||||||
* Aggregate rates calculated from Australian Capital Territory, South Australia, Tasmania, Victoria and Western Australia. † Aggregate rates calculated from Tas, Vic and WA. |
|||||||||||||||
4 Predicted incidence of hospital-identified Clostridium difficile infection (HI-CDI) in Australia, 2011–2012*
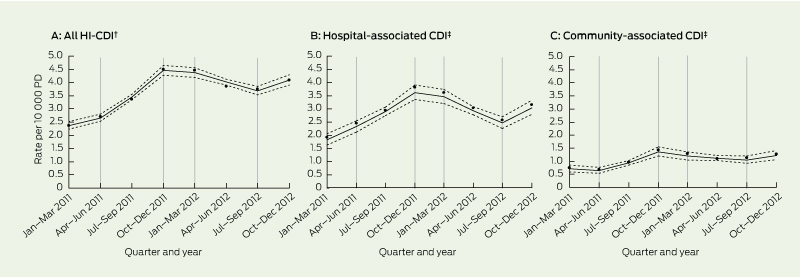
PD = patient-days. * Bold lines represent predicted incidence per 10 000 PD; dotted lines represent lower and upper 95% confidence limits; vertical grey lines represent the linear splines giving rise to five time periods; data points represent the observed incidence. † Rates calculated from Australian Capital Territory, South Australia, Tasmania, Victoria and Western Australia. ‡ Rates calculated from Tas, Vic and WA.
5 Mean percentage changes (95% CI) in incidence rates of hospital-identified Clostridium difficile infection (HI-CDI) in Australia per quarter, for specific time periods*
Period |
All HI-CDI† |
Hospital-associated CDI‡ |
Community-associated CDI‡ |
||||||||||||
Jan–Mar 2011 to Apr–Jun 2011 |
12% (3%, 22%) |
27% (9%, 47%) |
− 10% (− 30%, 16%) |
||||||||||||
Apr–Jun 2011 to Oct–Dec 2011 |
29% (25%, 34%) |
25% (17%, 33%) |
46% (30%, 63%) |
||||||||||||
Oct–Dec 2011 to Jan–Mar 2012 |
− 2% (− 7%, 4%) |
− 4% (− 14%, 7%) |
− 12% (− 27%, 5%) |
||||||||||||
Jan–Mar 2012 to Jul–Sep 2012 |
− 8% (− 11%, − 5%) |
− 16% (− 21%, − 10%) |
− 6% (− 16%, 4%) |
||||||||||||
Jul–Sep 2012 to Oct–Dec 2012 |
11% (4%, 19%) |
23% (9%, 39%) |
17% (4%, 41%) |
||||||||||||
* Time periods represent four important change points in the temporal trend of CDI identified by Poisson regression models with linear splines. The percentage changes in incidence therefore represent the average change per quarter specific to each of the five time periods. † Rates calculated from Australian Capital Territory, South Australia, Tasmania, Victoria and Western Australia. ‡ Rates calculated from Tas, Vic and WA. |
|||||||||||||||
Received 6 September 2013, accepted 27 January 2014
- Claudia Slimings1
- Paul Armstrong2
- Wendy D Beckingham3
- Ann L Bull4
- Lisa Hall5,6
- Karina J Kennedy7
- John Marquess6
- Rebecca McCann2
- Andrea Menzies7
- Brett G Mitchell8
- Michael J Richards4
- Paul C Smollen9
- Lauren Tracey2
- Irene J Wilkinson10
- Fiona L Wilson11
- Leon J Worth4
- Thomas V Riley1
- 1 Pathology and Laboratory Medicine, University of Western Australia, Perth, WA.
- 2 Western Australia Department of Health, Perth, WA.
- 3 Infectious Diseases and Infection Prevention and Control Unit, ACT Health, Canberra, ACT.
- 4 Victorian Healthcare Associated Infection Surveillance System (VICNISS) Coordinating Centre, Melbourne, VIC.
- 5 Institute of Health and Biomedical Innovation, Queensland University of Technology, Brisbane, QLD.
- 6 Centre for Healthcare Related Infection Surveillance and Prevention, Queensland Health, Brisbane, QLD.
- 7 Canberra Hospital and Health Services, Canberra, ACT.
- 8 Faculty of Nursing and Health, Avondale College for Higher Education, Sydney, NSW.
- 9 Clinical Excellence Commission, Sydney, NSW.
- 10 Communicable Disease Control Branch, Department of Health and Ageing, Adelaide, SA.
- 11 Tasmanian Infection Prevention and Control Unit, Department of Health and Human Services, Hobart, TAS.
We thank Christine Cope from the South Australian Infection Control Service, SA Health, for assistance with the provision of data.
Brett Mitchell has received financial support from the Nurses Memorial Centre, Australian College of Nursing and Covidien, and receives honoraria for editorial responsibilities from Healthcare Infection. Thomas Riley has received speaker fees, educational grants and travel assistance to attend scientific meetings from Alere, Bayer, Becton Dickinson, bioMérieux, Genzyme, GlaxoSmithKline and Sanofi.
- 1. Kuijper EJ, van den Berg RJ, Debast S, et al. Clostridium difficile ribotype 027, toxinotype III, the Netherlands. Emerg Infect Dis 2006; 12: 827-830.
- 2. Loo VG, Poirier L, Miller MA, et al. A predominantly clonal multi-institutional outbreak of Clostridium difficile-associated diarrhea with high morbidity and mortality. N Engl J Med 2005; 353: 2442-2449.
- 3. Riley TV, Thean S, Hool G, Golledge CL. First Australian isolation of epidemic Clostridium difficile PCR ribotype 027. Med J Aust 2009; 190: 706-708. <MJA full text>
- 4. Richards M, Knox J, Elliott B, et al. Severe infection with Clostridium difficile PCR ribotype 027 acquired in Melbourne, Australia. Med J Aust 2011; 194: 369-371. <MJA full text>
- 5. Clements AC, Magalhães RJ, Tatem AJ, et al. Clostridium difficile PCR ribotype 027: assessing the risks of further worldwide spread. Lancet Infect Dis 2010; 10: 395-404.
- 6. Riley TV. Is Clostridium difficile a threat to Australia’s biosecurity? Med J Aust 2009; 190: 661-662. <MJA full text>
- 7. Khanna S, Pardi DS, Aronson SL, et al. The epidemiology of community-acquired Clostridium difficile infection: a population-based study. Am J Gastroenterol 2012; 107: 89-95.
- 8. Viseur N, Lambert M, Delmee M, et al. Nosocomial and non-nosocomial Clostridium difficile infections in hospitalised patients in Belgium: compulsory surveillance data from 2008 to 2010. Euro Surveill 2011; 16: 20000.
- 9. Mitchell BG, Wilson F, McGregor A. An increase in community onset Clostridium difficile infection: a population-based study, Tasmania, Australia. Healthcare Infection 2012; 17: 127-132. doi: 10.1071/HI12029.
- 10. Healthcare Infection Surveillance Western Australia. Hospital Clostridium difficile infection. HISWA Quarterly Aggregate Report 2012; 27: 8. http://www.public.health.wa. gov.au/cproot/4496/2/q1-2012-agg-report.pdf (accessed Jan 2013).
- 11. Bull AL, Worth LJ, Richards MJ. Implementation of standardised surveillance for Clostridium difficile infections in Australia: initial report from the Victorian Healthcare Associated Infection Surveillance System. Intern Med J 2012; 42: 715-718.
- 12. Australian Commission on Safety and Quality in Health Care. Implementation guide for surveillance of Clostridium difficile infection. Canberra: Commonwealth of Australia, 2011.
- 13. McDonald LC, Coignard B, Dubberke E, et al. Recommendations for surveillance of Clostridium difficile-associated disease. Infect Control Hosp Epidemiol 2007; 28: 140-145.
- 14. Australian Institute of Health and Welfare. Australian hospital statistics 2011–12. Canberra: AIHW, 2013. (AIHW Cat. No. HSE 134; Health Services Series No. 50.) http://www.aihw.gov.au/publication-detail/?id=60129543133 (accessed Jan 2014).
- 15. Australian Commission on Safety and Quality in Health Care. Surveillance of healthcare associated infections: Staphylococcus aureus bacteraemia and Clostridium difficile infection. Data set specification, version 4.0. Canberra: Commonwealth of Australia, 2010.
- 16. Eyre DW, Cule ML, Wilson DJ, et al. Diverse sources of C. difficile infection identified on whole-genome sequencing. N Engl J Med 2013; 369: 1195-1205.
- 17. Ferguson JK, Cheng AC, Gilbert GL, et al. Clostridium difficile laboratory testing in Australia and New Zealand: national survey results and Australasian Society for Infectious Diseases recommendations for best practice. Pathology 2011; 43: 482-487.
- 18. Gould CV, Edwards JR, Cohen J, et al. Effect of nucleic acid amplification testing on population-based incidence rates of Clostridium difficile infection. Clin Infect Dis 2013; 57: 1304-1307.
- 19. Gilca R, Fortin E, Frenette C, et al. Seasonal variations in Clostridium difficile infections are associated with influenza and respiratory syncytial virus activity independently of antibiotic prescriptions: a time series analysis in Quebec, Canada. Antimicrob Agents Chemother 2012; 56: 639-646.
- 20. Reil M, Hensgens MP, Kuijper EJ, et al. Seasonality of Clostridium difficile infections in Southern Germany. Epidemiol Infect 2012; 140: 1787-1793.
Abstract
Objectives: To report the quarterly incidence of hospital-identified Clostridium difficile infection (HI-CDI) in Australia, and to estimate the burden ascribed to hospital-associated (HA) and community-associated (CA) infections.
Design, setting and patients: Prospective surveillance of all cases of CDI diagnosed in hospital patients from 1 January 2011 to 31 December 2012 in 450 public hospitals in all Australian states and the Australian Capital Territory. All patients admitted to inpatient wards or units in acute public hospitals, including psychiatry, rehabilitation and aged care, were included, as well as those attending emergency departments and outpatient clinics.
Main outcome measures: Incidence of HI-CDI (primary outcome); proportion and incidence of HA-CDI and CA-CDI (secondary outcomes).
Results: The annual incidence of HI-CDI increased from 3.25/10 000 patient-days (PD) in 2011 to 4.03/10 000 PD in 2012. Poisson regression modelling demonstrated a 29% increase (95% CI, 25% to 34%) per quarter between April and December 2011, with a peak of 4.49/10 000 PD in the October–December quarter. The incidence plateaued in January–March 2012 and then declined by 8% (95% CI, − 11% to − 5%) per quarter to 3.76/10 000 PD in July–September 2012, after which the rate rose again by 11% (95% CI, 4% to 19%) per quarter to 4.09/10 000 PD in October–December 2012. Trends were similar for HA-CDI and CA-CDI. A subgroup analysis determined that 26% of cases were CA-CDI.
Conclusions: A significant increase in both HA-CDI and CA-CDI identified through hospital surveillance occurred in Australia during 2011–2012. Studies are required to further characterise the epidemiology of CDI in Australia.