


Erectile dysfunction (ED) confronts many men as they age. Its causes can be both organic and psychogenic.1 ED has been associated with medical conditions (eg, diabetes), certain lifestyle factors, many medical treatments (eg, surgery for prostate cancer and some antidepressant medications), and is increasingly recognised as an early marker of cardiovascular disease.2-4 Hence, it is important to establish risk factors for ED as men age because the prevalence of different health behaviours and pre-existing conditions are likely to change with age. Men participating in the 45 and Up Study — a population-based cohort study of people aged 45 and over, resident in New South Wales5 — provided an excellent source for a population-wide description of ED. We hypothesised that the association between lifestyle risk factors and ED may vary according to age.
Participants in the 45 and Up Study were randomly sampled from the Medicare enrolment database, with twofold oversampling of men aged 80 years and over and of regional residents. All residents in remote areas were invited to participate. The participation rate was about 18%. The 45 and Up Study sample has excellent heterogeneity and is reasonably representative of the NSW population; the study's response rate is comparable to that of similar studies internationally and in Australia; and the study ranks among the most representative large-scale cohort studies in the world.6 In our study, we used self-reported, cross-sectional data from the baseline questionnaires of male 45 and Up Study participants (completed between 10 January 2006 and 17 February 2010). Our study was approved by the ethics committees of the and Cancer Council NSW.
ED was identified by the question: “How often are you able to get and keep an erection that is firm enough for satisfactory sexual activity?”, with the following possible responses: “always” (no ED), “usually” (minimal ED), “sometimes” (moderate ED), “never” (complete ED), or “I would rather not answer the question”.7,8 Men were then grouped into either “no/minimal ED” or “moderate/complete ED”.
Men who selected “I would rather not answer the question” and those who had missing ED data were excluded from the main analysis.
We measured pertinent sociodemographic characteristics (listed in Box 1), selected lifestyle risk factors (listed in the footnote to Box 2) and all self-reported (yes/no) chronic diseases (Box 3). Physical limitation was measured by the Medical Outcomes Study Physical Functioning scale (MOS-PF).10 A score of 100 on this scale indicates no physical limitation.
The study sample was stratified according to self-report of prostate cancer diagnoses or other diseases (Box 3). We calculated the age-related prevalence of moderate/complete ED among (i) men who reported prostate cancer, diabetes, or a disease other than diabetes; and (ii) men without those diseases (“healthy men”) but with or without lifestyle risk factors (currently smoking, body mass index [BMI] > 25 kg/m², consuming > 30 alcoholic drinks per week, being sedentary). Using unconditional logistic regression, we estimated the odds ratio (OR) and 95% CI of having moderate/complete ED for men in each of these groups compared with healthy men without risk factors, adjusting for sociodemographic characteristics.
For subsequent analyses we excluded men who reported ever having had prostate cancer because prostate cancer treatments are known to increase the likelihood of ED. Among men without prostate cancer, we calculated the OR and 95% CI of having moderate/complete ED (compared with those with no/minimal ED) by: (i) each sociodemographic covariate in a single model that included age in single years; (ii) each of the 14 diseases listed in Box 3; and (iii) each lifestyle factor in 10-year age strata (adjusting for sociodemographic characteristics). We examined variation in the relation of ED to each lifestyle factor according to age using appropriate interaction terms. We also examined the number of years since quitting smoking for past smokers and the number of cigarettes smoked daily for current smokers, by replacing the smoking status variable with a “years since quitting” variable, or a “number of cigarettes” variable.
In an additional analysis, we restricted sampling to men with no physical limitation (ie, those who scored 100 on the MOS-PF) to estimate the association between physical activity and ED among men without physical limitations to account for men who were unable to exercise due to illness.
We used SAS version 9.2 (SAS Institute) for analysis, and logistic regression models included a “missing/unknown” level for each covariate. The significance level was two-sided and set at P < 0.05.
Of the 123 779 men who completed baseline questionnaires for the 45 and Up Study between January 2006 and February 2010, 11 037 (8.92%) selected “I would rather not answer the [ED] question” and a further 4265 (3.44%) had missing ED data and were thus excluded. This left 108 477 men in our analysis. The men who were excluded were significantly older, less likely to be university educated and had lower incomes than included men.
The absolute prevalence of moderate/complete ED was highest in men reporting previous prostate cancer and lowest in healthy men without risk factors (Box 2). Compared with healthy men without risk factors, the ORs for moderate/complete ED were 9.24 (95% CI, 8.50–10.05) for men who had prostate cancer, 4.08 (3.83–4.34) for diabetes, 1.96 (95% CI, 1.87–2.06) for other diseases combined and 1.26 (95% CI, 1.20–1.33) for healthy men with risk factors. Overall, 85.07% of men with prior prostate cancer reported moderate/complete ED. The 6803 men with prior prostate cancer comprised 6.33% of the study sample. These men were excluded from further analyses.
Of the remaining 101 674 men with no prior prostate cancer, 39 965 (39.31%; 95% CI, 39.01%–39.61%) reported no ED, 25 557 (25.14%; 95% CI, 24.87%–25.40%) had mild ED, 19 102 (18.79%; 95% CI, 18.55%–19.03%) had moderate ED and 17 050 (16.77%; 95% CI, 16.54%–17.00%) had complete ED. Moderate/complete ED was associated with lower socioeconomic status and with being single (Box 1). The odds of moderate/complete ED increased by 11.30% by each year of age (OR, 1.11; 95% CI, 1.11–1.12; adjusted for sociodemographic characteristics).
The proportions of men with moderate/complete ED, as well as the adjusted OR of moderate/complete ED, varied significantly across 10-year age strata (Box 4). Specifically, ED increased with increasing BMI for all age groups except men aged ≥ 75 years (P(interaction) = 0.001). Increasing levels of physical activity were associated with decreasing odds of ED. This was the case for each age group (the statistical interaction between physical activity and age was not significant (P = 0.06)). The apparent protective effect of physical activity on ED remained when the sample was restricted to men who reported no physical limitation (33 500 men; 32.95%; data not shown).
Overall, current smokers were more likely to report moderate/complete ED than those who had never smoked and the odds of moderate/complete ED for men who smoked 20 or more cigarettes per day (OR, 1.86; 95% CI, 1.69–2.06) were greater than for those who smoked fewer than 20 cigarettes per day (OR, 1.48; 95% CI, 1.37–1.59) (P < 0.001). Past smokers had higher odds of moderate/complete ED than those who had never smoked overall (OR, 1.26; 95% CI, 1.22–1.31). The relationship between cigarette smoking and ED was modified by age (P(interaction) < 0.0001).
Age modified the association between ED and alcohol consumption (P(interaction) < 0.001). In the 45–54-years age group, the odds of moderate/complete ED were slightly but significantly reduced among men who reported having 6–10 through to 21–25 drinks in the past week, with the OR for men who drank more than 30 alcoholic drinks being close to one. For all other age groups, the odds of moderate/complete ED were slightly elevated among men who had consumed more than 30 drinks in the past week.
Among the diseases measured, the highest odds of moderate/complete ED were for diabetes and treatment for depression or anxiety in the past month (Box 3). All diseases were significantly associated with ED, except high blood cholesterol level (which was associated with ED after adjustment for sociodemographic characteristics, but not after adjustment for all other diseases).
Our study shows that the odds of ED increased by 11% with each year from age 45, which is very similar to findings internationally.12 ED can be a complication of many diseases, partly because of the underlying vasculogenic mechanisms of ED and shared risk factors such as obesity,12 but also because of treatments for prostate cancer, including surgery, radiation, or hormone therapy.13 Indeed, men who reported a history of prostate cancer had the highest levels of ED in this cohort. Of the other self-reported diseases examined, men with diabetes had the highest odds of ED, even after taking into account the effects of other diseases. Men who reported treatment for depression or anxiety in the past month also had a high risk of ED, which may be due to the deleterious effect of some antidepressants on erectile function.14
To account for the influence of lifestyle risk factors alone on ED, we showed that, among men who did not report any diseases, those who reported one or many lifestyle risk factors for ED (ie, smoking, consuming more than 30 alcoholic drinks/week, being sedentary, and/or a BMI ≥ 25kg/m2) had a 26% higher odds of ED than men without those risk factors. When we analysed the effects of each of the lifestyle risk factors separately across 10-year age strata, associations with ED were significant for all groups except men aged over 75 years. The prevalence of moderate/complete ED in men aged over 75 was very high (82%), so variations by lifestyle factors were minimal in this group, although physical activity was associated with decreased odds of ED in these men. Because capacity for physical activity may be an indicator of general good health, we reanalysed the data on a subset of men with no physical limitations, and the association of physical activity and ED remained. Although potential bias in our study cannot be excluded entirely, intervention studies have shown that physical activity improves both erectile and endothelial function.15 While most intervention studies have involved middle-aged men, there is evidence that progressive resistance training improves physical functioning in older people, so it may be that continued physical activity from younger ages has a mitigating effect on ED along with other health benefits.16
BMI and ED had a significant, positive relationship in our study consistent with the pathophysiological link between obesity and ED.17 This association was significant for every age group, except men aged 75 and over, a group in which the number of men with a BMI over 35 kg/m2 was small, leading to low statistical power.
Like many previous studies,18 we showed a positive association between smoking and ED, with heavier smokers having higher odds of ED. Former smokers who had quit more than 25 years previously had the same odds of ED as men who had never smoked, and those who quit in the past 5 years had similar odds to current smokers. These data add to the literature on the health risks of smoking, and reinforce the idea that the threat of ED and perceived sexual inadequacy among younger men could be a powerful tool to motivate them to quit smoking.19 Research on reversal of ED is limited, but one study has shown that improvements in erectile function after quitting smoking become increasingly limited with advancing age and severity of ED.20
Most previous cross-sectional studies of ED have shown a J-shaped association with alcohol intake, with moderate consumption conferring protection and higher levels having no benefit.21 In our study, it was only for men aged 45–54 years that this protective effect between alcohol and ED was apparent, and we found that the heaviest drinkers had a slightly increased odds of ED at older ages. However, prospective studies have found that alcohol consumption has no effect on the risk of ED.22,23
This report provides a comprehensive picture of how the prevalence of ED and its risk factors differ across men of different ages and is by far the largest analysis of ED to date. It is in keeping with and expands on previous Australian studies of self-reported ED and lifestyle factors, such as the nationally representative Men in Australia Telephone Survey.24
The limitations of our study include: (i) our inability to ascribe cause and effect to findings from cross-sectional data; (ii) the lack of information on use of medications to treat ED (although, because users may have been misclassified as having no ED, this bias would tend to lead to conservative estimates of association); (iii) the possibility that the prevalence of ED we report here may not be generalisable to the NSW population since the participation rate was low (18%); (iv) history of disease was derived from self-report and thus recall bias cannot be ruled out; and (v) non-responders were older and had lower socioeconomic status, which are both associated with ED, and this may have led to conservative estimates of association.
Since the National Institutes of Health consensus conference on ED 20 years ago7 and the Massachusetts Male Aging Study, which was the first study of this kind,8 there has been much research on possible causes of and cures for ED. However, patients' knowledge about risk factors for ED is generally poor.25 Furthermore, the availability of medications to treat ED may have increased awareness of the condition or treatment-seeking behaviour and, with that, increasing vulnerability to unproven, costly interventions outside of the health system. Given that ED may be an early symptom of disease and not just a quality-of-life issue means that health professionals have a crucial role in opening a dialogue about ED with men as they age.26 This report also confirms the importance of a number of risk factors for ED that are potentially modifiable, and that may be associated with other longer lasting health benefits.
1 Odds ratios and 95% CIs of moderate/complete erectile dysfunction (ED) among 101 674 men* in the 45 and Up Study, by sociodemographic characteristics
Characteristic | No. of men | % with moderate/complete ED | Odds ratio† (95% CI) | ||||||||||||
Place of residence‡ | |||||||||||||||
Major city | 46 223 | 36.41% | 1.00 | ||||||||||||
Inner regional area | 35 404 | 35.11% | 0.88 (0.85–0.91) | ||||||||||||
Outer regional area | 17 985 | 34.46% | 0.84 (0.80–0.88) | ||||||||||||
Remote or very remote area | 1 980 | 33.84% | 0.92 (0.82–1.03) | ||||||||||||
Highest qualification | |||||||||||||||
University degree or higher | 26 770 | 25.68% | 1.00 | ||||||||||||
Higher school or leaving certificate, trade, apprenticeship, certificate, diploma | 48 844 | 34.82% | 1.15 (1.10–1.19) | ||||||||||||
School or intermediate certificate | 14 897 | 43.10% | 1.32 (1.25–1.39) | ||||||||||||
No qualifications | 9 684 | 52.22% | 1.56 (1.47–1.66) | ||||||||||||
Pretax annual household income | |||||||||||||||
$50 000 or more | 44 539 | 19.62% | 1.00 | ||||||||||||
$20 000–$49 999 | 27 017 | 42.80% | 1.39 (1.33–1.45) | ||||||||||||
0–$19 999 | 17 387 | 60.42% | 1.85 (1.75–1.95) | ||||||||||||
Prefer not to answer | 10 551 | 38.08% | 1.18 (1.11–1.24) | ||||||||||||
Health insurance status | |||||||||||||||
Private | 66 178 | 30.86% | 1.00 | ||||||||||||
No concession card or health insurance | 15 894 | 28.12% | 1.02 (0.98–1.07) | ||||||||||||
Health care concession card | 15 607 | 55.81% | 1.27 (1.21–1.33) | ||||||||||||
Department of Veterans' Affairs card | 2 216 | 77.53% | 2.10 (1.86–2.37) | ||||||||||||
Married or de facto | |||||||||||||||
Yes | 82 735 | 33.88% | 1.00 | ||||||||||||
No | 18 034 | 43.12% | 1.10 (1.06–1.15) | ||||||||||||
* Missing values not shown. † Adjusted for all other sociodemographic characteristics shown in the table including age in single years; all differences by sociodemographic characteristics significant at P < 0.0001. ‡ Classified by the Accessibility/Remoteness Index of (ARIA+).9 | |||||||||||||||
2 Prevalence of moderate/complete erectile dysfunction (ED) among men in the 45 and Up Study according to age, self-reported disease status and lifestyle risk factors*
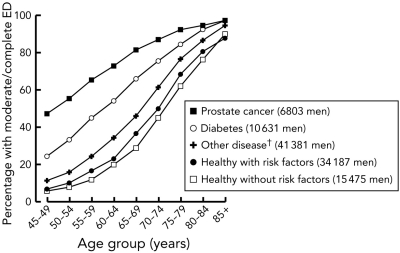 |
* Currently smoking, body mass index > 25 kg/m2, consuming > 30 alcoholic drinks/week, being sedentary. † Other disease as listed in Box 3. |
3 Odds ratios and 95% CIs of moderate/complete erectile dysfunction (ED) among 101 674 men* in the 45 and Up Study, by self-reported disease
Self-report of disease | Response | No. of men | % with moderate/complete ED | Odds ratio† (95% CI) | Odds ratio‡ (95% CI) | ||||||||||
Told by a doctor that you have: | |||||||||||||||
Diabetes | Never | 91 043 | 32.42% | 1.00 | 1.00 | ||||||||||
Ever | 10 631 | 62.46% | 2.66 (2.54–2.79) | 2.39 (2.27–2.51) | |||||||||||
Parkinson disease | Never | 101 052 | 35.34% | 1.00 | 1.00 | ||||||||||
Ever | 622 | 70.01% | 1.94 (1.59–2.36) | 1.68 (1.38–2.05) | |||||||||||
Heart disease | Never | 86 096 | 31.03% | 1.00 | 1.00 | ||||||||||
Ever | 15 578 | 60.58% | 1.74 (1.67–1.82) | 1.54 (1.48–1.61) | |||||||||||
Stroke | Never | 98 296 | 34.37% | 1.00 | 1.00 | ||||||||||
Ever | 3 378 | 70.01% | 1.96 (1.80–2.14) | 1.52 (1.39–1.66) | |||||||||||
Cancer (not prostate) | Never | 89 961 | 33.71% | 1.00 | 1.00 | ||||||||||
Ever | 11 713 | 49.74% | 1.22 (1.16–1.28) | 1.17 (1.12–1.23) | |||||||||||
Treated in the last month for: | |||||||||||||||
Depression and/or anxiety | No | 95 283 | 34.67% | 1.00 | 1.00 | ||||||||||
Yes | 6 391 | 48.83% | 2.36 (2.22–2.51) | 2.07 (1.94–2.20) | |||||||||||
Blood clotting problems | No | 99 691 | 34.94% | 1.00 | 1.00 | ||||||||||
Yes | 1 983 | 66.77% | 2.07 (1.86–2.31) | 1.48 (1.32–1.66) | |||||||||||
Osteoporosis or low bone density | No | 99 679 | 34.96% | 1.00 | 1.00 | ||||||||||
Yes | 1 995 | 65.61% | 1.68 (1.51–1.87) | 1.42 (1.27–1.59) | |||||||||||
High blood pressure | No | 77 327 | 31.28% | 1.00 | 1.00 | ||||||||||
Yes | 24 347 | 49.13% | 1.53 (1.48–1.59) | 1.29 (1.24–1.34) | |||||||||||
Cancer (not prostate) | No | 99 477 | 35.09% | 1.00 | 1.00 | ||||||||||
Yes | 2 197 | 56.76% | 1.40 (1.26–1.54) | 1.23 (1.11–1.37) | |||||||||||
Arthritis | No | 96 593 | 34.40% | 1.00 | 1.00 | ||||||||||
Yes | 5 081 | 57.63% | 1.43 (1.34–1.53) | 1.20 (1.12–1.29) | |||||||||||
Thyroid problems | No | 100 105 | 35.28% | 1.00 | 1.00 | ||||||||||
Yes | 1 569 | 52.96% | 1.46 (1.29–1.64) | 1.17 (1.04–1.33) | |||||||||||
Asthma | No | 97 903 | 35.14% | 1.00 | 1.00 | ||||||||||
Yes | 3 771 | 46.25% | 1.36 (1.26–1.47) | 1.15 (1.06–1.25) | |||||||||||
High blood cholesterol level | No | 85 073 | 33.60% | 1.00 | 1.00 | ||||||||||
Yes | 16 601 | 45.59% | 1.42 (1.36–1.47) | 1.01 (0.97–1.06)§ | |||||||||||
* Men without a history of prostate cancer. † Adjusted for age and sociodemographic characteristics. ‡ Adjusted for age, sociodemographic characteristics and all other diseases. All odds ratios significant at P < 0.01 unless indicated. § P = 0.65. | |||||||||||||||
4 Odds ratios and 95% CIs of moderate/complete erectile dysfunction (ED) in the 45 and Up Study by self-reported lifestyle risk factors* and age (adjusted for sociodemographic and all other lifestyle risk factors)
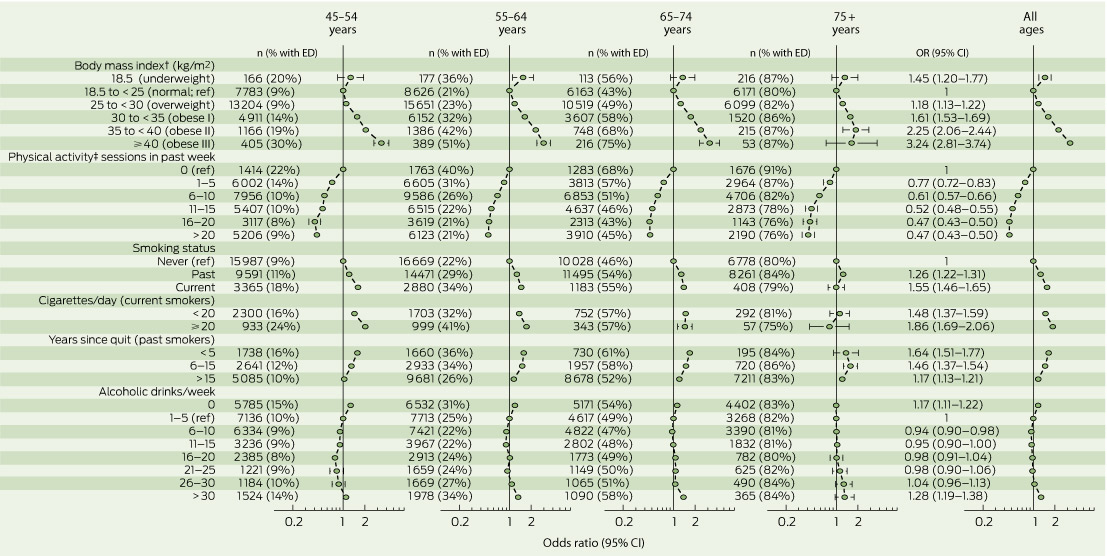 |
* Missing values for each risk factor not shown. † Body mass index as specified by the World Health Organisation. ‡ Physical activity as defined in the Active Australia Survey.11 |
Received 17 October 2012, accepted 6 March 2013
- Marianne F Weber1
- David P Smith1
- Dianne L O'Connell1
- Manish I Patel2
- Paul L de Souza3
- Freddy Sitas1
- Emily Banks4
- 1 Cancer Research Division, Cancer Council NSW, Sydney, NSW.
- 2 Discipline of Surgery, University of Sydney, Westmead, NSW.
- 3 University of Western Sydney, Sydney, NSW.
- 4 National Centre for Epidemiology and Population Health, Australian National University, Canberra, ACT.
We thank the men participating in the 45 and Up Study, which is managed by The Sax Institute in collaboration with major partner Cancer Council New South Wales; and partners the National Heart Foundation of Australia (NSW Division); NSW Ministry of Health; beyondblue: the national depression initiative; Ageing, Disability and Home Care, Department of Family and Community Services NSW; UnitingCare Ageing; and the Australian Red Cross Blood Service.
Manish Patel has served on advisory boards for Astra Zeneca, Ipsen, Abbott, GSK, Pfizer, Ferring, and Janssen. He has also received royalties from Health Press for fast facts on prostate cancer. Dianne O'Connell has received consultancy fees from the Evaluation Subcommittee of the Medical Services Advisory Committee (Australian Department of Health and Ageing) to provide expert advice on the strength and quality of evidence for medical services, procedures and tests being considered for government subsidisation.
- 1. Wyllie MG. The underlying pathophysiology and causes of erectile dysfunction. Clin Cornerstone 2005; 7: 19-27.
- 2. Camacho ME, Reyes-Ortiz CA. Sexual dysfunction in the elderly: age or disease? Int J Impot Res 2005; 17 Suppl 1: S52-S56.
- 3. Kaminetsky J. Epidemiology and pathophysiology of male sexual dysfunction. Int J Impot Res 2008; 20 Suppl 1: S3-S10.
- 4. McKinlay JB. The worldwide prevalence and epidemiology of erectile dysfunction. Int J Impot Res 2000; 12 Suppl 4: S6-S11.
- 5. 45 and Up Study Collaborators, Banks E, Redman S, Jorm L, et al. Cohort profile: the 45 and up study. Int J Epidemiol 2008; 37: 941-947.
- 6. Mealing NM, Banks E, Jorm LR, et al. Investigation of relative risk estimates from studies of the same population with contrasting response rates and designs. BMC Med Res Methodol 2010; 10: 26.
- 7. NIH Consensus Conference. Impotence. NIH Consensus Development Panel on Impotence. JAMA 1993; 270: 83-90.
- 8. Derby CA, Araujo AB, Johannes CB, et al. Measurement of erectile dysfunction in population-based studies: the use of a single question self-assessment in the Massachusetts Male Aging Study. Int J Impot Res 2000; 12: 197-204.
- 9. Glover J, Tennant S. Remote areas statistical geography in Australia: notes on the Accessibility/Remoteness Index for Australia (ARIA + version). Working Paper Series No. 9. Adelaide: Public Health Information Development Unit, 2003. http://www.publichealth.gov.au/pdf/reports_papers/working_papers_other/wk_ppr9_remoteness_aria+.pdf (accessed Mar 2013).
- 10. Hays RD, Liu H, Spritzer K, Cella D. Item response theory analyses of physical functioning items in the medical outcomes study. Med Care 2007; 45 (5 Suppl 1): S32-S38.
- 11. Australian Institute of Health and Welfare. The Active Australia Survey: a guide and manual for implementation, analysis and reporting. Canberra: AIHW, 2003. (AIHW Cat. No. CVD 22.) (accessed Mar 2013).
- 12. Nicolosi A, Moreira ED Jr, Shirai M, et al. Epidemiology of erectile dysfunction in four countries: cross-national study of the prevalence and correlates of erectile dysfunction. Urology 2003; 61: 201-206.
- 13. Smith DP, King MT, Egger S, et al. Quality of life three years after diagnosis of localised prostate cancer: population based cohort study. BMJ 2009; 339: b4817.
- 14. Baldwin DS. Sexual dysfunction associated with antidepressant drugs. Expert Opin Drug Saf 2004; 3: 457-470.
- 15. La Vignera S, Condorelli R, Vicari E, et al. Physical activity and erectile dysfunction in middle-aged men. J Androl 2012; 33: 154-161.
- 16. Liu CJ, Latham NK. Progressive resistance strength training for improving physical function in older adults. Cochrane Database Syst Rev 2009: (3): CD002759.
- 17. Tamler R. Diabetes, obesity, and erectile dysfunction. Gend Med 2009; 6 Suppl 1: 4-16.
- 18. McVary KT, Carrier S, Wessells H; Subcommittee on Smoking and Erectile Dysfunction Socioeconomic Committee, Sexual Medicine Society of North America. Smoking and erectile dysfunction: evidence based analysis. J Urol 2001; 166: 1624-1632.
- 19. Chapman S. Erectile dysfunction and smoking: subverting tobacco industry images of masculine potency. Tob Control 2006; 15: 73-74.
- 20. Pourmand G, Alidaee MR, Rasuli S, et al. Do cigarette smokers with erectile dysfunction benefit from stopping?: a prospective study. BJU Int 2004; 94: 1310-1313.
- 21. Cheng JY, Ng EM, Chen RY, Ko JS. Alcohol consumption and erectile dysfunction: meta-analysis of population-based studies. Int J Impot Res 2007; 19: 343-352.
- 22. Bacon CG, Mittleman MA, Kawachi I, et al. A prospective study of risk factors for erectile dysfunction. J Urol 2006; 176: 217-221.
- 23. Feldman HA, Johannes CB, Derby CA, et al. Erectile dysfunction and coronary risk factors: prospective results from the Massachusetts male aging study. Prev Med 2000; 30: 328-338.
- 24. Holden CA, McLachlan RI, Pitts M, et al. Determinants of male reproductive health disorders: the Men in Australia Telephone Survey (MATeS). BMC Public Health 2010; 10: 96.
- 25. Baumgartner MK, Hermanns T, Cohen A, et al. Patients' knowledge about risk factors for erectile dysfunction is poor. J Sex Med 2008; 5: 2399-2404.
- 26. McCullough AR. The penis as a barometer of endothelial health. Rev Urol 2003; 5 Suppl 7: S3-S8.
Abstract
Objectives: To quantify relationships between erectile dysfunction (ED), ageing and health and lifestyle factors for men aged 45 years and older.
Design: Cross-sectional, population-based study seeking data on health, sociodemographic and lifestyle factors by questionnaire (the 45 and Up Study).
Participants and setting: 108 477 men aged 45 years or older, living in New South Wales, and recruited into the 45 and Up Study between 10 January 2006 and 17 February 2010.
Main outcome measures: Self-reported ED.
Results: In the 101 674 men reporting no prior diagnosis of prostate cancer, 39.31% (95% CI, 39.01%–39.61%) had no ED, 25.14% (95% CI, 24.87%–25.40%) had mild ED (ie, experienced ED sometimes), 18.79% (95% CI, 18.55%–19.03%) had moderate (ie, usually experienced) ED and 16.77% (95% CI, 16.55%–17.00%) had complete ED. After adjusting for sociodemographic characteristics, the odds of moderate/complete ED increased by 11.30% (OR, 1.11; 95% CI, 1.11–1.12) each year from the age of 45 years. Overall, the risk of moderate/complete ED was higher among men with low socioeconomic status, high body mass index, those who were sedentary, current smokers and those with diseases including diabetes, heart disease, and depression/anxiety, compared with men without these risk factors. Moderate alcohol consumption was associated with a significantly reduced risk of ED in men aged 45–54 years, but not in older men. Almost all men aged 75 or older reported moderate/severe ED; however, increased physical activity was associated with a lower odds of ED in this group.
Conclusions: In a large population-based cross-sectional study, ED increased considerably with age. There are a range of potentially modifiable risk factors for ED, including smoking, low physical activity, and high body mass index.