


In Australia, chronic vascular diseases such as heart disease and diabetes are the leading causes of death and disability.1 Intensive lifestyle interventions have been shown to prevent vascular disease and diabetes in high-risk patients.2-6 General practice is well placed to offer preventive programs, reaching about 90% of Australians each year.7 In 2007–08, 59% of general practice encounters were with patients who were overweight or obese, 26% with those who drank alcohol at risky levels and 17% with those who smoked daily.8 While interventions targeting single risk factors in general practice have been effective,9,10 results from interventions targeting multiple factors have been more equivocal.11
There are many missed opportunities for risk-factor intervention in Australian general practice.8 Our previous research suggests that referral of high-risk patients to services to support lifestyle change is infrequent.12 Barriers to referral include lack of time, lack of referral services and poor linkages with those that are available, and the out-of-pocket costs of some providers.13-15
As part of the Council of Australian Governments (COAG) initiatives to prevent diabetes, Divisions of General Practice (DGPs) and state governments established lifestyle-modification programs16 through which people aged 40–49 years who attended a health-check with their general practitioner were then referred for group education sessions. Although these programs have been offered widely, uptake has been far lower than originally expected.17
HIPS was conducted in three urban and two rural DGPs in New South Wales from July 2008 to January 2010. The methodology has been described previously.18
Practice staff in the intervention practices were trained to assess cardiovascular risk factors and provide brief lifestyle advice and motivational counselling. This brief intervention was modelled on the 5As framework (ask, advise, assess, assist, arrange).19 At the patient’s health-check visit, the GP and practice nurse reviewed behavioural and physiological risk factors and provided brief lifestyle counselling. Patients were referred to the lifestyle-modification program if they were found to be at high risk, defined as including one or more of the following characteristics:
a history of gestational diabetes mellitus, or impaired glucose tolerance or impaired fasting glycaemia
hypertension (blood pressure [BP], ≥ 140/90 mm/Hg on two occasions) or already treated for hypertension
hyperlipidaemia (any of: total cholesterol [TC], > 4.5 mmol/L; low-density lipoprotein [LDL] cholesterol, > 2.5 mmol/L; triglycerides, > 2.0 mmol/L) or already treated for hyperlipidaemia
overweight (body mass index [BMI], > 25 kg/m2)
waist circumference > 102 cm in males or > 88 cm in females
current smoker.18
The lifestyle program included an initial visit with a dietitian or exercise physiologist for an assessment and individual goal setting, followed by attendance at a group education program, “CHANGE for HIPS”, adapted from the patient education component of the Counterweight program.20 This comprised four 1.5-hour sessions over the first 3 months and a further two follow-up sessions at 6 and 9 months. Group sessions included education, physical activity (20–30 minutes of walking or resistance exercise) and self-management strategies (goal setting, self-monitoring, developing practical skills and problem solving) aimed at promoting positive dietary and physical activity changes and weight loss. Patients were encouraged to keep a food and physical activity diary and use a pedometer between sessions.
We collected practice information using a questionnaire completed by the principal GP or practice manager.12 This included location (rural or urban), and the number of GPs, practice nurses and practice managers.
Using a patient questionnaire at baseline, 6 and 12 months, we collected demographic information and self-reported behaviours, including:12
current smoking status
serves of fruit and vegetables per day (at risk, < 7 serves per day)
alcohol consumption (at risk, > 2 standard drinks per day)
physical activity level, which combined assessment of duration of vigorous and moderate physical activity (score range, 0–8; at risk, < 4).21
Patients were allowed up to 8 weeks to respond to the questionnaire.
The postcode of each patient’s residence was classified according to the 2006 Index of Relative Socio-Economic Advantage and Disadvantage from the Socio-Economic Indexes for Areas (SEIFA),22 categorised into quintiles.
BMI (at risk, ≥ 25 kg/m2
blood lipid levels
TC (at risk, > 4 mmol/L)
high-density lipoprotein cholesterol (at risk, < 1 mmol/L)
LDL cholesterol (at risk, > 2 mmol/L)
triglycerides (at risk, > 1.5 mmol/L)
BP (at risk, > 135/85 mmHg)
fasting blood sugar (at risk, 5.5–6.9 mmol/L; an oral glucose tolerance test was recommended for these patients).
Using an a priori sample size calculation based on primary outcomes, we determined that a sample size of between 228 and 382 in each group would have 80% power to detect a change of 4 kg in weight, 3 mmHg in systolic BP, 0.2 mmol/L in LDL cholesterol and 0.5 units in diet and physical activity scores. We based these changes on the variance in the mean of these variables in previous research and on the assumption that patients were clustered in practices (30 practices with intraclass correlation coefficients < 0.1, based on previous research)12,20,23 and loss to follow-up of 10%.
We conducted univariate analyses (independent t test and chi-square test with 95% confidence intervals) within and between intervention and control groups using SPSS, version 15 (SPSS Inc) at baseline, 6 and 12 months. Our primary analysis was on an intention-to-treat basis, which included dropouts if the data were available and patients had not requested withdrawal of their data from the study. The characteristics of dropouts were compared with other participants at baseline. We conducted multilevel multivariable analysis using MLwiN (statistical software for multilevel models).24 Repeated measurements were clustered within patients, and patients were clustered within general practices. Since diet and physical activity data were available at baseline, 6 and 12 months, we fitted a three-level model with occasions at level 1, patients at level 2 and GPs at level 3. Data for BMI, BP, and blood lipid and blood sugar levels were available at baseline and 12 months only. Values at baseline and covariates were included in this analysis. Covariates to adjust for baseline differences between the intervention and control groups included patients’ age, sex and socioeconomic status, and the practice location, size and staff (practice nurse and manager).
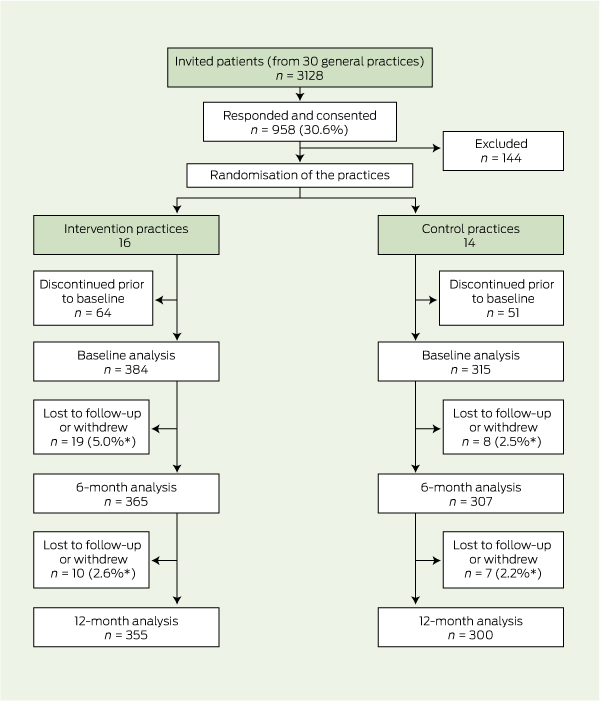
A total of 3128 patients from the 30 participating practices were approached to participate in the study, and 958 consented. Of these, 144 patients were excluded (two died, 84 had diabetes or cardiovascular disease, 35 left the practice, 13 had a terminal or other illness, and we had an incorrect address for 10). There were 814 remaining patients (26.0% of invited patients) from all 30 practices, 16 of which were intervention practices (including eight rural) and 14 of which were control practices (including six rural). These practices had similar numbers of GPs (intervention, 3.7; control, 2.8), practice nurses (0.6; 0.7), and practice managers (0.8; 0.8). After randomisation, a further 115 patients were lost to follow-up or withdrew before the baseline data collection, leaving 699 participants — 384 in the intervention group and 315 in the control group (Box 1). Those subsequently lost to follow-up or who withdrew were slightly more likely to be overweight (P = 0.04) but were otherwise similar to those completing the study, and there were no significant differences between intervention and control groups for these patients.
Of the 699 participants, 16.3% (114) had only one behavioural risk factor, 35.3% (247) had two and 45.2% (316) had three or more behavioural risk factors; and 55.1% (385) were taking either lipid-lowering medication or an antihypertensive. There were no significant differences at baseline in the characteristics of intervention and control patients, including the proportion of patients with each risk factor or who were on lipid-lowering or antihypertensive medications (Box 2). Although we used different sampling methods for the two age groups, there was no difference in characteristics or risk factors between these groups, except for a lower number of fruit and vegetable portions consumed by those aged 40–55 years (mean, 4.21) compared with those aged 56–64 years (mean, 4.88) (P < 0.01). There was no difference in the proportion of patients being referred for diet or physical activity services or programs at baseline (intervention group, 2.3% [9/384]; control group, 1.9% [6/315]; P = 0.45).
The mean physical activity score of patients in both groups increased significantly between baseline and 6 months but not between 6 and 12 months. Scores for the intervention group were 3.71, 4.59 and 4.60 (P for increases, 0.001 and 0.5, respectively). Control group scores were 3.38, 3.89 and 4.09 (P for increases, 0.003 and 0.2, respectively). At both 6 and 12 months, the score was significantly higher in the intervention group than in the control group (P = 0.002, P = 0.01, respectively) (Box 3 and Box 4).
The mean daily number of portions of fruit and vegetables consumed increased in the intervention group at 6 months but showed no significant change at 12 months (baseline, 4.73; 6 months, 5.58; 12 months, 4.85) (P for increases, 0.001 and 1.0, respectively). There was an increase in the control group at 6 months but no significant change at 12 months (4.67 to 4.99 and 4.52 (P for increases, 0.001 and 0.7, respectively). The mean number of portions was significantly higher in the intervention group than in the control group at 6 months (P = 0.002), but not at 12 months (P = 0.1). Portions of fruit and vegetables consumed (but not physical activity or BMI) remained lower in the 40–55 years age group (4.32 portions) than the 56–64 years age group (4.88 portions) at 12 months (P = 0.01). For the 12-month follow-up, 35% of data for BMI were missing, but fewer than 10% were missing for diet and physical activity. Alcohol and tobacco data were missing for 11% of participants. BP and lipid levels were missing for 17% and 23%, respectively. There were no significant differences between the intervention and control groups in other behavioural or physiological risk factors or in absolute cardiovascular risk at 12 months (Box 4).
Intervention patients who attended a minimum of two group program sessions and one allied health visit were compared with the other intervention patients. At 12 months, attendees had lost significantly more weight than non-attendees and were eating significantly more portions of fruit and vegetables per day. There were no significant differences in other risk factors or absolute cardiovascular risk between group program attendees and other intervention patients at 12 months (Box 4). Among attendees, the reported increases from baseline in the daily number of portions of fruit and vegetables consumed (0.9 portions; P = 0.001) and measured weight loss (1.06 kg; P = 0.04) were greater than for the other intervention patients (0.1 portions [P = 0.2] and 0.73 kg weight gain [P = 0.2]) and the control patients (0.07 portions [P = 0.6] and 0.05 kg weight gain [P = 0.9]) at 12 months.
We examined the association between the intervention and dietary portions of fruit and vegetables, physical activity score and BMI using multilevel multivariable analysis, adjusted for patient and practice characteristics, time and cluster effects. Men and patients allocated to the intervention group improved their physical activity compared with those in the control group (Box 5). Increased age, female sex and rurality were also significantly associated with a better diet score (portions of fruit and vegetables). When these explanatory variables were included in the model, 100% of the practice variance and 4% of the patient variance was explained for diet and physical activity scores. Thus, most of the patient variance remained unexplained by the variables included. There were no significant associations for BMI (Box 5). The baseline BMI and other independent variables explained 91% of the patient variance for BMI at 12 months.
This is the first Australian study to evaluate the impact of a general practice-based preventive health check linked to a moderate-intensity group education program. There were few impacts on the primary outcomes in a 12-month period. On an intention-to-treat basis, the only outcome associated with the intervention was self-reported physical activity. A small weight reduction (1.06 kg) was achieved only among those attending the group program, slightly less than that achieved in the original Counterweight program on which the group intervention was based.20 The reduced effect might be due to the lower intensity of our adapted intervention. The finding that a change in diet was achieved in the intervention group at 6 months but lost by 12 months suggests that long-term adherence to lifestyle changes was not achieved and that more support for maintaining behaviour change was required.25 There was no evidence of impact on BP and lipid levels at 12 months. The high level of medication use (55% on either a lipid-lowering or an antihypertensive medication) may have reduced the sensitivity of these physiological measures to lifestyle change.
A key challenge was to motivate high-risk patients to attend referral programs or services (only 30.5% of intervention patients attended the group program). Rates of attendance and completion of lifestyle programs are often poor and highly variable in general practice.5 Improved referral and attendance rates were achieved in the intervention group (but not the control group). This suggests that practice support, a referral system and a structured program provided free to patients overcame some of the barriers to referral.13,14 This is relevant for current lifestyle-management programs delivered through DGPs, many of which have had difficulty attracting and retaining referrals.17 Further research is needed to determine optimal ways to overcome barriers to participation by both patients and providers.
The lack of impact of the intervention on smoking is explicable, given the low proportion of smokers among participants. However, the higher proportion of patients with at-risk levels of alcohol consumption did not change significantly either. It has been observed previously that multiple-risk-factor interventions have not reduced alcohol consumption.11 New strategies may be needed to overcome practitioner and patient barriers. Alternatively, it might be better to offer brief interventions for alcohol separately to interventions for diet, physical activity and weight, while still working within a framework such as the 5As.10,26
A number of limitations of our study need to be acknowledged. We did not include remote rural areas; the practices were from only five DGPs in NSW and the results may not be generalisable to all practices. However, the ranges in size and the number and type of staff in the practices we studied were comparable to those described in other studies.8 Further, patients from smaller practices may have been overrepresented relative to larger practices, and the response rate was low, at 31%. This may have biased the sample — for example, in affecting the overall level of readiness to change. However, the sample characteristics were also comparable to those found in other studies in general practice.8 Participating practices were unblinded to their allocation and this may have influenced their recording of risk factors. The health check and questionnaires may have had a “study effect” on both intervention and control practices, reducing the observed difference. Also, the self-reported diet and physical activity data may be unreliable. Data on BMI were missing in 35% of cases at 12 months, which may have influenced the findings, although the characteristics and risk factors of these patients were not different at baseline. The study was underpowered to detect small changes in some physiological outcomes, especially lipid levels and BP. The comparison within the intervention group between those who did and did not attend the group education program had limitations. Patients were not randomly assigned, and the multilevel analysis might not have accounted for all systematic differences between the groups. It is also possible that the better results for those who attended the program reflected a higher pre-existing motivation to change.
2 Characteristics of intervention and control patients at baseline (n = 699)
No. of portions of fruit and vegetables consumed per day < 7 |
|||||||||||||||
3 Univariate differences in patient behaviours at 6 months among patients completing the questionnaire at 6 months (n = 466*)
No. of portions of fruit and vegetables consumed per day, mean (95% CI) |
|||||||||||||||
Received 16 February 2012, accepted 8 August 2012
- Mark F Harris1
- Mahnaz Fanaian2
- Upali W Jayasinghe1
- Megan E Passey3
- Suzanne H McKenzie4
- Gawaine Powell Davies1
- David M Lyle5
- Rachel A Laws6
- Heike Schütze1
- Qing Wan1
- 1 Centre for Primary Health Care and Equity, University of New South Wales, Sydney, NSW.
- 2 Illawarra Health and Medical Research Institute, University of Wollongong, Wollongong, NSW.
- 3 University Centre for Rural Health North Coast, University of Sydney, Sydney, NSW.
- 4 James Cook University, Townsville, QLD.
- 5 Broken Hill University Department of Rural Health, University of Sydney, Sydney, NSW.
- 6 Prevention Research Collaboration, School of Public Health, University of Sydney, Sydney, NSW.
This research was funded by an Australian National Health and Medical Research Council project grant. We acknowledge the involvement of the other members of the HIPS research team and the involvement of participating DGPs, practices and patients.
No relevant disclosures.
- 1. Australian Institute of Health and Welfare. Chronic diseases and associated risk factors in Australia, 2006. Canberra: AIHW, 2006. (AIHW Cat. No. PHE 81.) http://www.aihw.gov.au/publication-detail/?id=6442467914 (accessed Jul 2012).
- 2. Eriksson MK, Franks PW, Eliasson M. A 3-year randomized trial of lifestyle intervention for cardiovascular risk reduction in the primary care setting: the Swedish Björknäs study. PLoS One 2009; 4: e5195.
- 3. Ebrahim S, Taylor F, Ward K, et al. Multiple risk factor interventions for primary prevention of coronary heart disease. Cochrane Database Syst Rev 2011; (1): CD001561. doi: 10.1002/14651858.CD001561.pub2.
- 4. Tuomilehto J, Lindström J, Eriksson JG, et al; Finnish Diabetes Prevention Study Group. Prevention of type 2 diabetes melllitus by changes in lifestyle among subjects with impaired glucose tolerance. N Engl J Med 2001; 344: 1343-1350.
- 5. Kramer MK, Kriska AM, Venditti EM, et al. Translating the Diabetes Prevention Program: a comprehensive model for prevention training and program delivery. Am J Prev Med 2009; 37: 505-511.
- 6. Amundson HA, Butcher MK, Gohdes D, et al; Montana Cardiovascular Disease and Diabetes Prevention Program Workgroup. Translating the Diabetes Prevention Program into practice in the general community. Diabetes Educ 2009; 35: 209-223.
- 7. Department of Health and Ageing. General practice in Australia: 2004. Canberra: Commonwealth of Australia, 2005.
- 8. Britt H, Miller GC, Charles J, et al. General practice activity in Australia 2007-08. Canberra: AIHW, 2008. (AIHW Cat. No. GEP 22.) http://www.aihw.gov.au/publication-detail/?id=6442468154 (accessed Jul 2012).
- 9. Stead LF, Bergson G, Lancaster T. Physician advice for smoking cessation. Cochrane Database Syst Rev 2008; (2): CD000165.
- 10. Kaner EF, Beyer F, Dickinson HO, et al. Effectiveness of brief alcohol interventions in primary care populations. Cochrane Database Syst Rev 2007; (2): CD004148.
- 11. Goldstein MG, Witlock EP, DePue J; Planning Committee of the Addressing Multiple Behavioral Risk Factors in Primary Care Project. Multiple behavioral risk factor interventions in primary care. Summary of research evidence. Am J Prev Med 2004; 27 (2 Suppl): 61-79.
- 12. Amoroso C, Harris MF, Ampt A, et al. The 45 year old health check — feasibility and impact on practices and patient behaviour. Aust Fam Physician 2009; 38: 358-362.
- 13. Passey M, Fanaian M, Lyle D, Harris MF. Assessment and management of lifestyle risk factors in rural and urban general practices in Australia. Aust J Prim Health 2010; 16: 81-86.
- 14. Harris MF, Hobbs C, Powell Davies G, et al. Implementation of a SNAP intervention in two divisions of general practice: a feasibility study. Med J Aust 2005; 183 (10 Suppl): S54-S58.
- 15. Ampt AJ, Amoroso C, Harris MF, et al. Attitudes, norms and controls influencing lifestyle risk factor management in general practice. BMC Fam Pract 2009; 10: 59.
- 16. Department of Health and Ageing. National Partnership Agreement on Preventive Health. http://www.health.gov.au/internet/main/publishing.nsf/Content/phd-prevention-np (accessed Jul 2012).
- 17. Australian General Practice Network. Lifestyle Modification Program grant funding. http://www.agpn.com.au/programs/chronic-disease-prevention-and-management2/prevention-of-type-2-diabetes-program/lifestyle-modification-program-pilot-and-seed-grant-funding (accessed Jul 2012).
- 18. Fanaian M, Laws RA, Passey M, et al. Health Improvement and Prevention Study (HIPS) — evaluation of an intervention to prevent vascular disease in general practice. BMC Fam Pract 2010; 11: 57.
- 19. Hung DY, Shelley DR. Multilevel analysis of the chronic care model and the 5A services for treating tobacco use in urban primary care clinics. Health Serv Res 2009; 44: 103-127.
- 20. Counterweight Project Team. Evaluation of the Counterweight Programme for obesity management in primary care: a starting point for continuous improvement. Br J Gen Pract 2008; 58: 548-554.
- 21. Marshall AL, Smith BJ, Bauman AE, Kaur S. Reliability and validity of a brief physical activity assessment for use by family doctors. Br J Sports Med 2005; 39: 294-297.
- 22. Australian Bureau of Statistics. Census of Population and Housing: Socio-Economic Indexes for Areas (SEIFA), Australia. Data only, 2006. Canberra: ABS, 2008. (ABS Cat. No. 2033.0.55.001.) http://www.abs.gov.au/ausstats/abs@.nsf/mf/2033.0.55.001/ (accessed Aug 2012).
- 23. Murchie P, Campbell NC, Ritchie LD, et al. Secondary prevention clinics for coronary heart disease: four year follow up of a randomised controlled trial in primary care. BMJ 2003; 326: 84.
- 24. Rashbash J, Steele F, Browne W, Prosser B. Multilevel analysis with MLwiN software: a user’s guide to MLwiN version 2.0. Bristol: Centre for Multilevel Modelling, University of Bristol, 2005.
- 25. Paul-Ebhohimhen V, Avenell A. A systematic review of the effectiveness of group versus individual treatments for adult obesity. Obes Facts 2009; 2: 17-24.
- 26. Papadakis S, McDonald P, Mullen KA, et al. Strategies to increase the delivery of smoking cessation treatments in primary care settings: a systematic review and meta-analysis. Prev Med 2010; 51: 199-213.
Abstract
Objective: To evaluate the impact of a lifestyle intervention in Australian general practice to reduce the risk of vascular disease.
Design, setting and participants: Stratified cluster randomised controlled trial among 30 general practices in New South Wales from July 2008 to January 2010. Patients aged 40–64 years were invited to participate. The subgroup who were 40–55 years of age were included only if they had either hypertension or dyslipidaemia.
Intervention: A general practice-based health-check with brief lifestyle counselling and referral of high-risk patients to a program consisting of one to two individual visits with an exercise physiologist or dietitian, and six group sessions.
Main outcome measures: Outcomes at baseline, 6 and 12 months included the behavioural and physiological risk factors for vascular disease — self-reported diet and physical activity, and measured weight, body mass index, waist circumference, blood lipid and blood sugar levels, and blood pressure.
Results: Of the 3128 patients who were invited, 958 patients (30.6%) responded and 814 were eligible to participate. Of these, 699 commenced the study, and 655 remained in the study at 12 months. Physical activity levels increased to a greater extent in the intervention group than the control group at 6 and 12 months (P = 0.005). There were no other changes in behavioural or physiological outcomes or in estimated absolute risk of cardiovascular disease at 12 months. Of the 384 enrolled in the intervention group, 117 patients (30.5%) attended the minimum number of group program sessions and lost more weight (mean weight loss, 1.06 kg) than those who did not attend the minimum number of sessions (mean weight gain, 0.73 kg).
Conclusion: While patients who received counselling by their general practitioner increased self-reported physical activity, only those who attended the group sessions sustained an improvement in weight. However, more research is needed to determine whether group programs offer significant benefits over individual counselling in general practice.
Trial registration: Australian New Zealand Clinical Trials Registry ACTRN12607000423415.