


How appropriate is the health care delivered to Australians? A seminal study in the United States showed that American adults received “recommended care” only 55% of the time in the years 1999–2000.1 Estimates of “appropriate care” — defined here as care in line with evidence-based or consensus-based guidelines2 — are limited in most countries, including Australia, to small groups of conditions, often in particular settings.3,4
Despite some evidence of great variations in care and poor compliance with guidelines (Box 1), no comprehensive study of the appropriateness of the health care received by Australians has been undertaken. Without such information, we will be unable to create sustainable systems that have “the capacity to measure, monitor and act on health care performance data”.8 Financial considerations alone would suggest that maximising the rate at which patients receive appropriate care is a national priority.9 The aim of the CareTrack Australia study reported here was to determine the percentage of health care encounters at which a sample of Australians received appropriate care.2
Details of the CareTrack study methods have been published elsewhere.2 The methods were based on the US study1 but differed in three main ways. Rather than convening expert panels, we recruited individual clinical experts to develop our clinical indicators; we recruited participants from rural and remote areas, in addition to metropolitan areas; and we conducted onsite medical record review rather than reviewing copied records at a central location.
We selected 22 conditions that include several of the most common in Australia, according to estimates of the burden of disease10 and studies of primary care activity.11 Fourteen of the 22 are National Health Priority Areas,12 and 15 were included in the US study.1 Three conditions2 — venous thromboembolism, surgical site infection, and antibiotic use — represent evidence–practice gaps.13,14 Although cancers account for 20% of disability-adjusted life-years,10 they were not included because of low projected numbers in the sample. Instead, screening indicators for colorectal, lung, breast and prostate cancer were included within the condition “preventive care”. Falls and pressure ulcers were not included because they were already being studied.15
Indicators for the 22 conditions were developed, modified or updated from the US study and other sources of indicators and guidelines.2 At the start, we rejected indicators not likely to be documented, such as a recommendation for “gowning and gloving” for a sterile procedure. The 22 conditions were grouped into 11 specialty areas, and experts considered to be clinical leaders in their fields were identified and sent indicators for each relevant condition, together with a CareTrack information pack and a request for them to participate in the review process.
This process resulted in 522 indicators being ratified as representing appropriate care in line with that expected in 2009–2010. Compliance with these indicators was used to determine whether key aspects of appropriate care were adhered to in the study sample. All 522 indicators, with their source, number of reviewers, mean appropriateness score, level of evidence, and whether they were underuse or overuse indicators, are listed in Appendix 1. For example, an indicator measured for overuse was “patients with atrial fibrillation were NOT prescribed warfarin if there was evidence of active bleeding”, and an indicator measured for underuse was “patients hospitalised with asthma were prescribed systemic steroids”.
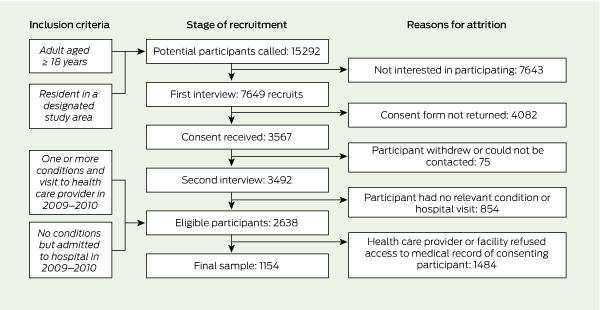
Box 2 shows the stages of recruitment, and reasons for participant attrition. The sample was designed to be representative of the socioeconomic characteristics and location of the Australian population.16 Residential landline telephone numbers in selected areas in New South Wales and South Australia17,18 were randomly chosen from the online White Pages (http://www.whitepages.com.au).
Surveyors assessed all components of electronic and paper records for 2009–2010, including laboratory results, referral letters and entries by practice nurses and allied health professionals. Surveyors answered each indicator question as “yes” (evidence that care provided during an eligible encounter was consistent with the indicator), “no” (no evidence that care provided during an eligible encounter was consistent with the indicator), or “not applicable” (the encounter was not eligible for the indicator in question).2 Indicators deemed ineligible at any particular encounter were not scored or included in calculating compliance. Our web-based tool filtered out encounters in which an indicator was ineligible, based on algorithms taking into account the type of HCP or facility and the participant’s condition and sex (eg, male participants were not eligible for a mammogram). Surveyors deemed a further set of encounters as being ineligible for an indicator using exclusion criteria such as allergies, known contraindications and specific comorbidities or treatments (eg, a patient for whom anticoagulation was indicated but who was at risk of bleeding; a patient in whom β-blockers were indicated but who had a history of asthma; a patient with asthma who did not have an exacerbation during the study period). Although each indicator had associated inclusion and exclusion criteria, it was impossible to list every conceivable criterion, and surveyors were encouraged to use their clinical judgement to make decisions about the eligibility of each indicator at any particular encounter. Weekly meetings were held to progressively harmonise surveyors’ views.
Compliance was measured as the percentage of eligible encounters at which the indicator question was answered “yes”. Condition-level and overall results were obtained by combining indicator-level data. Modified Clopper–Pearson (exact) 95% confidence intervals were calculated using PROC SURVEYFREQ in SAS version 9.3 for Windows (SAS Institute, Cary, NC, USA), with Taylor series linearisation19 to estimate the variance; this takes into account the complex sampling design. Detailed indicator-level and condition-level results are beyond the scope of this article and will be reported separately.
Eligibility criteria and the need for respondents to have at least one of the study conditions meant that weighting the final sample to the general population was inappropriate. Several weighting procedures were nevertheless considered, and two options with five sub-versions were carried out (including one similar to that used in the US study1). As overall compliances were stable with these five different weighting options (seeAppendix 2), unweighted results are presented here.
Ethics approval was obtained from all relevant bodies and sites.2 The identities of all patients, HCPs and facilities were protected by gaining statutory immunity for CareTrack as a quality assurance activity from the federal Minister for Health under Part VC of the Health Insurance Act 1973 (Cwlth).
There were 1154 participants in the final sample (Box 2), with a mean age of 63 years (range, 19–96 years); 669 (58%) were female. The average number of conditions per participant was 2.9 (range, 1–11). At interview, participants nominated an average of two HCPs (range, 1–7). The mean number of HCP records accessed by surveyors was 1.3 per participant (range, 1–4). Surveyors assessed a total of 270 052 encounters; of these, 234 479 were deemed ineligible through software filtering (84 937) or surveyor review (149 542), leaving 35 573 eligible encounters between participants and HCPs.
Participants at the first interview and in the final sample closely matched the distribution of the Australian population by region (Box 3). The mean Index of Relative Socio-economic Disadvantage of our sample was 993 (similar to the nationwide mean of 1000), with a range of 764–1122, spanning all five quintiles. Differences between our sample and the putative reference population are discussed in Appendix 2.
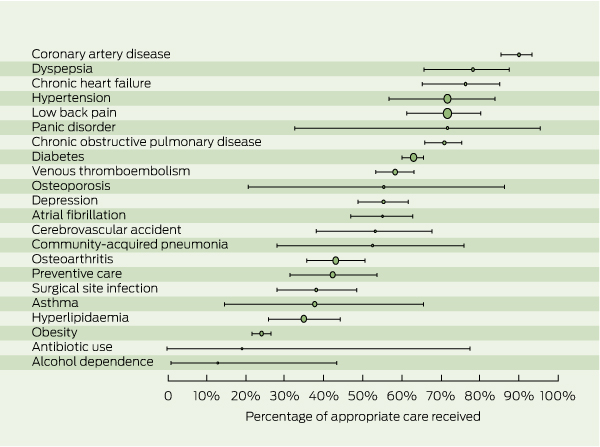
Box 4 shows the numbers of indicators, participants, and eligible encounters for each condition, and the percentage of encounters at which appropriate care was received. Box 5 provides a graphical representation.
Overall, Australians in our sample received appropriate care at 57% (95% CI, 54%–60%) of 35 573 eligible encounters. With weighting, the percentage of appropriate care ranged from 54% to 57% (see Appendix 2). For 39 HCPs with more than 300 eligible encounters each, compliance ranged from 32% to 86%.
Compliance was poor across conditions for the use of recommended risk assessment tools and appropriate responses to severe or deteriorating conditions. Four indicators measured the use of tools for condition-specific risks (Australian type 2 diabetes risk assessment tool [AUSDRISK],20 ABCD2 for cerebrovascular accident,21 and CURB-6522 or Pneumonia Severity Index23 for community-acquired pneumonia). Overall compliance with use of these tools was 1% (range, 0–21%). As an example of a poor response to patients with severe or deteriorating conditions, 5% of 40 encounters involving participants with a blood pressure level ≥ 180/110 mmHg and 40% of 124 encounters with participants with a blood pressure level ≥ 140/90 mmHg were handled appropriately.
Australian patients in our sample received appropriate care at an average of 57% of eligible encounters during 2009 and 2010. This figure is strongly concordant with the weighted average of 55% of participants receiving “recommended care” reported from the US.1 Although there were pockets of excellence, with some individual HCPs complying with over 80% of indicators, and high overall compliance for some conditions (eg, 90% for coronary artery disease), much of the care provided in Australia appears to fall short of the ideal. Compliance was as low as 32% for some practices, and compliance was very low for some indicators (eg, only 1% for use of four risk assessment tools and only 5% for an appropriate response to severe hypertension).
they represent the activities that clinicians control most directly ... they do not generally require risk adjustment [and] they are consistent with the structure of national guidelines.1
Process measures can therefore be good targets for improvement. The issue of process versus outcome measurement has recently received attention.24,25 Publications from the US study1,26 provide some examples of strong links between compliance with process indicators and outcomes. Some processes examined in our study (data not shown), such as monitoring glycated haemoglobin levels in patients with diabetes (75% compliance here v 24% in the US study), and those for handling community-acquired pneumonia (52% compliance here v 39% in the US study) have outcome implications at both individual and societal level (for cardiovascular morbidity and antibiotic use, respectively). An example of a close link between process and outcome from CareTrack is the poor compliance (16%) with recommended timing of prophylactic antibiotics for reducing surgical site infection, which negates much of the positive impact of the antibiotics given. This finding is consistent with that from another Australian study.27 The cost of surgical site infection in Australia has been estimated at $268 million per year.14
Our study has some limitations. Study conditions were limited to those with sufficient prevalence to obtain meaningful results within the scope of the project. Nevertheless, these conditions account for nearly half the burden of disease in Australia.10
Although over 90% of indicators were reviewed during development by at least three experts (with most scored as appropriate [17%] or very appropriate [74%]), we received fewer than three expert responses for three conditions (obesity, community-acquired pneumonia and antibiotic use), despite sending these indicators to 69 reviewers. These were reviewed by clinicians in the research team (Appendix 1).
The use of a population-based rather than a convenience design is both a strength and a weakness. The strength lies in the ability to provide robust estimates across a range of HCPs, but the weakness is that there was a high attrition rate. The US study also had a high attrition rate, underlining the challenges of recruitment and consent. Further, our survey used a landline-based telephone survey, thus excluding people with only mobile phones. Nevertheless, telephone surveys together with post-stratification weighting (which we found did not change the results markedly) are still used both in Australia28 and internationally. The possible omission of people with poor English skills may limit the generalisability of our results, but does not negate them for the general population.
With respect to record review, if there was no documented evidence of an action, eligibility and/or compliance could not be assumed. Any overestimation of non-compliance associated with lack of documentation has been reported to be no more than 10%.1 Although κ scores between the trainer and surveyors were good for the artificially created medical record, they were moderate for implicit review of records in the field, due to the inconsistent structure of medical records and problems such as poor handwriting. This is consistent with other studies,29 underscoring the desirability of standardised electronic tools for facilitating and documenting care. The trainer’s results were not included in the final sample; had they been, compliance would have been lower than reported here. The types of discrepancies seen between the trainer and surveyors’ reviews are typical problem situations with implicit medical record review.29
Overall, our study identified highly variable care and poor compliance with some important indicators. The consistent delivery of appropriate care needs improvement, and the gaps in care that we identified should be addressed. The Cochrane Collaboration has provided some evidence that the use of standardised practice and feedback is associated with improvements.30,31 This was supported by the experience of the CareTrack surveyors and has been identified by others.32,33
Over 90% of Australians see a GP each year,34 and most of these practitioners use electronic information systems. Better design and more effective use of such systems by providers and patients represents a major opportunity for improving the appropriateness of health care.35
There is an urgent need to agree at a national level what constitutes basic care for important conditions, to embed this information in clinical standards, and for groups of experts to ensure that these standards are kept up to date. This must be a dynamic process that takes into account the relative importance of different indicators in different contexts and at different stages of life. Redundant guidelines must be retired and, with better structured medical records, continuous improvement based on ongoing monitoring of the appropriateness of care should become an intrinsic part of health care. Elsewhere in this issue of the Journal, we discuss the barriers to achieving this and offer recommendations for how they may be overcome.36
1 Recent examples of poor compliance with guidelines in Australia
Community-acquired pneumonia: Use of a recommended pneumonia severity index was documented in 5% of 691 presentations at 37 hospitals, and concordance with national guidelines in 18%, leading to inappropriate antibiotic use.5
Low back pain: Although guidelines discourage its use, more than a quarter of 3533 patient visits resulted in a referral for imaging. The recommended care focuses on advice and simple analgesics, yet only 21% and 18% of patients, respectively, received these.6
Hyperlipidaemia: Of 397 participants at high absolute risk, 24% received primary prevention, and of those who were already treated, 38% reached target levels.7
Received 19 March 2012, accepted 14 June 2012
- William B Runciman1,2
- Tamara D Hunt1
- Natalie A Hannaford1,2
- Peter D Hibbert3
- Johanna I Westbrook3
- Enrico W Coiera3
- Richard O Day4
- Diane M Hindmarsh3
- Elizabeth A McGlynn5
- Jeffrey Braithwaite3,2
- 1 University of South Australia, Adelaide, SA.
- 2 Australian Patient Safety Foundation, Adelaide, SA.
- 3 Australian Institute of Health Innovation, University of New South Wales, Sydney, NSW.
- 4 St Vincent’s Clinical School and School of Medical Sciences, University of New South Wales, Sydney, NSW.
- 5 Kaiser Permanente, Pasadena, Calif, USA.
We thank the participants, health care providers and expert reviewers who generously gave of their time. We also thank the surveyors: Laura Mudge, Heather Andrews, Sally Gregurke, Sally Whitaker, Paula Abrego, Kathy Mitchell and Toni McCallum Pardey; expert colleagues: Shanthi Ramanathan, Martin Basedow, Tim Schultz, Sharyn Lymer, Ling Li, Adam Dunn, Julie Halbert, Helena Williams, and Kaye Dolman; and the database tool designers and data collectors, Intersect and the Hunter Valley Research Foundation, for their contributions. This study was funded by a National Health and Medical Research Council program grant (no. 568612).
No relevant disclosures.
- 1. McGlynn EA, Asch SM, Adams J, et al. The quality of health care delivered to adults in the United States. N Engl J Med 2003; 348: 2635-2645.
- 2. Hunt TD, Ramanathan SA, Hannaford NA, et al. CareTrack Australia: assessing the appropriateness of adult healthcare: protocol for a retrospective medical record review. BMJ Open 2012; 2: e000665.
- 3. Evans A, Davis S, Kilpatrick C, et al. The morbidity related to atrial fibrillation at a tertiary centre in one year: 9.0% of all strokes are potentially preventable. J Clin Neurosci 2002; 9: 268-272.
- 4. Berner ES, Baker CS, Funkhouser E, et al. Do local opinion leaders augment hospital quality improvement efforts? A randomized trial to promote adherence to unstable angina guidelines. Med Care 2003; 41: 420-431.
- 5. Maxwell DJ, McIntosh KA, Pulver LK, Easton KL. Empiric management of community-acquired pneumonia in Australian emergency departments. Med J Aust 2005; 183: 520-524. <MJA full text>
- 6. Williams CM, Maher CG, Hancock MJ, et al. Low back pain and best practice care: a survey of general practice physicians. Arch Intern Med 2010; 170: 271-277.
- 7. Janus ED, Tideman PA, Dunbar JA, et al. Dyslipidaemia in rural Australia: prevalence, awareness, and adherence to treatment guidelines in the Greater Green Triangle Risk Factor Study. Med J Aust 2010; 192: 127-132. <MJA full text>
- 8. Brand CA, Ibrahim JE, Cameron PA, Scott IA. Standards for health care: a necessary but unknown quantity. Med J Aust 2008; 189: 257-260. <MJA full text>
- 9. Runciman WB. Is money spent on quality improvement money better spent on clinical care? No. Med J Aust 2011; 194: 641. <MJA full text>
- 10. Australian Institute of Health and Welfare. Australia’s health 2010. Canberra: AIHW, 2010. (AIHW Cat. No. AUS 122; Australia’s Health Series No. 12.)
- 11. Britt H, Miller GC, Charles J, et al. General practice activity in Australia 2000–01 to 2009–10: 10 year data tables. Canberra: AIHW, 2010. (AIHW Cat. No. GEP 28; General Practice Series No. 28.) http://www.aihw.gov.au/publication-detail/?id=6442472440 (accessed Feb 2011).
- 12. National Health Priority Action Council. National Chronic Disease Strategy. Canberra: Australian Government Department of Health and Ageing, 2006.
- 13. National Institute of Clinical Studies. Evidence–practice gaps report, volume 1. Melbourne: NICS, 2003.
- 14. Australian Council for Safety and Quality in Health Care. National strategy to address health care associated infections. Canberra: Commonwealth of Australia, 2003.
- 15. University of Queensland Centre for Research in Geriatric Medicine. Programs of research. http://www.som.uq.edu.au/research/research-centres/centre-for-research-in-geriatric-medicine/our-research/programs-of-research.aspx (accessed Feb 2011).
- 16. Australian Bureau of Statistics. Socio-Economic Indexes for Areas: introduction, use and future directions, Sep 2006. Canberra: ABS, 2006. (ABS Cat. No. 1351.0.55.015.)
- 17. Australian Bureau of Statistics. Australian demographic statistics, Jun 2010. Canberra: ABS, 2010. (ABS Cat. No. 3101.0.) http://www.abs.gov.au/ausstats/abs@.nsf/mf/3101.0 (accessed Feb 2011).
- 18. Australian Bureau of Statistics. Australian social trends, 2008. Canberra: ABS, 2008. (ABS Cat. No. 4102.0.) http://www.abs.gov.au/ausstats/abs@.nsf/mf/4102.0 (accessed Feb 2011).
- 19. Cochran WG. Sampling techniques. 3rd ed. New York: John Wiley & Sons, 1977.
- 20. Australian Government Department of Health and Ageing. Prevention of Type 2 Diabetes Program. Australian type 2 diabetes risk assessment tool (AUSDRISK). http://www.health.gov.au/internet/main/publishing.nsf/Content/chronic-diab-prev-aus (accessed Sep 2010).
- 21. National Stroke Foundation. Clinical guidelines for acute stroke management. Canberra: National Health and Medical Research Council, 2007.
- 22. Western Australian Therapeutic Advisory Group. Management of community acquired pneumonia (CAP) in adults: assessment of severity using CURB-65 score and treatment guidelines. Perth: WATAG, 2005.
- 23. Royal Adelaide Hospital Safety and Quality Unit. Community acquired pneumonia management protocol. Adelaide: RAH, 2006. http://www.mediflight.com.au/media/files/1563.pdf (accessed Aug 2010).
- 24. Lilford RJ, Brown CA, Nicholl J. Use of process measures to monitor the quality of clinical practice. BMJ 2007; 335: 648-650.
- 25. Runciman WB, Baker GR, Michel P, et al. The epistemology of patient safety research. Int J Evid Based Healthc 2008; 6: 476-486.
- 26. Mangione-Smith R, DeCristofaro AH, Setodji CM, et al. The quality of ambulatory care delivered to children in the United States. N Engl J Med 2007; 357: 1515-1523.
- 27. Bull AL, Russo PL, Friedman ND, et al. Compliance with surgical antibiotic prophylaxis — reporting from a statewide surveillance programme in Victoria, Australia. J Hosp Infect 2006; 63: 140-147.
- 28. Centre for Epidemiology and Research. New South Wales Population Health Survey: 2010 report on adult health. Sydney: NSW Department of Health, 2011. http://www.health.nsw.gov.au/resources/publichealth/surveys/pdf/hsa_10pub.pdf (accessed May 2012).
- 29. Thomas EJ, Lipsitz SR, Studdert DM, Brennan TA. The reliability of medical record review for estimating adverse event rates. Ann Intern Med 2002; 136: 812-816.
- 30. Jamtvedt G, Young JM, Kristoffersen DT, et al. Audit and feedback: effects on professional practice and health care outcomes. Cochrane Database Syst Rev 2006; (2): CD000259.
- 31. Rotter T, Kinsman L, James EL, et al. Clinical pathways: effects on professional practice, patient outcomes, length of stay and hospital costs. Cochrane Database Syst Rev 2010; (3): CD006632.
- 32. Scott I. What are the most effective strategies for improving quality and safety of health care? Intern Med J 2009; 39: 389-400.
- 33. Registered Nurses’ Association of Ontario. Toolkit: implementation of clinical practice guidelines. Toronto: RNAO, 2002. http://rnao.ca/bpg/resources/toolkit-implementation-clinical-practice-guidelines (accessed Jun 2012).
- 34. Mazza D, Shand LK, Warren N, et al. General practice and preventive health care: a view through the eyes of community members. Med J Aust 2011; 195: 180-183. <MJA full text>
- 35. Shekelle PG, Morton SC, Keeler EB. Costs and benefits of health information technology. Evidence Report/Technology Assessment No. 132 (prepared by the Southern California Evidence-based Practice Center under Contract No. 290-02-0003.) AHRQ Publication No. 06-E006. Rockville, Md: Agency for Healthcare Research and Quality, 2006.
- 36. Runciman WB, Coiera EW, Day RO, et al. Towards the delivery of appropriate health care in Australia. Med J Aust 2012; 197: 78-81.
Abstract
Objective: To determine the percentage of health care encounters at which a sample of adult Australians received appropriate care (ie, care in line with evidence-based or consensus-based guidelines).
Design, setting and participants: Computer-assisted telephone interviews and retrospective review of the medical records (for 2009–2010) of a sample of at least 1000 Australian adults to measure compliance with 522 expert consensus indicators representing appropriate care for 22 common conditions. Participants were selected from households in areas of South Australia and New South Wales chosen to be representative of the socioeconomic profile of Australians. Health care encounters occurred in health care practices and hospitals with general practitioners, specialists, physiotherapists, chiropractors, psychologists and counsellors.
Main outcome measure: Percentage of health care encounters at which the sample received appropriate care.
Results: From 15 292 households contacted by telephone, 7649 individuals agreed to participate, 3567 consented, 2638 proved eligible, and 1154 were included after gaining the consent of their health care providers. The adult Australians in this sample received appropriate care at 57% (95% CI, 54%–60%) of 35 573 eligible health care encounters. Compliance with indicators of appropriate care at condition level ranged from 13% (95% CI, 1%–43%) for alcohol dependence to 90% (95% CI, 85%–93%) for coronary artery disease. For health care providers with more than 300 eligible encounters each, overall compliance ranged from 32% to 86%.
Conclusions: Although there were pockets of excellence and some aspects of care were well managed across health care providers, the consistent delivery of appropriate care needs improvement, and gaps in care should be addressed. There is a need for national agreement on clinical standards and better structuring of medical records to facilitate the delivery of more appropriate care.