


While Australia’s system of financing primary health care has been in operation for almost 30 years,1 there have been surprisingly few attempts to understand the degree to which health care provided under Medicare is related to socioeconomic factors such as income. While some analyses have examined equity of access to certain aspects of the system, such as visits to general practitioners,2-4 what has previously been unavailable is information on the distribution of Medicare funding. This requires Medicare records to be linked at a patient level to information on socioeconomic status, such as levels of household income. For such an analysis to be meaningful, it is necessary to control for differences in morbidity across income groups, since chronic disease is likely to be concentrated in lower income households,5 and this will require a higher level of health expenditure.
In recent years, the government has introduced a number of items under the Medicare Benefits Schedule (MBS) to mitigate the burden of disease associated with chronic illness. Such items include those under the Chronic Disease Management (CDM) program, the Chronic Disease Dental Scheme (CDDS), and various allied health services. The CDM program aims to improve the coordination of care for people with chronic conditions and complex care needs. The CDM Medicare items provide funding to GPs to manage the health care of eligible patients by preparing, coordinating, reviewing and/or contributing to GP Management Plans (GPMPs) and Team Care Arrangements (TCAs). Once a GPMP and a TCA are in place, GPs can refer patients to a range of providers, such as occupational therapists, speech pathologists and podiatrists, for a set number of Medicare-rebatable services.6 Similarly, the CDDS allows eligible patients (those with chronic conditions and complex care needs and a GPMP and TCA in place) up to $4250 worth of Medicare-funded dental services over 2 consecutive years.7
In this study, we use patient-level data from the Australian Hypertension and Absolute Risk Study (Aus HEART)8 that have been linked with Medicare administrative records over a 1-year period to assess the level of equity in the distribution of benefits overall and under the schemes listed earlier. An important feature of this study is that it combines information obtained from the patient on self-reported health status and socioeconomic and demographic characteristics with clinical information provided in the course of a GP examination. This allows us to examine annual Medicare expenditure across income groups after controlling for differences in need resulting from age, sex and reported health status, as well as a range of clinically assessed conditions.
A total of 322 GPs provided data for the AusHEART study, which has been described previously.8 The Aus HEART researchers selected a stratified random sample of 534 GPs nationwide from the 1416 who expressed interest in participating in the study. Each GP was asked to provide clinical information on 15–20 consecutively presenting, consenting patients aged 55 years and over, irrespective of their reason for the consultation. All patients were given an option to consent to a second component of the study, namely linkage with Medicare administrative data. To account for oversampling in rural and remote practices, weights were generated according to age, sex and remoteness to ensure the sample used in all analyses was representative of the Australian population aged 55 years and over.9 The study was approved by the Royal Australian College of General Practitioners National Research and Evaluation Ethics Committee.
We used socioeconomic data and information on other personal characteristics and behaviours as reported in the patient-completed questionnaire. Participants were asked to classify their gross household income into one of seven categories, ranging from negative or nil income to $2000 or more per week. To adjust for different household composition, we employed Organisation for Economic Co-operation and Development equivalence weights10 (where a value of 1 was assigned to the head of the household, 0.5 to each additional adult and 0.3 to each child) and applied these to the mean of the bounds of each income category. Other information from the patient survey used in the analysis included age, sex, self-reported health (measured on a five-point scale, from excellent to poor) and smoking status.
MBS items were grouped into the following categories based on the November 2008 edition of the MBS handbook: CDM (items 721–731), allied health (items 10950–10970 and 81100–81125) and dental (items 85011–87777).11 Finally, there was a balancing category of out-of-hospital balance, which comprises all the other Medicare services that Medicare Australia shows as provided out of hospital. Medicare rebates, or benefits, for the above categories were summed over a 1-year period (1 July 2008 to 30 June 2009) for each consenting patient. We derived an indicator variable for current treatment for cancer using data from the MBS and Pharmaceutical Benefits Scheme (PBS).
We employed the concentration curve and the concentration index, which are commonly used methods to determine the distribution of medical expenditure across income.2 The concentration curve provides a graphical illustration of inequality in health care expenditure by displaying the cumulative proportion of the population ranked by income from lowest to highest on the horizontal axis, against the cumulative proportion of Medicare benefits on the vertical axis.12-14 A 45-degree line represents a situation in which expenditure is equally spread across income groups. If the concentration curve lies above or below the line of equality, benefits are more highly concentrated among lower income groups (pro-poor) or the higher income groups (pro-rich), respectively. The further the concentration curve is from the line of equality, the greater the degree of inequality. The degree of inequality is summarised by the concentration index,15,16 which is measured as twice the area between the concentration curve and the line of equality.5 A positive index indicates that benefits are pro-rich, and a negative value indicates a pro-poor distribution. The concentration index can range in value from − 1 to 1, with an index of 0 denoting perfect equality.
It is important to recognise that differences in health expenditure can result from differences in medical need (eg, people with chronic conditions will generally require higher medical expenditure for their treatment). One can account for differences in need across income groups through indirect standardisation, a statistical procedure that allows for the comparison of summary measures across heterogeneous population groups.2 In this context, standardisation provides a method to estimate average expected expenditure of people with different health conditions regardless of level of income. The actual expenditure in each income group is compared with expected expenditure to determine the distribution of expenditure after taking need into account.5 We standardised Medicare expenditure according to need as determined by age, sex, self-reported health and established conditions including cardiovascular disease, diabetes, chronic kidney disease and treatment for cancer. Since we do not have data representing specific need for dental services, we standardised dental items according to age and sex alone.
Clinical and socioeconomic details of the study sample are summarised in Box 1, along with comparative statistics of the entire AusHEART sample. The results of t tests and z tests showed that no variables differed significantly between the two samples (Box 1, last two columns) at the 5% level of significance.
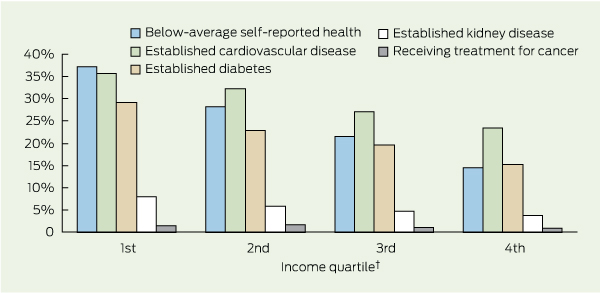
Box 2 shows the proportion of people with chronic conditions and those reporting below-average self-assessed health across the income groups. It is evident that there is a higher concentration of people reporting below-average health (ie, “fair” or “poor”) among lower income quartiles (trend test P < 0.001). About 37% of people in the lowest income quartile reported below-average health, compared with 15% in the highest income quartile. Trend tests found an income-related gradient for cardiovascular disease (P < 0.001), diabetes (P < 0.001) and kidney disease (P = 0.002), but not for cancer (P = 0.23).
Box 3 displays the need-adjusted concentration curves, and the unadjusted and need-adjusted indices for benefits accruing from the schemes. The overall concentration index for unadjusted out-of-hospital Medicare expenditure is − 0.069 (95% CI, − 0.069 to 0.068), compared with − 0.008 (95% CI, − 0.009 to 0.008) for need-adjusted expenditure. A further analysis showed that total unadjusted Medicare expenditure in the lowest income quartile was $394.65 higher per year (95% CI, $237.15 to $552.20) than that in the highest quartile. After accounting for need, the difference was reduced to $22.90 (95% CI, − $118.45 to $164.30), which is less than 2% of average annual benefits per capita, suggesting that overall need-adjusted expenditure is relatively evenly distributed across income groups. The need-adjusted indices for CDM and allied health items are slightly larger in magnitude, indicating that expenditures accruing from these services are slightly pro-poor. In contrast, the size of the concentration index for need-adjusted dental benefits is much larger at − 0.205 (95% CI, − 0.208 to − 0.201), and the concentration curve is much further from the line of equality, suggesting that dental benefits favour lower income households, as the two lowest income groups received more than two and a half times the amount of funding as the highest income group.
Factors that were associated with the use of these schemes were determined using multivariate analyses (Box 4). Across all three categories, the propensity to use was significantly higher for people with one or more comorbid conditions, those reporting below-average self-assessed health, and for those in the second income quartile. People located in regional and remote areas were 69% less likely to use the CDDS.
Previous international comparisons of primary care use involving Australia have shown that GP access was also evenly distributed across income after adjusting for need based on self-reported health.2 A subsequent analysis also showed variation across types of providers, with GP use tending to be pro-poor and specialist use pro-rich.4 This study extends these findings in two respects. First, having access to administrative Medicare data allowed us to quantify average government expenditure across different income groups, which is something that cannot be obtained from population-level surveys. Second, the study involved a detailed clinical assessment that allows for a more refined degree of adjustment for medical need.
The merits of the CDDS have been the subject of ongoing debate,17 and recently the federal government announced the closure of the scheme from 1 December 2012.7 The Health Minister has questioned the merits of the scheme on the grounds that it is costly and may not be equitable.18 Alongside these views are those of the National Advisory Council on Dental Health, which sees an expansion of the CDDS as one of the ways to expand publicly financed dental care in Australia.19 While our study does not shed light on the merits of financing dental care through Medicare, the results do provide evidence that the CDDS in the period after its introduction was primarily used by people from lower income households; as the lower-half of the income distribution received more than two and a half times the amount of funding as the highest income group. In this regard it appears to be one of the more progressive elements of Medicare expenditure across income groups. If it is the objective of the government to better target dental services to low-income groups, then it would be important to show that new mechanisms of publicly financing dental care would be more progressive than the CDDS.
This study has several important limitations. First, our study captures equity only among older patients who have consulted a GP, and therefore, the likelihood of inclusion in the sample is related to Medicare use. While only around 15% of the adult population do not consult a doctor at least once per year,2 more frequent users are more likely to be included in this sample. To examine if our results were sensitive to the form of selection, we applied sample weights that were inversely proportional to observed number of GP visits and found little effect on the overall results. Second, we only have information on self-reported income as opposed to actual income, and this was grouped into categorical bands. Unless data linkage can be extended to income as reported in taxation records, which is the case in countries such as Sweden,20 this limitation is difficult to overcome. Third, the number of patients taking up the CDDS was small, and we could not control for differences in need relating directly to oral health. This could be amended by including relevant questions in future patient surveys, or clinical assessment of dental need. Finally, the study primarily examines use over a 1-year period. Examining a longer period will enhance our understanding of Medicare payments over the life cycle.
This study represents a starting point in understanding the distributional effect of Medicare and broader health care expenditure, such as the distribution of publicly subsidised pharmaceuticals through the PBS. While there are examples of studies quantifying health care costs using cross-jurisdictional data linkage in Australia,21 these generally do not involve linkage with clinical and patient-provided information. Further, population health surveys conducted by the Australian Bureau of Statistics22 do not currently involve linkage with administrative data such as Medicare use. Although surveys such as the Australian Longitudinal Study on Women’s Health23 and the 45 and Up Study24 link to administrative data, they do not involve clinical assessments. A unique feature of this study is that we have combined information from patients and clinicians with administrative information to measure the equity of Medicare funding in Australia. This highlights the need for linked administrative health data to be collected from a representative sample of the Australian population and for this to be linked to clinical and socioeconomic information at an individual level. Such data linkage could provide the necessary evidence to develop funding policies and monitor the implementation of programs to ensure that resources flow to Australians with the greatest need.
1 Characteristics of patients in the AusHEART study
3 Concentration curves illustrating the distribution of benefits across income,* and summary concentration indices for benefits accruing from Medicare schemes
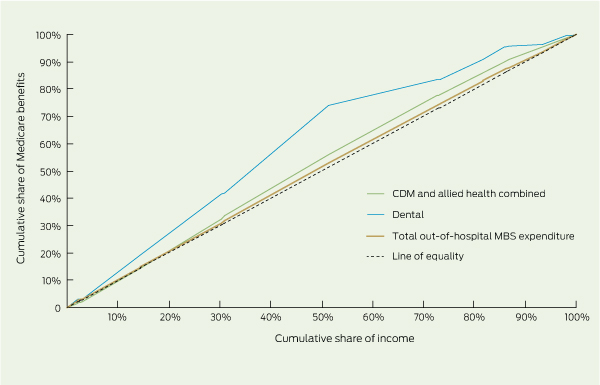
Expense per capita as a proportion of total out-of-hospital MBS |
|||||||||||||||
CDM = chronic disease management. MBS = Medicare Benefits Schedule. |
|||||||||||||||
Received 20 March 2012, accepted 5 September 2012
- Rachel J Knott1
- Alan Cass2
- Emma L Heeley2
- John P Chalmers2
- David P Peiris2
- Philip M Clarke1
- 1 Melbourne School of Population Health, University of Melbourne, Melbourne, VIC.
- 2 The George Institute for Global Health, University of Sydney, Sydney, NSW.
We thank the 532 general practitioner investigators who participated in the study. Those who submitted data for 15 or more patients were eligible for 40 Category 1 points for the Royal Australian College of General Practitioners Quality Improvement and Continuing Professional Development Program. The study was supported by an unrestricted educational grant from Servier Australia. Rachel Knott’s PhD studies were partly funded by National Health and Medical Research Council (NHMRC) Capacity Building Grant (571372). Alan Cass is a recipient of a Senior Research Fellowship from the NHMRC. Philip Clarke holds an NHMRC Career Development Award.
The AusHEART study was conducted as a collaborative project between the George Institute for Global Health and Servier Australia. Emma Heeley and Philip Clarke have received travel grants from Servier. Alan Cass has received an honorarium for speaking at a national education meeting sponsored by Servier. John Chalmers has received research grants and lecture fees from Servier.
- 1. van Doorslaer E, Masseria C, Koolman X; OECD Health Equity Research Group. Inequalities in access to medical care by income in developed countries. CMAJ 2006; 174: 177-183.
- 2. Biggs A. Medicare — background brief. 2004. http://www.aph.gov.au/About_Parliament/Parliamentary_Departments/Parliamentary_Library/Publications_Archive/archive/medicare (accessed Sep 2012).
- 3. Lairson DR, Hindson P, Hauquitz A. Equity of health care in Australia. Soc Sci Med 1995; 41: 475-482.
- 4. van Doorslaer E, Clarke P, Savage E, Hall J. Horizontal inequities in Australia’s mixed public/private health care system. Health Policy 2008; 86: 97-108.
- 5. O’Donnell O, van Doorlsaer E, Wagstaff A, Lindelow M. Analyzing health equity using household survey data. Washington, DC: World Bank Institute, 2007. http://go.worldbank.org/LVSSZJX9O0 (accessed Sep 2012).
- 6. Department of Health and Ageing. MBS Primary Care Items. Chronic Disease Management (CDM) Medicare Items. 2011. http://www.health.gov.au/internet/main/publishing.nsf/Content/mbsprimarycare-chronicdiseasemanagement (accessed Mar 2012).
- 7. Department of Health and Ageing. Dental Health. Chronic Disease Dental Scheme. 2011. http://www.health.gov.au/internet/main/publishing.nsf/content/dental+care+services (accessed Mar 2012).
- 8. Heeley EL, Peiris DP, Patel AA, et al. Cardiovascular risk perception and evidence–practice gaps in Australian general practice (the AusHEART study). Med J Aust 2010; 192: 254-259. <MJA full text>
- 9. Australian Bureau of Statistics. Population by age and sex, regions of Australia, 2008. Canberra: ABS, 2009. (ABS Cat. No. 3235.0.) http://www.abs.gov.au/AUSSTATS/abs@.nsf/Lookup/3235.0Main+Features12008?OpenDocument (accessed Jun 2012).
- 10. Hagenaars A, de Vos K, Zaidi MA. Poverty statistics in the late 1980s: research based on micro-data. Luxembourg: Office for Official Publications of the European Community, 1994.
- 11. Department of Health and Ageing. Medicare Benefits Schedule Book. Canberra: DoHA, 2008. http://www.mbsonline.gov.au/internet/mbsonline/publishing.nsf/Content/C08AD6216BF5A5F4CA2574F80001AA0E/$File/200811Complete.pdf (accessed Mar 2012).
- 12. Kakwani NC. Measurement of tax progressivity: an international comparison. Economic Journal 1977; 87: 71-80.
- 13. Wagstaff A, Paci P, van Doorslaer E. On the measurement of inequalities in health. Soc Sci Med 1991; 33: 545-557.
- 14. Wagstaff A, van Doorslaer E. Equity in health care finance and delivery. In: Culyer AJ, Newhouse JP, editors. Handbook of health economics. Vol IB. Amsterdam: Elsevier North-Holland, 2000: 1803-1862.
- 15. Kakwani N, Wagstaff A, van Doorslaer E. Socioeconomic inequalities in health: measurement, computation, and statistical inference. J Econometrics 1997; 77: 87-103.
- 16. Wagstaff A, van Doorslaer E, Paci P. Equity in the finance and delivery of health care: some tentative cross-country comparisons. Oxf Rev Econ Policy 1989; 5: 89-112. doi:10.1093/oxrep/5.1.89.
- 17. Palfreeman V, Zoellner H. Description of comprehensive dental services supported by the Medicare Chronic Disease Dental Scheme in the first 23 months of operation. Aust N Z J Public Health 2012; 36: 69-75.
- 18. Dunlevy S. Tanya Plibersek to reform dental scheme. The Australian 2011; 14 Dec. http://www.theaustralian.com.au/national-affairs/health/tanya-plibersek-to-reform-dental-scheme/story-fn59nokw-1226221317090 (accessed Sep 2012).
- 19. Department of Health and Ageing. Dental health. Final report of the National Advisory Council on Dental Health. Canberra: DoHA, 2012. http://www.health.gov.au/internet/main/publishing. nsf/Content/final-report-of-national-advisory-council-on-dental-health.htm (accessed Mar 2012).
- 20. Gerdtham U, Johannesson M. Income-related inequality in life-years and quality-adjusted life-years. J Health Econ 2000; 19: 1007-1026.
- 21. Clarke P, Leal J, Kelman C, et al. Estimating the cost of complications of diabetes in Australia using administrative health-care data. Value Health 2008; 11: 199-206.
- 22. Australian Bureau of Statistics. National Health Survey: summary of results. (ABS Cat. No. 4364.0.) www.abs.gov.au/ausstats/abs@.nsf/mf/4364.0 (accessed Mar 2012).
- 23. Women’s Health Australia. How to access ALSWH data. 2012. http://www.alswh.org.au/accessingdata.html (accessed Mar 2012).
- 24. Sax Institute. The 45 and Up Study. Information for researchers. 2007. http://www.45andup.org. au/applyingtousethestudyresource.aspx (accessed Mar 2012).
Abstract
Objective: To use patient-level data, clinical information and linked Medicare records to assess the distribution of benefits (rebates) across income groups, including benefits relating to chronic conditions such as the Chronic Disease Dental Scheme (CDDS).
Design, setting and participants: Nationally representative, cluster-stratified survey (the Australian Hypertension and Absolute Risk Study) involving 322 general practitioners who each collected clinical data on 15–20 patients aged ≥ 55 years who presented between 1 April 2008 and 30 June 2008 and who consented to have their information linked with Medicare administrative records over 12 months.
Main outcome measures: Distribution of total out-of-hospital Medicare expenditure quantified using concentration indices and determinants of use calculated by odds ratios.
Results: There were 2862 patients in the study. After controlling for need, the concentration index for overall funding was slightly progressive (pro-poor) at − 0.008 (95% CI, − 0.009 to − 0.008). Medicare expenditure on chronic care-related services consistently contributed to progressivity of the overall scheme, particularly services under the CDDS with a need-adjusted concentration index of − 0.205 (95% CI, − 0.208 to − 0.201). Uptake of chronic care items varied by locality and comorbid conditions (there was greater uptake by patients with one or more comorbid conditions).
Conclusions: Chronic care items, particularly dental items, have primarily been used by individuals from lower income households. Uptake of chronic care items contributes to the overall progressivity of Medicare.