


In Australia, regionalised maternity care aims to ensure provision of the appropriate level of care to all women, through assessment of risk, referral and transfer. An important element of this care is providing high-quality, safe and accessible services to women and babies in rural and remote areas.1,2 For women who experience pregnancy complications, this means their needs may not necessarily be met by their local hospital. They may be admitted and then be discharged or transferred or give birth. Babies born in a tertiary centre to women experiencing pregnancy complications (including those transferred from another hospital before the birth) have lower rates of morbidity and mortality than babies who are transferred after they are born.3,4
Pregnancy and childbirth is one of the most common reasons for hospital admission in Australia, and accounted for about 8% of all overnight acute admissions in 2009–10.5 Decisions to admit or transfer women who present to hospital with complications during pregnancy depend on various factors, including: severity of the complication; stage of pregnancy or labour; bed availability; availability of specific clinical expertise; hospital services; proximity of services to the woman’s home; women’s or clinician’s preferences; and availability of support at home.
The few studies that have examined admissions during pregnancy or the subsequent pathways for these women have been limited by non-representative populations6 or inability to track individuals through multiple admissions and transfers.7-9 Because of a lack of data on single or multiple admissions during pregnancy and transfers between facilities, it is not possible to evaluate how well the policy aims of equitable and efficient use of resources and optimal outcomes for neonates10 are being met.
Probabilistic linkage of birth and hospital records for mothers and babies was conducted by the Centre for Health Record Linkage and was approved by the NSW Population and Health Services Research Ethics Committee. These datasets have low rates of missing data and generally high levels of agreement when compared with medical records.11-13
The primary outcome was whether a preterm admission ended in discharge, maternal transfer to a hospital with a higher level of maternity care, or birth (Box 1). Outcomes of transfers to higher care were examined as discharge, transfer again to still higher care, transfer back to lower care, or birth. Neonatal outcomes for pregnant women admitted preterm were investigated, including length of stay, transfer, morbidity and mortality.14
Maternal characteristics (age, number of previous pregnancies, smoking during pregnancy, Indigenous status and area of residence) were obtained from the birth records. Quintile of socioeconomic status was determined by the Index of Relative Socio-economic Disadvantage,15 and remoteness category by the mean Accessibility/Remoteness Index of Australia (ARIA+) score for postcode of residence16 (Box 2, full version online only at mja.com.au). Reason for admission was based on the principal admission diagnosis on the hospital record. Hospitals were classified into seven groups based on available neonatal care and number of births, and urban or regional area.17
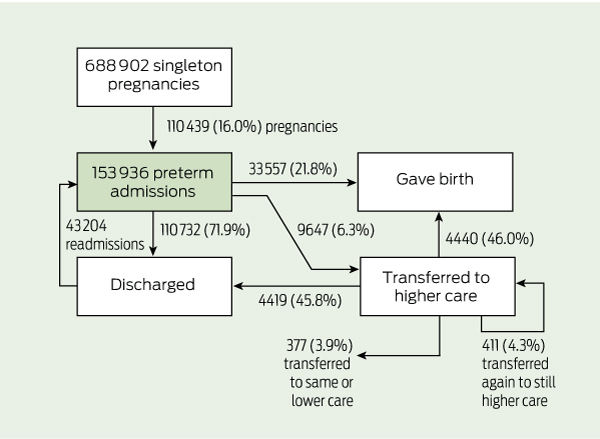
From 2001 to 2008 there were 688 902 liveborn singleton births at ≥ 24 weeks’ gestation, of which 110 439 (16.0%) involved a mother who was admitted to hospital during weeks 20–36 of the pregnancy (Box 1). These births were to 98 183 women, of whom 68 458 (69.7%) were admitted preterm during one pregnancy, 23 970 (24.4%) were admitted preterm during two pregnancies, and 5755 (5.9%) were admitted preterm during 3–6 pregnancies. The proportion of pregnancies during which the mother was admitted increased from 15.5% in 2001 to 16.2% in 2008 (trend P = 0.01).
Most initial preterm admissions (71.9%) ended in women being discharged without giving birth (Box 1 and Box 2). Women gave birth during 21.8% of initial admissions, and 6.3% resulted in transfer to a higher level of care. The median gestational age at which women were admitted was 33 weeks. The median time from admission until discharge, transfer to another facility or birth was 1 day (IQR 1–2 days; mean 2.3 days). Tertiary hospitals recorded the highest proportion of admissions (34.6%). The most common reasons for admission were preterm labour (18.7%), hypertension (11.5%) and haemorrhage (11.0%) (Box 2). Reasons for admission varied by hospital group and gestational age (data not shown). Hypertension and premature rupture of membranes accounted for more admissions as gestational age increased, while vomiting and abdominal pain accounted for fewer. The proportion admitted to each hospital group generally remained constant over the course of the pregnancy, although after 32 weeks the proportion increased at large urban hospitals and decreased at tertiary hospitals.
The proportion of women discharged ranged from 51.2% of those admitted for fetal anomalies through 59.3% with suspected preterm labour to 98.0% of women admitted for vomiting (Box 2). Preterm labour or premature rupture of membranes were the reasons for admission most likely to result in birth or transfer. From 33 weeks’ gestation, as the proportion of women transferred decreased, the proportion giving birth increased (Box 2). Factors that were independently and positively associated with birth during a preterm admission included: identifying as Aboriginal; maternal age ≥ 35 years; nulliparity; smoking during pregnancy; greater socioeconomic disadvantage; gestational age close to term; private care; admission to a tertiary hospital or hospital that was able to provide CPAP (continuous positive airway pressure) respiratory support; and year in which birth occurred (Box 3).
There were 9647 maternal transfers during pregnancy following an initial preterm hospital admission (Box 1). Overall, 76.4% were to tertiary hospitals, 15.4% to large regional hospitals, 7.1% to large urban hospitals able to provide CPAP respiratory support to neonates, and the remaining 1.1% to small regional or large urban hospitals. Of 1653 transfers from large regional hospitals, 96.7% were to tertiary hospitals, 3.0% to CPAP hospitals and the remainder to large urban hospitals. There were 3210 transfers from small regional and “other” hospitals; 46.1% of these were to large regional hospitals, 35.7% to tertiary hospitals and 14.7% to CPAP hospitals.
Admissions were significantly more likely to result in transfer if the woman was Aboriginal; aged ≥ 35 years; nulliparous or had had > 1 previous pregnancies resulting in birth; more socioeconomically disadvantaged; at < 36 weeks’ gestation; a public patient; or initially admitted to small hospitals, whether regional or urban (Box 3).
Of the women transferred to higher care, 4419 (45.8%) were discharged without giving birth (median length of admission, 3 days; IQR, 1–5 days), 4440 (46.0%) gave birth during the transfer admission, 411 (4.3%) were further transferred to higher care or between tertiary hospitals, and 377 (3.9%) were transferred to another hospital at the same or lower level of care (Box 1). Preterm labour (27.3%) and premature rupture of membranes (19.1%) were the main diagnoses reported for the transfer admission for women who gave birth or were further transferred to higher care, but 62.2% of the 2220 women with preterm labour in the transfer admission were discharged or transferred back to lower care. Time from transfer to discharge, transfer or birth was longest for women who were eventually transferred to lower care (median, 6 days; IQR, 3–12 days) and shortest for those who gave birth (median, 1 day; IQR, 1–4 days).
Infants born after maternal transfer had lower gestational age (median 32 weeks; IQR, 29–34 weeks) than those born in the initial preterm admission (median, 35 weeks; IQR, 34–36 weeks). After adjusting for gestational age, infants born after maternal transfer had similar mortality to those born in the initial admission, but had higher morbidity and were less likely to be discharged home (Box 4).
Maternal risk factors for transfer and birth among women admitted preterm in our study (advanced maternal age, extremes of parity, Aboriginality, smoking during pregnancy and social disadvantage), are recognised risk factors for adverse pregnancy outcomes.18,19 Suspected preterm labour was the most common reason for admission and was strongly associated with transfer and birth. However, for women admitted for preterm labour, the high rates of discharge following the initial admission (59%) and transfer (62%) highlight the difficulty in determining which pregnancies will be ongoing. Future improvements in assessment of threatened preterm labour may have considerable potential both to reduce length of stay for the initial admission and to reduce unnecessary transfers.
Preterm prelabour rupture of the membranes accounted for 5% of preterm admissions and was the strongest risk factor for transfer and birth. However, management of this condition remains a dilemma with respect to immediate birth or expectant management, and hospital or outpatient care.20 Hypertension and haemorrhage were the other major contributors to preterm admission, each accounting for 11% of admissions, but were weaker risk factors for transfer and birth. For most pregnancy conditions there is a paucity of evidence for keeping women in hospital for bed rest once their condition has stabilised.21-23
When a maternal or fetal risk is identified that may lead to preterm birth, optimal care is provided by ensuring care at a centre that has the expertise and facilities to provide appropriate management,24 although this may remove a woman from her family and other social supports. In our study, infants born after maternal transfer had lower gestational ages and were less likely to be discharged directly home, suggesting that clinicians do, in general, identify pregnancies that are at increased risk. However, almost half the women transferred were discharged without giving birth, about twice the rate observed in a population-based study in the United Kingdom.25 Differences in health care services, especially the distances involved with access to referral centres, make direct comparisons difficult. There may be more scope for reduction of unnecessary transfers in urban and outlying metropolitan areas in Australia, where distance is a less critical factor. Neonatal transfers, on the other hand, can represent “missed” opportunities for antenatal transfer; our findings suggest that “missed” transfers were mostly due to rapid progression of labour. Clinicians may have identified these women as candidates for transfer but were not confident of sufficient time to effect an antenatal transfer.
The availability of linked hospital admission data enabled us to calculate population rates of admission and transfer, unlike previous studies which have been limited to calculating ratios of admissions to pregnancies.7-9 Our finding of 18.4 non-birth admissions per 100 pregnancies is comparable with the findings of studies from other countries (12–30 per 100).7-9 The main overall reasons for admission in our study (preterm labour and hypertension) and for admission resulting in birth (premature rupture of membranes, preterm labour and hypertension) were also consistent with earlier studies.7-9,26 A US study reporting linked outcome information found that 66% of antenatal admissions ended in the woman being discharged without giving birth, compared with our findings of 72% in NSW; that study only counted antenatal admissions that were at least 4 days before the actual birth date.26
2 Maternal and admission characteristics by outcomes of preterm admission, New South Wales, 2001–2008*
Received 6 June 2011, accepted 12 October 2011
- Tim Badgery-Parker1
- Jane B Ford2
- Mary G Jenkins2
- Jonathan M Morris3
- Christine L Roberts2
- 1 Centre for Epidemiology and Research, NSW Ministry of Health, Sydney, NSW.
- 2 Clinical and Population Perinatal Health Research, Kolling Institute of Medical Research, Sydney, NSW.
- 3 Discipline of Obstetrics, Gynaecology and Neonatology, University of Sydney at Royal North Shore Hospital, Sydney, NSW.
We thank the NSW Ministry of Health for access to the population health data and the NSW Centre for Health Record Linkage for linking the datasets. This work was supported by an Australian National Health and Medical Research Council (NHMRC)/NSW Ministry of Health Partnership Grant (No. 571451). Christine Roberts is supported by an NHMRC Senior Research Fellowship (No. 457078) and Jane Ford by an NHMRC Capacity Building Grant (No. 573122).
No relevant disclosures.
- 1. NSW Health Department. The NSW framework for maternity services. Sydney: NSW Health, 2000.
- 2. NSW Department of Health. Guide to the role delineation of health services. 3rd ed. Sydney: NSW Health, 2003.
- 3. Phibbs CS, Bronstein JM, Buxton E, Phibbs RH. The effects of patient volume and level of care at the hospital of birth on neonatal mortality. JAMA 1996; 276: 1054-1059.
- 4. Sanderson M, Sappenfield WM, Jespersen KM, et al. Association between level of delivery hospital and neonatal outcomes among South Carolina Medicaid recipients. Am J Obstet Gynecol 2000; 183: 1504-1511.
- 5. Australian Institute of Health and Welfare. Australian hospital statistics 2009–10. Canberra: AIHW, 2011. (AIHW Cat. No. HSE 107; Health Services Series No. 40.)
- 6. Adams MM, Harlass FE, Sarno AP, et al. Antenatal hospitalization among enlisted servicewomen, 1987–1990. Obstet Gynecol 1994; 84: 35-39.
- 7. Adelson PL, Child AG, Giles WB, Henderson-Smart DJ. Antenatal hospitalisations in New South Wales, 1995–96. Med J Aust 1999; 170: 211-215.
- 8. Bacak SJ, Callaghan WM, Dietz PM, Crouse C. Pregnancy-associated hospitalizations in the United States, 1999–2000. Am J Obstet Gynecol 2005; 192: 592-597.
- 9. Liu S, Heaman M, Sauve R, et al. An analysis of antenatal hospitalization in Canada, 1991–2003. Matern Child Health J 2007; 11: 181-187.
- 10. NSW Department of Health. Neonatal intensive care service plan to 2006. Selected specialty and statewide service plans. Sydney: NSW Health, 2005.
- 11. Taylor L, Pym M, Bajuk B, et al. Validation study: NSW Midwives Data Collection 1998. New South Wales Mothers and Babies, 1998. NSW Public Health Bull 2000; 11 Suppl 1: 97-99.
- 12. Roberts CL, Bell JC, Ford JB, Morris JM. Monitoring the quality of maternity care — how well are labour and delivery events reported in population health data? Paediatr Perinat Epidemiol 2009; 23: 144-152.
- 13. Taylor L, Travis S, Pym M, et al. How useful are hospital morbidity data for monitoring conditions occurring in the perinatal period? Aust N Z J Obstet Gynaecol 2005; 45: 36-41.
- 14. Lain SJ, Algert CS, Nassar N, et al. Incidence of severe neonatal outcomes: use of a composite indicator in a population cohort. Matern Child Health J 2011; Apr 20. doi: 10.1007/s10995-011-0797-6.
- 15. Australian Bureau of Statistics. Census of population and housing: socio-economic indexes for areas (SEIFA), Australia — data only, 2006. Canberra: ABS, 2008. (ABS Cat. No. 2033.0.55.001.)
- 16. Australian Bureau of Statistics. Australian standard geographical classification (ASGC), July 2010. Canberra: ABS, 2010. (ABS Cat. No. 1216.0.)
- 17. Falster MO, Roberts CL, Ford JB, et al. Informing hospital role delineation: elective delivery of pregnant women before the due date. Australas Epidemiologist 2010; 17: 48.
- 18. Flenady V, Koopmans L, Middleton P, et al. Major risk factors for stillbirth in high-income countries: a systematic review and meta-analysis. Lancet 2011; 377: 1331-1340.
- 19. Goldenberg RL, Culhane JF, Iams JD, Romero R. Epidemiology and causes of preterm birth. Lancet 2008; 371: 75-84.
- 20. Morris JM, Roberts CL, Crowther CA, et al. Protocol for the immediate delivery versus expectant care of women with preterm prelabour rupture of the membranes close to term (PPROMT) Trial [ISRCTN44485060]. BMC Pregnancy Childbirth 2006; 6: 9.
- 21. Meher S, Abalos E, Carroli G. Bed rest with or without hospitalisation for hypertension during pregnancy. Cochrane Database Syst Rev 2005; (4): CD003514.
- 22. Say L, Gulmezoglu MA, Hofmeyr JG. Bed rest in hospital for suspected impaired fetal growth. Cochrane Database Syst Rev 2000; (2): CD000034.
- 23. Yost NP, Bloom SL, McIntyre DD, Leveno KJ. Hospitalization for women with arrested preterm labor: a randomized trial. Obstet Gynecol 2005; 106: 14-18.
- 24. Hohlagschwandtner M, Husslein P, Klebermass K, et al. Perinatal mortality and morbidity. Comparison between maternal transport, neonatal transport and inpatient antenatal treatment. Arch Gynecol Obstet 2001; 265: 113-118.
- 25. Fenton AC, Ainsworth SB, Sturgiss SN. Population-based outcomes after acute antenatal transfer. Paediatr Perinat Epidemiol 2002; 16: 278-285.
- 26. Gazmararian JA, Petersen R, Jamieson DJ, et al. Hospitalizations during pregnancy among managed care enrollees. Obstet Gynecol 2002; 100: 94-100.
Abstract
Objective: To assess the frequency and outcomes of preterm hospital admissions during pregnancy, with a focus on transfers to higher levels of care.
Design: Population-based cohort study using linked population data.
Setting and subjects: Women who were admitted to hospital in weeks 20–36 of pregnancy (preterm) and gave birth to a liveborn singleton infant in New South Wales during 2001–2008.
Main outcome measure: Numbers of preterm admissions of pregnant women who were discharged without giving birth, were transferred to higher care, or who gave birth.
Results: 110 439 pregnancies (16.0%) involved at least one preterm admission. After their initial preterm admission, 71.9% of women were discharged, 6.3% were transferred and 21.8% gave birth. Median gestational age at admission was 33 weeks and median time to discharge, transfer or giving birth was 1 day. Most women who were transferred or who gave birth had been admitted for preterm rupture of membranes or preterm labour. Of the women who were admitted or were transferred with suspected preterm labour, only 29% and 38%, respectively, gave birth. Compared with other admitted women, women having a first birth, public patients and those living in areas of low socioeconomic status were more likely to be transferred or to give birth. As gestational age increased, the proportion of women transferred decreased and the proportion giving birth increased. Infants born after maternal transfer had lower gestational age and more adverse outcomes than those born without maternal transfer.
Conclusions: Preterm hospital admission affects one in six women with singleton pregnancies. Methods that could improve assessment of labour status have a large potential to reduce the burden on maternity services. The increased morbidity for infants born after maternal transfer suggests women with high-risk pregnancies are being appropriately identified.