


Appropriate nutrition in early childhood is important for normal growth and may influence long-term health and chronic disease status.1 There is concern that while the energy intakes of young children are increasing, this may not be matched by the nutrient density of their diets.2 This has been interpreted by some to indicate a modern phenomenon of malnutrition in the developed world — an increasing prevalence of childhood obesity co-existing with key micronutrient deficiencies.
Dietary guidelines exist for the nutritional needs of young children, but there are limited data on the actual intakes of young children from representative population groups in Australia. Two surveys have been conducted in the past two decades — the 1995 National Nutrition Survey and the 2007 Australian National Children’s Nutrition and Physical Activities Survey.3,4 However, both surveys only included children from the age of 2 years, and while they assessed nutrient intakes, biomarkers of nutritional status were not measured. Knowledge of nutritional status is needed to understand the extent of malnutrition in affluent societies and to support evidence-based nutritional guidelines. This is particularly relevant for a number of key micronutrients that are essential for optimal growth and development, including iron, zinc and n-3 long-chain polyunsaturated fatty acids (LCPUFA). The aim of our study was to determine the nutrient intakes and biomarkers of nutritional status of preschool children in Adelaide using a unique sampling strategy to ensure that the study population was representative.
The study was a cross-sectional survey. We used Australian Bureau of Statistics (ABS) 2001 census data to identify areas of social advantage and disadvantage. There are 2132 census collection districts (CCDs) in Adelaide, and each CCD contains about 220 dwellings. An advantage–disadvantage index for each CCD was compiled by the ABS as an indicator of socioeconomic status (SES).5 We then divided the CCDs into three strata of SES: low, medium and high, based on the advantage–disadvantage index. To obtain a representative population sample, we used a stratified random sampling technique to select CCDs from each of the SES strata. To locate eligible children from each selected CCD, we used a doorknocking strategy designed to obtain information on groups that are representative of the population. 6,7 Children living in the randomly selected areas were eligible if they were aged 1–5 years (inclusive) and were born at full-term with a birth weight ≥ 2500 g. Children were excluded if they had been diagnosed with congenital or metabolic disorders that required specialised dietary intervention, had been hospitalised in the 6 months before the study, or were immunosuppressed. If more than one child was eligible per household, the child with the earliest birth date was selected to participate in the study. Participants were recruited between September 2005 and July 2007. Parents who consented to participate were asked to attend a clinic appointment with their child for assessment. The study was approved by the Human Research Ethics Committee at the Children, Youth and Women’s Health Service, Adelaide. Written informed consent was obtained from all participating families before they took part.
Anthropometric measurements including weight, length or height, and head circumference were recorded during the clinic appointment. Children were measured in light clothing, without shoes, using standardised procedures.8 Body mass index (BMI) was calculated as weight/height2 (kg/m2); z score and percentiles for weight, height and BMI were calculated using WHO ANTHRO software, version 3.1 (World Health Organization, Geneva, Switzerland, 2005). Children were classified as overweight if their BMI was between the 85th and 95th percentile, and obese if their BMI was above the 95th percentile.
Parents were asked to complete a 3-day weight record of their child’s food intake on three consecutive days, including one weekend day. Parents were supplied with a weighing scale and metric cups and spoons, and were asked to measure and record everything their child ate and drank during the 3-day study period. They were asked to include brand names for dietary supplements and commercial food products, and to provide food packaging from all commercial products. Completed food diaries were checked by a dietitian for errors, ambiguities or missing information. If needed, parents were contacted to clarify dietary information. We analysed the food record using FoodWorks Professional software, version 4 (Xyris Software, Brisbane, QLD, 2005) which included food composition tables from the Food Standards Australia and New Zealand AUSNUT (Australian Food and Nutrient) 1999 and NUTTAB95 (nutrient data table, 1995) databases. For the purpose of our analysis, commercial food products consumed by participants that were not in the Australian food composition tables were substituted with similar foods based on ingredients, or were manually added to the FoodWorks program when nutritional information was available for the product. A log of the foods substituted was kept to ensure consistency of data entry coding across the study. Adequacy of macronutrient and micronutrient intakes was evaluated against National Health and Medical Research Council nutrient reference values for Australia and New Zealand.9 To identify implausible intakes, the low acceptable ratio of reported energy intake (EI) to predicted basal metabolic rate (BMR) was estimated to be 1.04 using Goldberg cut-off with a physical activity level of 1.55.10
Trace-element-free equipment and techniques were used to collect a 2–5 mL non-fasting blood sample by venepuncture to assess children’s fatty acid, iron, zinc and vitamin B12 status. Before the blood sample was taken, parents were asked if their children had a cold or other infectious disease, or had received vaccinations in the past 2 weeks. If this was the case, the blood test was delayed for 2 weeks to minimise false elevation of serum ferritin and/or lowering of serum zinc due to infection or vaccination. Haemoglobin (Hb), serum ferritin and vitamin B12 levels were analysed by the Institute of Medical and Veterinary Science (IMVS) in Adelaide. Serum zinc levels were analysed by flame atomic absorption spectrophotometry.11 Red blood cell phospholipid levels were analysed by capillary gas chromatography.12 Phospholipids were analysed in preference to plasma fatty acids because they are less influenced by the immediate dietary fatty acids. Iron deficiency was defined as serum ferritin < 10 μg/L; iron deficiency anaemia was defined as serum ferritin < 10 μg/L and Hb < 105 g/L (for children aged up to and including 2 years) or Hb < 115 g/L (for children over 2 years); and suboptimal vitamin B12 status was defined as serum vitamin B12 < 145 pmol/L, based on IMVS reference ranges. Zinc deficiency was defined as a serum zinc < 9.9 μmol/L for non-fasting blood collected in the morning, or serum zinc < 8.7 μmol/L for non-fasting blood collected in the afternoon, according to the International Zinc Nutrition Consultative Group reference ranges.13
A total of 13 272 households from 54 CCDs were visited and 9464 households answered the door. Of the households answering the door, there were 573 eligible children, and 300 (52%) of these families consented to take part in the survey (Box 1).
The demographic characteristics of the participants are presented in Box 2. Ninety-five percent of the children were born in Australia and about half (49%) were first born. The median duration of breastfeeding was 34 weeks, and 20% of children were breastfed longer than 12 months. Ninety-two children (31%) were classified as overweight or obese. There were no significant differences in age- and sex-standardised weight or BMI z scores across the three categories of SES.
Intakes of macronutrients and key micronutrients are summarised in Box 3. The overall energy contributions from macronutrients were 50%, 17%, 33% and 16%, respectively, for carbohydrate, protein, fat and saturated fat. Overall, 95% of children > 2 years of age had a saturated fat intake that exceeded the maximum recommended limit of 10% of total energy,14 half of which came from milk and dairy products. Other sources of fat that contributed at least 5% of the saturated fat intake included 15% from cereals and cereal products (of which 5% was from grains and starches like rice, pasta, bread and breakfast cereal; 5% was from biscuits; and 5% was from sweet buns, cake and pastry products) and 7% from processed meats. Most children achieved the estimated average requirement9 for key micronutrients, including iron, zinc, calcium and vitamin C (Box 4). On the other hand, only 18% and 32% of children met the adequate intake9 for fibre and n-3 LCPUFA, respectively. There was a significant positive association between age and intake of macronutrients (P < 0.0001), vitamin C (P = 0.0008), iron (P = 0.0002) and zinc (P = 0.0005), while intake of calcium was negatively associated with age (P = 0.004). No significant associations between SES and intakes of the nutrients as reported in Box 3 were observed. There were no correlations between energy or macronutrient intakes and BMI z score. When we excluded results for the 12 children with implausible EIs (EI/BMR, < 1.04), the correlations did not change.
Micronutrient status is summarised in Box 5. Children older than 3 years had a lower rate of iron deficiency (4/134, 3%) compared with children under 3 years (11/138, 8%). No children over 3 years of age had iron deficiency anaemia. Iron intake was positively associated with ferritin concentration (r = 0.22; P < 0.001) but not with Hb concentration. Overall, 32% of children had zinc deficiency. There were no significant differences in the fatty acid profile across age groups or SES tertiles. Overall docosahexaenoic acid (DHA) concentration in erythrocyte phospholipids was 3.7% of total fatty acid and intake of DHA was modestly correlated with DHA concentration in erythrocyte phospholipids (r = 0.26; P < 0.001).
This study provides the first data linking biochemical status to nutrient intakes in a representative population of preschool children in Adelaide. These children had comparable sociodemographic characteristics to preschool children in the national survey.3,4 The results suggest that the children in our study have adequate intakes for a majority of micronutrients and a low prevalence of iron deficiency and iron deficiency anaemia. However, the low intakes of fibre and n-3 LCPUFA combined with the high intake of saturated fat raise concerns, as these dietary patterns are associated with adverse long-term health consequences in adults.15 These observations suggest that there is a need for increased attention on establishing healthy eating patterns in early childhood, as dietary patterns established early in life often carry through to adulthood.16
It is interesting to note that the median energy intakes of the children in our study were within the age-specific recommendations in Australia.10 In addition, the energy contributed by macronutrients is within the acceptable macronutrient distribution range.17 The lack of association between energy intake and BMI for age is consistent with the findings of another Australian study of preschool children,18 which showed that physical activity level, rather than percentage of energy from macronutrients, was associated with percentage body fat. These data suggest that in this age group physical activity may be a main determinant of weight and BMI status. It may also indicate that energy intake based on 3-day food diaries does not reflect long-term energy balance and may have limited predictability for weight and BMI status in young children. The median weight and height of children who participated in this study were similar to the same age group of children surveyed in the 2007 Australian National Children’s Nutrition and Physical Activities Survey.4 However, the median energy, macronutrient and key micronutrient intakes (including iron, zinc, calcium4 and n-3 LCPUFA19) of the children in our study were generally lower compared with the 2007 national survey, which assessed intake using 24-hour recall. Because of methodological differences in dietary assessment, it is not possible to directly compare our results with the national surveys, as 24-hour recall has been shown to overestimate energy intake of infants and toddlers compared with 3-day weighed-food records.20
The apparent discrepancy between the low rate of inadequate zinc intake and the higher prevalence of low serum zinc suggests that more research to better define the dietary zinc requirements and a normal range of serum zinc levels in young children based on functional outcomes is warranted.21,22 There are limited data regarding the vitamin B12 status of preschool children. Results from our study are comparable to the vitamin B12 status of 1–10-year-old children in Norway (median, 551 pmol/L).23 Interestingly, DHA concentration in erythrocyte phospholipids among the preschool children we studied was similar to levels found in our previous study24 of 16-week-old infants fed formula with no added n-3 LCPUFA (DHA was 3.5% of total fatty acids), but lower than breastfed infants (DHA was 5.6% of total fatty acids). Whether this suggests that the n-3 LCPUFA status of the children in this study may be suboptimal needs to be evaluated in a future study. However, there are no direct physiological or clinical data to indicate a need for supplementation during the preschool years. Interestingly, there is increasing recognition that the current recommendation for n-6 PUFA intake may be too high,25 and high intakes of n-6 PUFA may be responsible for the decline in n-3 LCPUFA status in Western countries.26 Further research to better define n-3 and n-6 PUFA requirements is warranted.
The response rate of 52% in our study is comparable to the national survey of toddlers in New Zealand,7 which had a similar study design. Although potential non-response bias cannot be excluded, the sociodemographic characteristics of participating families in our study were comparable to the Children’s National Nutrition Survey.4 Underreporting of food intake in overweight children27 may conceivably have confounded any association between energy intake and BMI. However, this is unlikely because the exclusion of children with implausibly low intakes did not change the outcome, and there were no differences in intakes of key nutrients or BMI for age across the three categories of SES.
1 Flowchart showing participants from low, medium and high SES
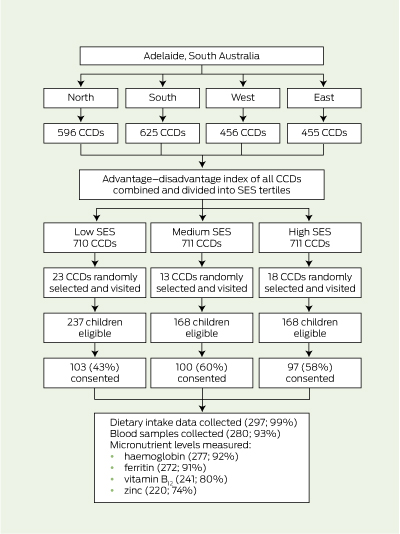
CCD = census collection district. SES = socioeconomic status.
2 Demographic characteristics of participants
IQR = interquartile range. BMI = body mass index. TAFE = college of technical and further education. |
|||||||||||||||
4 Number of participants with intake below the nutrient reference value (NRV) for selected nutrients, by age group
PUFA = polyunsaturated fatty acid. LC = long-chain. LA = linoleic acid. ALA = alpha linolenic acid. EAR = estimated average requirement. AI = adequate intake. * The NRV used for comparison is estimated average requirement. † The NRV used for comparison is the adequate intake. Nutrient reference values9 for children aged 1–3 years and 4–8 years, respectively — protein, EAR: 12 g/day, 16 g/day; n-6 PUFA (LA), AI: 5 g/day, 8 g/day; n-3 PUFA (ALA), AI: 0.5 g/day, 0.8 g/day; n-3 LCPUFA, AI: 40 mg/day, 55 mg/day; fibre, AI: 14 g/day, 18 g/day; vitamin C, EAR: 25 mg/day, 25 mg/day; iron, EAR: 4 mg/day, 4 mg/day; zinc, EAR: 2.5 mg/day, 3.0 mg/day; calcium, EAR: 360 mg/day, 520 mg/day. |
|||||||||||||||
Received 19 August 2011, accepted 22 January 2012
- Shao J Zhou1
- Robert A Gibson2
- Rosalind S Gibson3
- Maria Makrides1,4
- 1 Women’s and Children’s Health Research Institute, Adelaide, SA.
- 2 Foodplus Research Centre, University of Adelaide, Adelaide, SA.
- 3 Department of Human Nutrition, University of Otago, Dunedin, New Zealand.
- 4 School of Paediatrics and Reproductive Health
We thank Heather Garreffa, Helen Loudis and Karl Bailey for their clinical, administrative and technical support. Robert Gibson (ID: 519324) and Maria Makrides (ID: 565000) were supported by a National Health and Medical Research Council Senior Research Fellowship.
Robert Gibson has been serving on the scientific advisory boards for Nestle and Fonterra. Maria Makrides has been serving on the scientific advisory boards for Nestle, Fonterra and Nutricia. Associated honoraria for Maria Makrides and Robert Gibson are paid to their institutions to support conference travel and continuing education for postgraduate students and early career researchers. This project was funded by Wyeth Nutrition International. Data collection, analysis and interpretation were conducted independent of the funding body.
- 1. Field CJ. Early risk determinants and later health outcomes: implications for research prioritization and the food supply. Am J Clin Nutr 2009; 89: 1533S-1539S.
- 2. Picciano MF, Smiciklas-Wright H, Birch LL, et al. Nutritional guidance is needed during dietary transition in early childhood. Pediatrics 2000; 106: 109-114.
- 3. Australian Bureau of Statistics. National Nutrition Survey: nutrient intakes and physical measurements, Australia, 1995. Canberra: ABS, 1998. (ABS Cat. No. 4805.0.) http://www.ausstats.abs.gov.au/ausstats/subscriber.nsf/0/CA25687100069892CA2568890 0268A6D/$File/48050_1995.pdf (accessed Feb 2012).
- 4. Australian Government Department of Health and Ageing. 2007 Australian National Children’s Nutrition and Physical Activity Survey. Canberra: Commonwealth of Australia, 2008.
- 5. Australian Bureau of Statistics. Census of population and housing: socio-economic indexes for areas (SEIFA), Australia — data cube only, 2001. (ABS Cat. No. 2033.0.30.001.)
- 6. Karr M, Alperstein G, Causer J, et al. Iron status and anaemia in preschool children in Sydney. Aust N Z J Public Health 1996; 20: 618-622.
- 7. Soh P, Ferguson EL, McKenzie JE, et al. Dietary intakes of 6-24-month-old urban South Island New Zealand children in relation to biochemical iron status. Public Health Nutr 2002; 5: 339-346.
- 8. World Health Organization. Training course on child growth assessment [anthropometry training video]. Geneva: WHO, 2008. http://www.who.int/childgrowth/training/en (accessed May 2005).
- 9. National Health and Medical Research Council. Nutrient reference values for Australia and New Zealand including recommended dietary intakes. Canberra: NHMRC, 2006. http://www.nhmrc.gov.au/guidelines/publications/n35-n36-n37 (accessed Feb 2012).
- 10. Goldberg GR, Black AE, Jebb SA, et al. Critical evaluation of energy intake data using fundamental principles of energy physiology: 1. Derivation of cut-off limits to identify under-recording. Eur J Clin Nutr 1991; 45: 569-581.
- 11. Makrides M, Crowther CA, Gibson RA, et al. Efficacy and tolerability of low-dose iron supplements during pregnancy: a randomized controlled trial. Am J Clin Nutr 2003; 78: 145-153.
- 12. Smithers LG, Gibson RA, McPhee A, Makrides M. Effect of two doses of docosahexaenoic acid (DHA) in the diet of preterm infants on infant fatty acid status: results from the DINO trial. Prostaglandins Leukot Essent Fatty Acids 2008; 79: 141-146.
- 13. Brown KH, Rivera JA, Bhutta Z, et al. International Zinc Nutrition Consultative Group (IZiNCG) technical document #1. Assessment of the risk of zinc deficiency in populations and options for its control. Food Nutr Bull 2004; 25 Suppl 2: S99-S203.
- 14. National Health and Medical Research Council. Dietary guidelines for children and adolescents in Australia incorporating the infant feeding guidelines for health workers. Canberra: Commonwealth of Australia, 2003. http://www.nhmrc.gov.au/_files_nhmrc/publications/attachments/n34.pdf (accessed Feb 2012).
- 15. Burr ML, Fehily AM, Gilbert JF, et al. Effects of changes in fat, fish, and fibre intakes on death and myocardial reinfarction: diet and reinfarction trial (DART). Lancet 1989; 2: 757-761.
- 16. Brink PJ, Ferguson K, Sharma A. Childhood memories about food: the Successful Dieters Project. J Child Adolesc Psychiatr Nurs 1999; 12: 17-25.
- 17. National Research Council. Dietary reference intakes for energy, carbohydrate, fiber, fat, fatty acids, cholesterol, protein, and amino acids. Washington, DC: National Academies Press, 2005. http://www.nap.edu/catalog.php?record_id=10490 (accessed Feb 2012).
- 18. Atkin LM, Davies PS. Diet composition and body composition in preschool children. Am J Clin Nutr 2000; 72: 15-21.
- 19. Meyer BJ, Kolanu N. Australian children are not consuming enough long-chain omega-3 polyunsaturated fatty acids for optimal health. Nutrition 2011; 27: 1136-1140.
- 20. Fisher JO, Butte NF, Mendoza PM, et al. Overestimation of infant and toddler energy intake by 24-h recall compared with weighed food records. Am J Clin Nutr 2008; 88: 407-415.
- 21. Amirabdollahian F, Ash R. Physiologic zinc requirement estimated by IZiNCG appears to be too low. Food Nutr Bull 2009; 30: 273-274; author reply 274-275.
- 22. Hotz C. Dietary indicators for assessing the adequacy of population zinc intakes. Food Nutr Bull 2007; 28 (3 Suppl): S430-S453.
- 23. Hay G, Trygg K, Whitelaw A, et al. Folate and cobalamin status in relation to diet in healthy 2-y-old children. Am J Clin Nutr 2011; 93: 727-735.
- 24. Makrides M, Neumann MA, Simmer K, Gibson RA. Erythrocyte fatty acids of term infants fed either breast milk, standard formula, or formula supplemented with long-chain polyunsaturates. Lipids 1995; 30: 941-948.
- 25. Guesnet P, Lallemand SM, Alessandri JM, et al. α-Linolenate reduces the dietary requirement for linoleate in the growing rat. Prostaglandins Leukot Essent Fatty Acids 2011; 85: 353-360.
- 26. Blasbalg TL, Hibbeln JR, Ramsden CE, et al. Changes in consumption of omega-3 and omega-6 fatty acids in the United States during the 20th century. Am J Clin Nutr 2011; 93: 950-962.
- 27. Fisher JO, Johnson RK, Lindquist C, et al. Influence of body composition on the accuracy of reported energy intake in children. Obes Res 2000; 8: 597-603.
Abstract
Objective: To determine the nutrient intakes and status of preschool children from a representative population sample in Adelaide.
Design, setting and participants: Cross-sectional survey of children aged 1–5 years, using a stratified random sampling method and a doorknocking strategy, between September 2005 and July 2007.
Main outcome measures: Dietary intake, assessed using a 3-day weighed-food diary; anthropometrics, biomarkers of iron, zinc and vitamin B12, and fatty acid profiles assessed using standard methods.
Results: Median energy intakes were within dietary recommendations for the age group. Overall energy contributions from carbohydrate, protein, fat and saturated fat intakes were 50%, 17%, 33% and 16%, respectively. The rates of inadequate intake of iron, zinc, calcium and vitamin C were low, as was the prevalence of iron deficiency (5%). Only a minority of children achieved the adequate intake for n-3 long-chain polyunsaturated fatty acids (32%) and dietary fibre (18%). There was no association between socioeconomic status and intakes of macronutrients and key micronutrients. Fourteen per cent of children were obese (BMI, > 95th percentile); no association between BMI and energy intake was shown.
Conclusions: The dietary intake of children in the study was adequate for macronutrients and the majority of micronutrients. However, low intakes of fibre and n-3 long-chain polyunsaturated fatty acids and high saturated fat intakes have raised concerns that this dietary pattern may be associated with adverse long-term health effects.