


Stroke is a major non-communicable disease of increasing global importance, with an estimated 5.7 million deaths from stroke occurring each year, and many more survivors living with residual disability.1 Given the limited availability of effective acute treatment options, prevention is the most realistic approach to averting the growing burden of stroke worldwide. Although several modifiable risk factors for stroke have been well established, uncertainty persists regarding the influence of others. In particular, the strength and mechanisms of association of socioeconomic status (SES) are controversial, although data are accumulating2-4 from different parts of the world, including Australia and New Zealand.5-6 Stroke is a challenging disease to study in a population-wide context because of complexities in case ascertainment, diagnosis, measurement, and the inclusion of an adequately large sample to assess multiple exposures with modest effect. The aim of this study was to pool comparable population-based incidence studies to determine the influence of SES on both the incidence rates and case-fatality rates for stroke in Australia and New Zealand.
We used individual patient data from three population-based “ideal” stroke incidence studies7 conducted in Australia and New Zealand within a decade of each other. Comparable methods had been used across the studies, as described elsewhere.5,8-10 The included studies were the Perth Community Stroke Study (PCSS; two separate 12-month study periods beginning in 1995 and 2000);9 the Northeast Melbourne Stroke Incidence Study (NEMESIS; 36 months during 1996–1999);5,10 and the Auckland Regional Community Stroke (ARCOS) Study (12 months, 2002–2003).8
We used similar area-level measures of relative socioeconomic “deprivation” for the populations of Australia (Index of Relative Socio-Economic Disadvantage [IRSD]11) and New Zealand (New Zealand index of deprivation [NZDep]12). For the Australian studies, we matched postcodes of registered patients to the IRSD; and for the New Zealand study, we matched registered patients to the NZDep 2001 score by meshblock (an area unit of about 90 people). Corresponding quintiles of area deprivation were derived. We used the IRSD constructed from 1996 census data for the 1995 PCSS and NEMESIS, and the index constructed from 2001 census data for the 2000 PCSS.
Direct standardisation of rates to the World Health Organization “world” population13 was performed to allow comparisons across quintiles. Relative differences in stroke rates were calculated by (rateQ5 − rateQ1)/rateQ1, where Q = quintile. We used Poisson regression analysis to determine the statistical significance of differences in crude incidence between quintiles 1 and 5. For age-standardised incidence, we assessed statistical significance using the mid-P exact test.14 The population-attributable risk fraction was calculated from age-standardised rates, and exact mid-P 95% confidence intervals were derived.14
All analyses were conducted using Stata, version 11.1 (StataCorp, College Station, Tex, USA).
Age and deprivation were inversely related, with patients in the most deprived areas having strokes at an average age of 68 years, compared with 77 years in the least deprived areas (Box 1). Patients from the most deprived areas who had strokes were more likely to be of non-European ethnicity, blue collar workers or current smokers, and to have a history of hypertension and diabetes. Conversely, a U-shaped relationship was found for alcohol consumption, with higher proportions of current alcohol consumption among patients in both the least and most deprived quintiles, although this is likely to be confounded by age and socioeconomic factors. The effects of deprivation by sex were also examined. Although similar associations to the overall results were found for females, there were no significant differences between area-level deprivation and pre-stroke institutional care, history of hypertension and diabetes among males, after adjustment for age (data available on request).
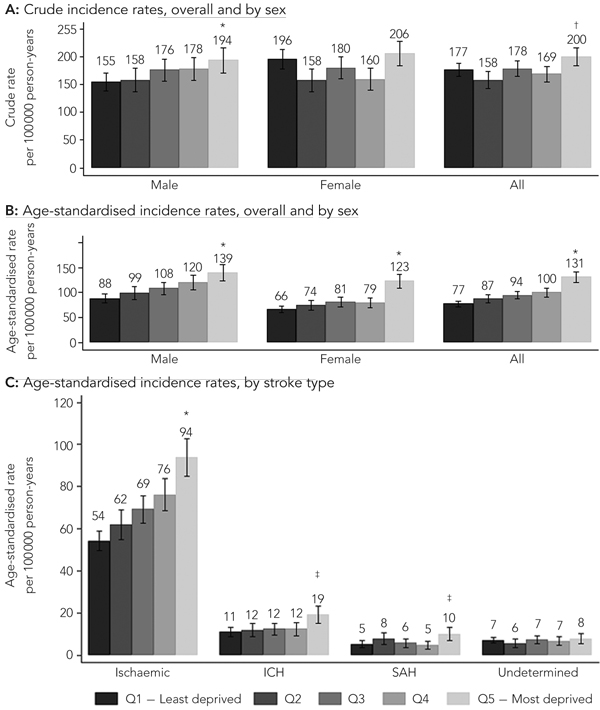
The crude annual stroke incidence rate was higher among patients from the most deprived areas (quintile 5; 200 per 100 000 person-years [95% CI, 184–216]) compared with those from the least deprived areas (quintile 1; 177 per 100 000 person-years [95% CI, 165–188]) (Box 2, A). Overall, the age-standardised incidence rate per 100 000 person-years was 70% higher (95% CI, 47%–95%; P < 0.001) among the most deprived group compared with the least deprived group (131 [95% CI, 120–141] v 77 [95% CI, 72–83], respectively) (Box 2, B). The linearity of this increase was more marked among males than females, but the absolute difference in age-standardised rates was greater among females (57) than males (51). The relative difference in age-standardised rates for the most deprived group compared with the least deprived was 58% in males (95% CI, 30%–93%; P < 0.001), and 87% (95% CI, 51%–130%; P < 0.001) in females. Interestingly, the age-adjusted incidence rate was higher among males than females in each category of deprivation; the difference was statistically significant in all deprivation categories except quintile 5.
Significant increases in age-standardised rates were observed between the lowest and highest deprivation quintiles for the major subtypes of stroke, but no pattern was observed for strokes of undetermined type (Box 2, C).
The proportion of stroke in the population attributable to living in the most deprived areas compared with the least deprived areas was 19% (95% CI, 12%–27%), after adjustment for age. Area-level deprivation was not found to be associated with 12-month case-fatality rate, except in the unadjusted model where there was an observed difference between the most and least deprived areas (Box 3). Age was associated with 12-month case-fatality rate (Box 3), while in the largest model (Model 5), pre-stroke institutional care, history of diabetes or atrial fibrillation, prior myocardial infarction, and pre-stroke smoking were all associated with an increased risk of death within 1 year (Box 4). Although social class, as an indicator of individual SES, was not associated with death, active employment status was associated with a reduced risk of death (Box 5). No significant variable interactions requiring inclusion were detected, and no collinearity was detected in the final model.
In this unique pooled analysis of three population-based stroke studies, we have shown disparities in the incidence rates of stroke between patients classified according to area-level relative deprivation, with people in the most disadvantaged areas having the highest rates of stroke. These data are supported by the observation that patients living in less disadvantaged areas tend to be older and healthier, with fewer risk factors such as hypertension, diabetes, and smoking. This is consistent with the 2001 National Health Survey finding among about 26 900 people from all states and territories in Australia that higher proportions of people living in the more deprived areas smoke or have hypertension.15 Similar trends were found in the 2006–07 New Zealand Health Survey.16 Our findings are also consistent with a study that showed a 10-fold difference in stroke mortality and disability-adjusted life-years lost between countries with the highest SES and those with the lowest SES.17
We did not find an association between area-level SES and 12-month case-fatality rates. Rather, the risk of death was found to be principally driven by age, premorbid functioning, and severity of illness. Although it has been highlighted that females may receive substandard levels of care compared with males,18,19 our finding of males being 27% more likely to die than females in the year after stroke does not provide strong support for this possibility. This finding of a poorer stroke survival in males is mirrored in publications from Asia, Europe, and North America.20-22
With regard to surrogate markers for individual SES, social class (professional versus white collar, blue collar, or other) was not found to have a significant impact on survival, but being actively employed before having a stroke was found to be protective. This may be an artefact reflecting the younger age of patients who work, but it may also be attributable to increased levels of social support or networks, whether real or perceived, in a working environment. Social network measures, especially of the number of different fields in which a person has social contacts, have been shown to be strongly associated with improved survival up to 15 years after incident stroke.23
Our study has several limitations. Firstly, the use of Australian postcodes, which may cover hundreds of households, is a crude measure of deprivation when compared with New Zealand meshblocks, which contain, on average, 90 people. The Australian and New Zealand data may therefore not be directly comparable, but they are aggregated up to quintiles, so any measurement error is likely to be minimised. Secondly, although the NZDep and IRSD indexes were developed using similar factors from New Zealand and Australian census data, and thus share comparable indices of disadvantage, variations in casemix and measurement error could still have been a source of bias that could have driven our results towards finding no relationship between case-fatality rate and SES. As our main SES index was area-level deprivation, the results are also subject to “ecological fallacy”, where associations at the area level may not necessarily hold true at the individual level. Nonetheless, the finding that employment status, a surrogate marker of individual SES, was also associated with outcome, provides support for the reliability of our data. Moreover, because of data limitations, we were unable to consider the impact of other variables, such as education, home or goods ownership, and early-life influences, which have all been shown previously to play a role in the occurrence of disease.24,25 Further, our sample size, although large, may still have been underpowered to detect any influence of area-level SES on case-fatality rate. Finally, without any matched control data or population-based data on potential confounding variables, our study only provides evidence that area-level SES influences the rates of stroke, and does not provide any explanations for the reasons for this disparity. Whether such disparity is due to differential risk-factor profiles, in terms of prevalence, severity or susceptibility to disease, or access to care and intensity of management, requires elaboration in future research.
3 Odds ratios (95% CI) for the association of area-level SES and demographics with case-fatality rates for stroke at 1 year
4 Odds ratios (95% CI) for the association of clinical characteristics, smoking and drinking with case-fatality rates for stroke at 1 year
Provenance: Not commissioned; externally peer reviewed.
Received 6 December 2010, accepted 10 May 2011
- Emma L Heeley1,2
- Jade W Wei1,2
- Kristie Carter3
- Md Shaheenul Islam4
- Amanda G Thrift5,6
- Graeme J Hankey7,8
- Alan Cass1,2
- Craig S Anderson1,2
- 1 The George Institute for Global Health, Sydney, NSW.
- 2 Sydney Medical School, University of Sydney and Royal Prince Alfred Hospital, Sydney, NSW.
- 3 Department of Public Health, University of Otago, Wellington, New Zealand.
- 4 Emergency Medicine, Sydney West Area Health Service, Sydney, NSW.
- 5 Department of Medicine, Monash University, Melbourne, VIC.
- 6 Stroke Epidemiology, Baker IDI Heart and Diabetes Institute, Melbourne, VIC.
- 7 Royal Perth Hospital, Perth, WA.
- 8 School of Medicine and Pharmacology, University of Western Australia, Perth, WA.
We are grateful for the contribution and inspiration of the late Professor Konrad Jamrozik to this work, and for advice from Professor Mark Woodward.
The Heart Foundation of Australia provided a research grant-in-aid to assist in the pooling and analysis of the data, but had no input into the design, performance, analysis or reporting of the study, and did not see the manuscript before final acceptance for publication. Craig Anderson and Alan Cass received salary support from The George Institute for Global Health and as a Senior Principal Research Fellow of the National Health and Medical Research Council (NHMRC). Jade Wei was supported by an Australian Postgraduate Award. Amanda Thrift was supported by a Senior Research Fellowship from the NHMRC.
None identified.
- 1. World Health Organization. The top ten causes of death. (Fact sheet no. 310; updated Oct 2008.) http://www.who.int/mediacentre/factsheets/fs310/en/index.html (accessed Oct 2010).
- 2. Cesaroni G, Agabiti N, Forastiere F, et al. Socioeconomic differences in stroke incidence and prognosis under a universal healthcare system. Stroke 2009; 40: 2812-2819.
- 3. Li C, Hedblad B, Rosvall M, et al. Stroke incidence, recurrence, and case-fatality in relation to socioeconomic position: a population-based study of middle-aged Swedish men and women. Stroke 2008; 39: 2191-2196.
- 4. Arrich J, Lalouschek W, Mullner M. Influence of socioeconomic status on mortality after stroke: retrospective cohort study. Stroke 2005; 36: 310-314.
- 5. Thrift AG, Dewey HM, Sturm JW, et al. Greater incidence of both fatal and nonfatal strokes in disadvantaged areas: the Northeast Melbourne Stroke Incidence Study. Stroke 2006; 37: 877-882.
- 6. Brown P, Guy M, Broad J. Individual socio-economic status, community socio-economic status and stroke in New Zealand: a case control study. Soc Sci Med 2005; 61: 1174-1188.
- 7. Sudlow CL, Warlow CP. Comparing stroke incidence worldwide: what makes studies comparable? Stroke 1996; 27: 550-558.
- 8. Anderson CS, Carter KN, Hackett ML, et al; on behalf of the Auckland Regional Community Stroke (ARCOS) Study Group. Trends in stroke incidence in Auckland, New Zealand, during 1981 to 2003. Stroke 2005; 36: 2087-2093.
- 9. Islam MS, Anderson CS, Hankey GJ, et al. Trends in incidence and outcome of stroke in Perth, Western Australia during 1989 to 2001: the Perth Community Stroke Study. Stroke 2008; 39: 776-782.
- 10. Thrift AG, Dewey HM, Macdonell RA, et al. Stroke incidence on the east coast of Australia: the North East Melbourne Stroke Incidence Study (NEMESIS). Stroke 2000; 31: 2087-2092.
- 11. Adhikari P. Socio-economic indexes for areas: introduction, use and future directions [research paper]. Canberra: Australian Bureau of Statistics, 2006. (ABS Cat. No. 1351.0.55.015.)
- 12. Salmond C, Crampton P. NZDep2001 index of deprivation user’s manual. Wellington: Department of Public Health, Wellington School of Medicine and Health Sciences, 2002. http://www.moh.govt.nz/moh.nsf/files/phi-users-manual/$file/phi-users-manual.pdf (accessed Jun 2010).
- 13. Ahmad O, Boschi-Pinto C, Lopez A, et al. Age standardization of rates: a new WHO standard. Geneva: World Health Organization, 2001.
- 14. Berry G, Armitage P. Mid-P confidence intervals: a brief review. The Statistician 1995; 44: 417-423.
- 15. Australian Bureau of Statistics. Health risk factors, Australia, 2001. Canberra: ABS, 2003. (ABS Cat. No. 4812.0.) http://www.abs.gov.au/Ausstats/abs@.nsf/2f762f95845417aeca25706 c00834efa/c43f50c58a9a0aedca2570eb008398 cc!OpenDocument (accessed Oct 2010).
- 16. New Zealand Ministry of Health. A portrait of health. Key results of the 2006/07 New Zealand Health Survey. Wellington: NZMoH, 2008.
- 17. Johnston SC, Mendis S, Mathers CD. Global variation in stroke burden and mortality: estimates from monitoring, surveillance, and modelling. Lancet Neurol 2009; 8: 345-354.
- 18. Di Carlo A, Lamassa M, Baldereschi M, et al. Sex differences in the clinical presentation, resource use, and 3-month outcome of acute stroke in Europe: data from a multicenter multinational hospital-based registry. Stroke 2003; 34: 1114-1119.
- 19. Reeves M, Bhatt A, Jajou P, et al. Sex differences in the use of intravenous rt-PA thrombolysis treatment for acute ischemic stroke: a meta-analysis. Stroke 2009; 40: 1743-1749.
- 20. Oh MS, Yu KH, Roh JK, et al. Gender differences in the mortality and outcome of stroke patients in Korea. Cerebrovasc Dis 2009; 28: 427-434.
- 21. Olsen TS, Dehlendorff C, Andersen KK. Sex-related time-dependent variations in post-stroke survival — evidence of a female stroke survival advantage. Neuroepidemiology 2007; 29: 218-225.
- 22. Ayala C, Croft JB, Greenlund KJ, et al. Sex differences in US mortality rates for stroke and stroke subtypes by race/ethnicity and age, 1995-1998. Stroke 2002; 33: 1197-1201.
- 23. Vogt TM, Mullooly JP, Ernst D, et al. Social networks as predictors of ischemic heart disease, cancer, stroke and hypertension: incidence, survival and mortality. J Clin Epidemiol 1992; 45: 659-666.
- 24. Galobardes B, Lynch JW, Davey Smith G. Childhood socioeconomic circumstances and cause-specific mortality in adulthood: systematic review and interpretation. Epidemiol Rev 2004; 26: 7-21.
- 25. Gillum RF, Mussolino ME. Education, poverty, and stroke incidence in whites and blacks: the NHANES I Epidemiologic Follow-up Study. J Clin Epidemiol 2003; 56: 188-195.
Abstract
Objective: To assess the influence of area-level socioeconomic status (SES) on incidence and case-fatality rates for stroke.
Design, setting and participants: Analysis of pooled data for 3077 patients with incident stroke from three population-based studies in Perth, Melbourne, and Auckland between 1995 and 2003.
Main outcome measures: Incidence and 12-month case-fatality rates for stroke.
Results: Annual age-standardised stroke incidence rates ranged from 77 per 100 000 person-years (95% CI, 72–83) in the least deprived areas to 131 per 100 000 person-years (95% CI, 120–141) in the most deprived areas (rate ratio, 1.70; 95% CI, 1.47–1.95; P < 0.001). The population attributable risk of stroke was 19% (95% CI, 12%–27%) for those living in the most deprived areas compared with the least deprived areas. Compared with people in the least deprived areas, those in the most deprived areas tended to be younger (mean age, 68 v 77 years; P < 0.001), had more comorbidities such as hypertension (58% v 51%; P < 0.001) and diabetes (22% v 12%; P < 0.001), and were more likely to smoke (23% v 8%; P < 0.001). After adjustment for age, area-level SES was not associated with 12-month case-fatality rate.
Conclusions: Our analysis provides evidence that people living in areas that are relatively more deprived in socioeconomic terms experience higher rates of stroke. This may be explained by a higher prevalence of risk factors among these populations, such as hypertension, diabetes and cigarette smoking. Effective preventive measures in the more deprived areas of the community could substantially reduce rates of stroke.