


We describe the use of surveillance and forecasting to predict and track influenza outbreaks. Although this work was instigated in response to the 2009 (H1N1) influenza outbreak, the methods apply to future outbreaks of other infectious diseases. There is extensive related research in this area using temporal, spatial, or space–time detection algorithms (eg, regression, smoothing, hidden Markov, and wavelet models), with successful performance reported for both sudden and gradual outbreaks.1-9 The objective of much of this modelling is to complement traditional public health monitoring with routine automated data analysis.1 Characteristics of outbreaks that have influenced detection include the magnitude of the signal, the shape of the signal, and the timing of the outbreak.2 An interesting observation is that, since 2000, prospective health surveillance has moved from weekly or monthly data, to daily and faster data rates.1 In general, for detecting changes in recent data behaviour, methods incorporating recent data history have advantages over those producing estimates from longer baselines.3
Emergency department data have frequently been used to identify disease patterns,10-15 including assessment of the timing and magnitude of daily influenza counts against laboratory confirmed influenza.10 We describe three approaches to predicting future epidemics based on emergency department data: surveillance monitoring of influenza presentations using adaptive cumulative sum (CUSUM) plan analysis to signal unusual activity; generating forecasts of expected numbers of presentations for influenza, based on historical data; and using internet search data as outbreak notification among a population. All three are considered applicable to health facilities that routinely collect and code patient arrival data.
A08.4 – Viral gastroenteritis
B34.9 – Viral infection
J10.8 – (Influenza old code)
J11.1 – (Influenza new code)
J11.1S – H1N1 influenza (Human swine influenza) suspected
J18.0 – Bronchopneumonia
J18.1 – Lobar pneumonia unspecified
J18.2 – Hypostatic pneumonia unspecified
J18.8 – Pneumonia, atypical
J18.9 – Pneumonia, unspecified
Z04.8 – Medical review
We used an adaptive CUSUM plan for monitoring non-homogeneous negative binomial counts of ED presentations and hospital admissions for influenza to flag unusual outbreaks.16 A transitional negative binomial regression model with a moving window of 730 days was used to construct a 1-day-ahead forecast for counts across the influenza seasons of 2005–2009. The regression model included factors such as day of the week, school and public holidays, harmonics to account for seasonal trends, and functions of lag counts to account for changes in infection rates.
We compared our data with Google’s flu trends website (http://www.google.org/flutrends), which uses aggregated Google search data to estimate influenza “activity” in a selection of countries. Data for Queensland are available for download from 2006 onwards. We also used data downloaded from Google’s Insights for Search website (http://www.google.com/insights/search), which allows comparison of search volume patterns. We used the search terms “swine flu” and “flu” to check the consistency of internet search results.
Other influenza tracking websites, such as those maintained by the United States Centres for Disease Control and Prevention (http://www.cdc.gov/flu/ and http://healthmap.org/swineflu/) do not provide raw search data for Queensland.
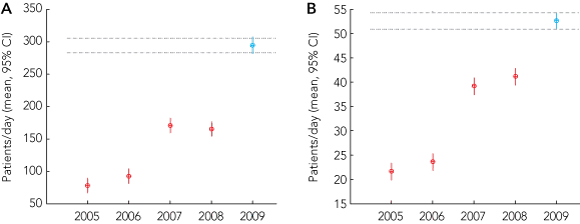
During the 2009 influenza season, there were 380 000 ED presentations to Queensland public hospitals, equating to 87 ED presentations to public hospitals for every 1000 people in Queensland. Of these presentations, 9% were patients with influenza-like symptoms (influenza-like cases). This represented a significant increase over previous years (P < 0.001) (Box 1, A). Across the 2009 winter influenza season, admission rates for patients with and without influenza-like diagnoses were 18% and 22%, respectively (Box 1, B).
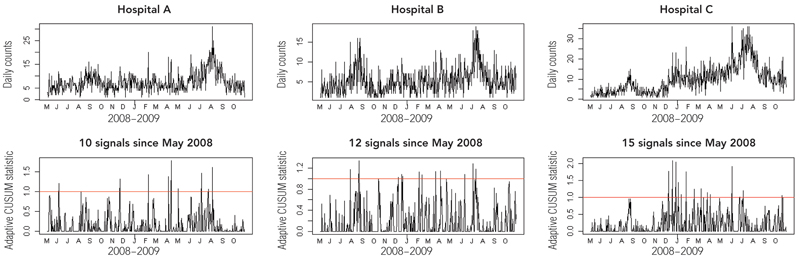
Examples of surveillance plans for three of the hospitals assessed in our study are shown in Box 2, with the letters (denoting months) on the x-axis showing the start of the month. These show a time–series plot of the counts being monitored (upper panel) and the associated CUSUM plan (lower panel). If the trend in the adaptive CUSUM breaks the red line (the control limit), then an unusual outbreak is signalled, and the CUSUM statistic is reset to zero. A break in the control limit occurring soon after this indicates that the outbreak continues to be significantly worse than expected, despite updating the model using the recent outbreak data.
For example, the CUSUM plan for Hospital C in Box 2 first signals an unusual outbreak in December 2008, but despite the models being updated with this outbreak data, the CUSUM continues to signal that the outbreak remains unusual early in 2009 prior to the commencement of the usual winter influenza season.
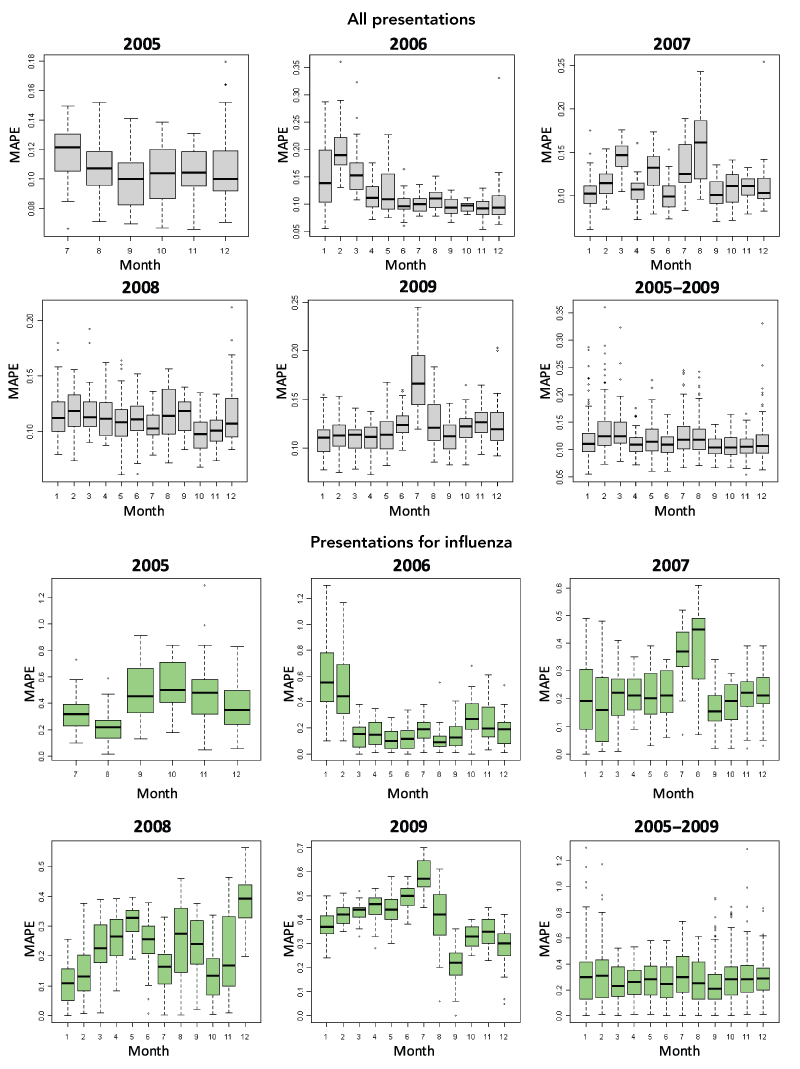
Comparing forecasts for ED presentations for influenza-like symptoms with actual presentations in 2009 shows that, at all sites, the historically based forecasts underestimated observed conditions. However, these forecasts represent a baseline for where we would normally expect things to be based on the preceding years. When validating the accuracy of the prediction algorithms across statewide data for the 2009 influenza season, it was found that forecasting accuracy was significantly worse for influenza presentations compared with all ED presentations in 2009, and that the accuracy in July 2009 was significantly worse than that for the surrounding months (Box 3).
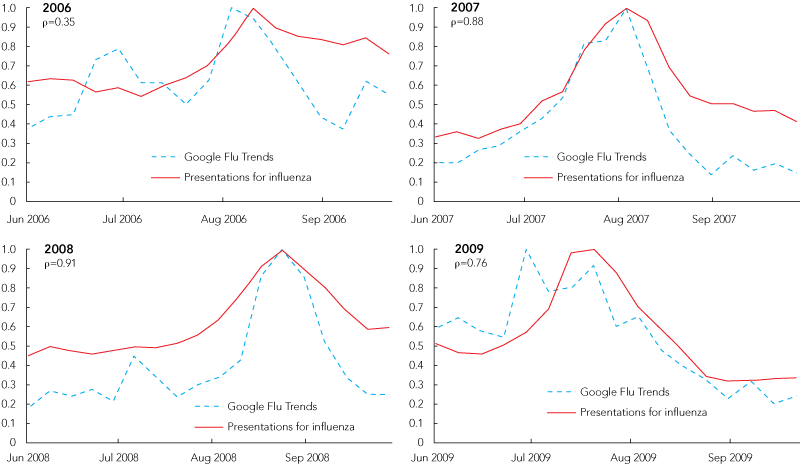
The coherence of Google Trends data with influenza presentation data is shown in Box 4. The correlation coefficients between Google search data for Queensland and statewide ED influenza presentations (ρ values) indicate an increase in correlation since 2006 when weekly influenza search data became available. While we might expect the peak in influenza ED presentations to lag behind the peak in internet searches related to influenza, the lag was more pronounced in 2009. This may indicate high public and media interest associated with an epidemic.
Many hospitals have seen the merit of generating forecasts from historical data to manage elective and emergency admissions in a proactive manner.17-22 The ability to accurately predict patient flow on a weekly or seasonal basis could enable more informed decisions about staffing levels to be made, which, in turn, could result in cost savings and improved patient care. Forecasting is a widely applicable, multidisciplinary science, encompassing statisticians, economists and operations researchers, that guides decision making in many areas of economic, industrial and scientific planning, but has gained little traction in the health care industry.22 We advocate that all health facilities that routinely collect data relating to workload and bed demand use this information proactively for improving management and patient outcomes. Our analysis shows, however, that routine forecasting methods need to be coupled with an adaptive methodology, such as the CUSUM approach described here, that can detect unusual occurrences.
The value of using internet search data in pandemic planning has been reported previously,23-25 with Google publishing correlations between search data and epidemics.23 Now these search data are accessible to the lay community and were used to construct the plots in Box 4. Additionally, Google’s Insights for Search site can report search interest relating to other infectious diseases to allow state health departments to survey trends for diseases other than influenza. According to Google, raw search volume is not reported, as the size of some regions may skew the data, and normalised data are used instead. The coherence of geographically specific search data with influenza presentations may enable information-poor regions to track the progression of pandemics in the community.
1 Presentations (A) and admissions (B) of patients with influenza-like symptoms to public hospitals in Queensland in the influenza seasons of 2005–2009; the 2009 influenza season differed significantly from those of preceding years
2 CUSUM plans for signalling unusual presentations and admissions for influenza at three Queensland hospitals
- Justin R Boyle1
- Ross S Sparks2
- Gerben B Keijzers3
- Julia L Crilly4
- James F Lind3
- Louise M Ryan2
- 1 CSIRO ICT Centre, Brisbane, QLD.
- 2 CSIRO Mathematics Informatics and Statistics, Sydney, NSW.
- 3 Gold Coast Hospital, Southport, QLD.
- 4 Southern Area Health Service ED Clinical Network, and Griffith University Research Centre for Clinical and Community Practice Innovation, Gold Coast Hospital, Southport, QLD.
We would like to acknowledge the support of the Queensland Emergency Medicine Research Foundation, Queensland Health’s data custodians, and staff from the Centre for Healthcare Improvement. We thank Mr Remy Le Padellec and Mr Derek Ireland for their contributions to this work. The CSIRO (Commonwealth Scientific and Industrial Research Organisation) holds a patent in the area of forecasting emergency department presentations.
None identified.
- 1. Burkom HS, Murphy SP, Shmueli G. Automated time series forecasting for biosurveillance. Stat Med 2007; 26: 4202-4218.
- 2. Buckeridge DL. Outbreak detection through automated surveillance: a review of the determinants of detection. J Biomed Inform 2007; 40: 370-379.
- 3. Elbert Y, Burkom HS. Development and evaluation of a data-adaptive alerting algorithm for univariate temporal biosurveillance data. Stat Med 2009; 28: 3226-3248.
- 4. Murphy SP, Burkom H. Recombinant temporal aberration detection algorithms for enhanced biosurveillance. J Am Med Inform Assoc 2008; 15: 77-86.
- 5. Berger M, Shiau R, Weintraub JM. Review of syndromic surveillance: implications for waterborne disease detection. J Epidemiol Community Health 2006; 60: 543-550.
- 6. Watkins RE, Eagleson S, Veenendaal B, et al. Disease surveillance using a hidden Markov model. BMC Med Inform Decis Mak 2009; 9: 39.
- 7. Watkins RE, Eagleson S, Veenendaal B, et al. Applying cusum-based methods for the detection of outbreaks of Ross River virus disease in Western Australia. BMC Med Inform Decis Mak 2008; 8: 37.
- 8. Fricker RD Jr, Hegler BL, Dunfee DA. Comparing syndromic surveillance detection methods: EARS versus a CUSUM-based methodology. Stat Med 2008; 27: 3407-3429.
- 9. Cakici B, Hebing K, Grunewald M, et al. CASE: a framework for computer supported outbreak detection. BMC Med Inform Decis Mak 2010; 10: 14.
- 10. Zheng W, Aitken R, Muscatello DJ, et al. Potential for early warning of viral influenza activity in the community by monitoring clinical diagnoses of influenza in hospital emergency departments. BMC Public Health 2007; 7: 250.
- 11. Schindeler SK, Muscatello DJ, Ferson MJ, et al. Evaluation of alternative respiratory syndromes for specific syndromic surveillance of influenza and respiratory syncytial virus: a time series analysis. BMC Infect Dis 2009; 9: 190.
- 12. Hope K, Durrheim DN, Muscatello D, et al. Identifying pneumonia outbreaks of public health importance: can emergency department data assist in earlier identification? Aust N Z J Public Health 2008; 32: 361-363.
- 13. Hope K, Merritt T, Durrheim DN. Evaluating the utility of emergency department syndromic surveillance for a regional public health service. Commun Dis Intell 2010; 34: 310-318.
- 14. Muscatello DJ, Churches T, Kaldor J, et al. An automated, broad-based, near real-time public health surveillance system using presentations to hospital emergency departments in New South Wales, Australia. BMC Public Health 2005; 5: 141.
- 15. Churches T, Conaty SJ, Gilmour RE, Muscatello D. Reflections on public health surveillance of pandemic (H1N1) 2009 influenza in NSW. NSW Public Health Bull 2010; 21(1-2): 19-25.
- 16. Sparks RS, Keighley T, Muscatello D. Early warning CUSUM plans for surveillance of negative binomial daily disease counts. J Appl Stat 2010; 37: 1911-1929.
- 17. Hoot N, Aronsky D. An early warning system for overcrowding in the emergency department, AMIA Annu Symp Proc 2006: 339-343.
- 18. Hoot NR, Zhou C, Jones I, et al. Measuring and forecasting emergency department crowding in real time. Ann Emerg Med 2007; 49: 747-755.
- 19. McCarthy ML, Zeger SL, Ding R, et al. The challenge of predicting demand for emergency department services. Acad Emerg Med 2008; 15: 337-346.
- 20. Schweigler LM, Desmond JS, McCarthy ML. Forecasting models of emergency department crowding. Acad Emerg Med 2009; 16: 301-308.
- 21. Champion R, Kinsman LD, Lee GA, et al. Forecasting emergency department presentations. Aust Health Rev 2007; 31: 83-90.
- 22. Jones SS, Thomas A, Evans RS, et al. Forecasting daily patient volumes in the emergency department. Acad Emerg Med 2008; 15: 159-170.
- 23. Ginsberg J, Mohebbi MH, Patel RS, et al. Detecting influenza epidemics using search engine query data. Nature 2009; 457: 1012-1014.
- 24. Eysenbach G. Infodemiology: tracking flu-related searches on the web for syndromic surveillance. AMIA Annu Symp Proc 2006: 244-248.
- 25. Wilson N, Mason K, Tobias M, et al. Interpreting Google flu trends data for pandemic H1N1 influenza: the New Zealand experience. Euro Surveill 2009; 14 (44). pii: 19386.
Abstract
Objective: To describe the use of surveillance and forecasting models to predict and track epidemics (and, potentially, pandemics) of influenza.
Methods: We collected 5 years of historical data (2005–2009) on emergency department presentations and hospital admissions for influenza-like illnesses (International Classification of Diseases [ICD-10-AM] coding) from the Emergency Department Information System (EDIS) database of 27 Queensland public hospitals. The historical data were used to generate prediction and surveillance models, which were assessed across the 2009 southern hemisphere influenza season (June–September) for their potential usefulness in informing response policy. Three models are described: (i) surveillance monitoring of influenza presentations using adaptive cumulative sum (CUSUM) plan analysis to signal unusual activity; (ii) generating forecasts of expected numbers of presentations for influenza, based on historical data; and (iii) using Google search data as outbreak notification among a population.
Results: All hospitals, apart from one, had more than the expected number of presentations for influenza starting in late 2008 and continuing into 2009. (i) The CUSUM plan signalled an unusual outbreak in December 2008, which continued in early 2009 before the winter influenza season commenced. (ii) Predictions based on historical data alone underestimated the actual influenza presentations, with 2009 differing significantly from previous years, but represent a baseline for normal ED influenza presentations. (iii) The correlation coefficients between internet search data for Queensland and statewide ED influenza presentations indicated an increase in correlation since 2006 when weekly influenza search data became available.
Conclusion: This analysis highlights the value of health departments performing surveillance monitoring to forewarn of disease outbreaks. The best system among the three assessed was a combination of routine forecasting methods coupled with an adaptive CUSUM method.