The common cold, mainly caused by rhinoviruses or coronaviruses,1,2 is a frequent problem all over the world. Although the symptoms are generally benign, viral colds result in significant costs to the economy due to lost workdays and school attendance.3 Convincing treatment options without side effects are not known.4 Traditionally, the local application of heat is used to treat the symptoms of the common cold — for example, ingesting hot fluids such as tea or chicken soup,5 or inhaling hot vapour.6 Moreover, few clinical trials have been conducted to evaluate such treatment options.6-8 It has been suggested that local hyperthermia of the nasal mucosa can affect rhinovirus replication.7-9 A Cochrane review of six trials — one from Israel, two from the United Kingdom, and three from the United States — found that only the studies from Israel and UK showed that steam was beneficial for relief of common cold symptoms.6 Results on symptom indices were equivocal; therefore, it was concluded that steam inhalation cannot be recommended for the routine treatment of common cold symptoms and further blind randomised controlled trials needed to be conducted.
We included patients between 18 and 60 years of age, with at least two out of 10 common cold symptoms — cough, headache, hoarseness, muscle ache, nasal drainage (nasal drip), nasal congestion, scratchy throat, sore throat, sneezing and fever (> 38.5°C) for 24 hours or less10 — and who were not planning to take medication for the cold. We excluded patients who had any of these cold symptoms for more than 24 hours, circulatory problems, severe chronic illness, or systolic blood pressure below 100 mmHg or above 160 mmHg, or who were pregnant.
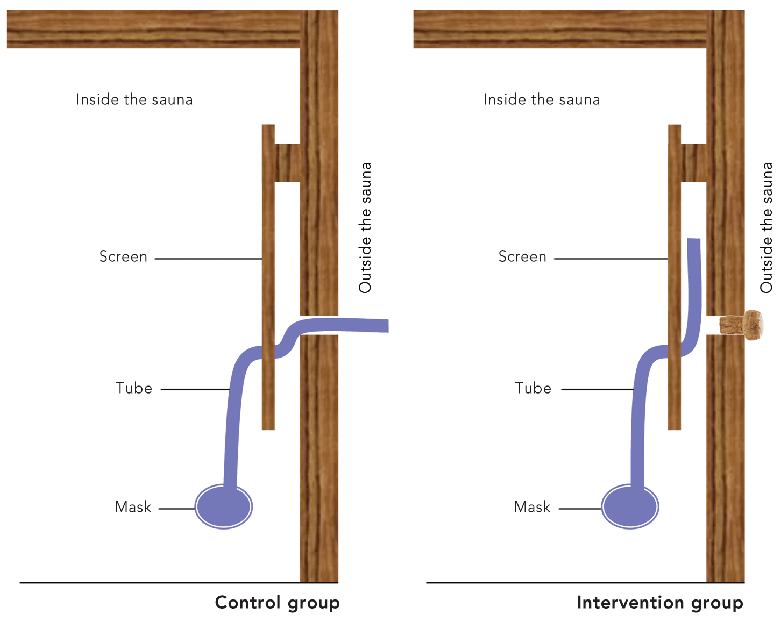
Participants in both groups sat in a sauna (dry air [20% humidity], 90°C) in Berlin (at the Institute for Social Medicine, Epidemiology and Health Economics, Charité University Medical Center) dressed in a winter coat (63% acrylic, 37% polyester, 1.5 cm thick), for about 3 minutes on 3 consecutive days. The short stay and the insulation provided by the winter coat should avoid circulatory imbalance and sweating. The intervention group sat in the hot sauna and inhaled the hot dry sauna air through the mouth via a mask. The control group sat in the hot sauna and inhaled dry air from outside the sauna (24°C) through the mouth via a mask (Box 1). Fitness of participants was assessed before every treatment in the sauna by measuring blood pressure and heart rate and by asking about fever symptoms.
The severity of each of the 10 symptoms used as inclusion criteria was rated by participants at baseline (on Day 1, before randomisation), after treatment episodes on Days 1, 2 and 3, and on Days 5 and 7, using a scale of 0 to 3 (0 = none, 1 = mild, 2 = moderate, 3 = severe). This scale has previously been used in a trial on the common cold.10 The primary outcome measure was the area under the curve (AUC) which summarised symptom severity over time (on Days 2, 3, 5 and 7), based on a sum score from the 10 symptoms that were rated.
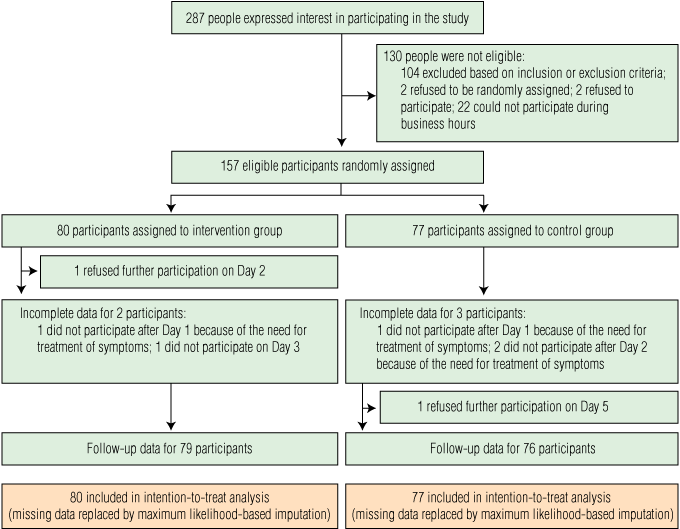
Of 287 people who expressed interest in the study, 157 were randomly assigned to the intervention or control arms of the study (intervention group: n = 80, control group: n = 77; Box 2). The mean age of these participants was 32.0 years (SD, 10.2 years; median, 28 years), and 93 participants (59.2%) were women. Mean age and body mass index differed significantly between groups (P = 0.03 and P = 0.003, respectively) but other baseline characteristics were comparable (Box 3).
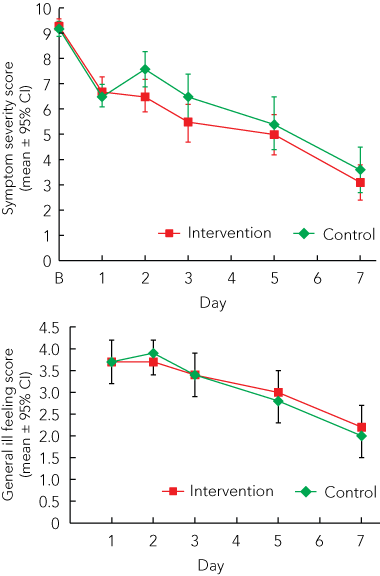
For the AUC for symptom severity (Days 2, 3, 5 and 7), no significant differences between the groups were observed (adjusted group difference, − 3.9 [95% CI, − 9.7 to 1.9]); P = 0.19; Cohen’s d, 0.13; Box 4, Box 5). Moreover, for the symptom severity score on Day 2, there was a significant difference between groups (adjusted group difference, − 1.0 [95% CI, − 2.0 to − 0.1]; P = 0.04; Box 4, Box 5). Additional adjustments for age and body mass index did not change the results.
The general ill feeling score was not significantly different between groups (P > 0.05 for all days observed; Box 5). During the course of the common cold, the proportion of participants who took medication for the cold only differed significantly between groups on Day 1 (ie, after the first treatment episode) (odds ratio, 0.2 [95% CI, 0.04 to 0.7]; Box 4).
A short stimulus of 3 minutes was used to avoid sweating and drying of the mucus in the throat. The duration of each sauna stay in our study may have been too short, and the sauna stays may not have been frequent enough to cause a substantial effect. Also, blinding for the air temperature was difficult. In addition, the outcome measures we used were based only on participants’ reports. We did not include any objective outcome measures, such as plasma cytokine levels10,11 or nasal airflow resistance.5
Participants in our study started with a severity score of about 9 and reached a score of about 3 on Day 7. This course of disease is comparable with results from placebo groups in studies used to evaluate the efficacy of zinc acetate.10,11 After enrolment in the study, the severity score lowered without the initial worsening of symptoms that one would expect within the first 48 hours of a common cold.12 Perhaps the peak of symptom severity had already been reached. However, initial worsening is often only observable in studies where participants suffer from an experimentally induced common cold.13 Taking this lack of initial worsening as an indication of longer disease duration (ie, greater than 24 hours at the start of the study), our intervention might have been too late to have had an impact on the course of the disease. However, the context effect14 or placebo effect15,16 may explain the initial improvement of symptoms. The placebo effect may also explain the significant group differences for the participants’ ratings of symptom severity on Day 2, medication intake on Day 1, and ratings of the effectiveness of the therapy on Day 7. As more participants in the control group guessed correctly that they were in the control group, the placebo effect might have been higher in the intervention group. Although we used dry air to heat the throat, instead of humidified air in the nose as done in most studies evaluated in the Cochrane review,6 we support the view that steam inhalation cannot yet be recommended for the routine treatment of common cold symptoms.
2 Recruitment, treatment and follow-up of patients with a newly acquired common cold, November 2007 – March 2008 and September 2008 – April 2009

- Daniel Pach1
- Bettina Knöchel1
- Rainer Lüdtke2
- Katja Wruck1
- Stefan N Willich1
- Claudia M Witt1
- 1 Institute for Social Medicine, Epidemiology and Health Economics, Charité University Medical Center, Berlin, Germany.
- 2 Karl und Veronica Carstens Foundation, Essen, Germany.
We thank Beatrice Eden and Iris Bartsch for their support with daily patient management, and Reinhard Wiesemann who developed the idea for this setting and provided the sauna cabin.
The study was funded by the Karl und Veronica Carstens Foundation.
- 1. Heikkinen T, Jarvinen A. The common cold. Lancet 2003; 361: 51-59.
- 2. Papadopoulos NG, Sanderson G, Hunter J, Johnston SL. Rhinoviruses replicate effectively at lower airway temperatures. J Med Virol 1999; 58: 100-104.
- 3. Roxas M, Jurenka J. Colds and influenza: a review of diagnosis and conventional, botanical, and nutritional considerations. Altern Med Rev 2007; 12: 25-48.
- 4. Arroll B. Non-antibiotic treatments for upper-respiratory tract infections (common cold). Respir Med 2005; 99: 1477-1484.
- 5. Saketkhoo K, Januszkiewicz A, Sackner MA. Effects of drinking hot water, cold water, and chicken soup on nasal mucus velocity and nasal airflow resistance. Chest 1978; 74: 408-410.
- 6. Singh M. Heated, humidified air for the common cold. Cochrane Database Syst Rev 2006; (3): CD001728.
- 7. Tyrrell D, Barrow I, Arthur J. Local hyperthermia benefits natural and experimental common colds. BMJ 1989; 298: 1280-1283.
- 8. Conti C, De MA, Mastromarino P, et al. Antiviral effect of hyperthermic treatment in rhinovirus infection. Antimicrob Agents Chemother 1999; 43: 822-829.
- 9. Lwoff A. Death and transfiguration of a problem. Bacteriol Rev 1969; 33: 390-403.
- 10. Prasad AS, Fitzgerald JT, Bao B, et al. Duration of symptoms and plasma cytokine levels in patients with the common cold treated with zinc acetate. A randomized, double-blind, placebo-controlled trial. Ann Intern Med 2000; 133: 245-252.
- 11. Prasad AS, Beck FW, Bao B, et al. Duration and severity of symptoms and levels of plasma interleukin-1 receptor antagonist, soluble tumor necrosis factor receptor, and adhesion molecules in patients with common cold treated with zinc acetate. J Infect Dis 2008; 197: 795-802.
- 12. Gwaltney JM Jr, Hendley JO, Simon G, Jordan WS Jr. Rhinovirus infections in an industrial population. II. Characteristics of illness and antibody response. JAMA 1967; 202: 494-500.
- 13. Gwaltney JM Jr, Hendley JO, Patrie JT. Symptom severity patterns in experimental common colds and their usefulness in timing onset of illness in natural colds. Clin Infect Dis 2003; 36: 714-723.
- 14. Di Blasi Z, Kleijnen J. Context effects. Powerful therapies or methodological bias? Eval Health Prof 2003; 26: 166-179.
- 15. Kaptchuk TJ. Powerful placebo: the dark side of the randomised controlled trial. Lancet 1998; 351: 1722-1725.
- 16. Brinkhaus B, Pach D, Lüdtke R, Willich SN. Who controls the placebo? Introducing a placebo quality checklist for pharmacological trials. Contemp Clin Trials 2008; 29: 149-156.


Abstract
Objective:
Design, setting and participants: A randomised single-blind controlled trial with a treatment duration of 3 days and a follow-up period of 4 days was conducted at a sauna in Berlin, Germany. Between November 2007 and March 2008 and between September 2008 and April 2009, 157 patients with symptoms of the common cold were randomly assigned to an intervention group (n = 80) and a control group (n = 77).
Interventions: Participants in the intervention group inhaled hot dry air within a hot sauna, dressed in a winter coat, whereas participants in the control group inhaled dry air at room temperature within a hot sauna, also dressed in a winter coat.
Main outcome measures: Area under the curve (AUC) summarising symptom severity over time (Days 2, 3, 5 and 7), symptom severity scores for individual days, intake of medication for the common cold and general ill feeling.
Results: No significant difference between groups was observed for AUC representing symptom severity over time (intervention group mean, 31.2 [SEM, 1.8]; control group mean, 35.1 [SEM, 2.3]; group difference, − 3.9 [95% CI, − 9.7 to 1.9]; P = 0.19). However, significant differences between groups were found for medication use on Day 1 (P = 0.01), symptom severity score on Day 2 (P = 0.04), and participants’ ratings of the effectiveness of the therapy on Day 7 (P = 0.03).
Conclusion: Inhaling hot air while in a sauna has no significant impact on overall symptom severity of the common cold.
Trial registration: ClinicalTrials.gov identifier NCT00552981.