


Astandard national inpatient medication chart (NIMC) for Australia was first mooted in 2003 by the then Australian Council for Safety and Quality in Healthcare (ACSQH),1 and arose from a national medication safety breakthrough collaborative,2 which had the support of the federal government.3 Adoption of an NIMC was confirmed by the Australian Health Ministers’ Advisory Council in 2004.4 The NIMC that was chosen originated as a standard state chart in Queensland,5 and the overall design of this chart was maintained in the translation to the NIMC. The NIMC is now in place in all states and territories, although variations exist. It was implemented at Royal Perth Hospital (RPH) by operational circular OP2080/066 on 26 June 2006 following dispatch of a letter from the Western Australia Director General of Health to all clinicians, in which the claimed virtues of the chart were set out.
An audit of the NIMC in Western Australia was coordinated by the Office of Safety and Quality in Health Care of the WA Department of Health,7 using criteria adapted from material provided by the ACSQH and the National Inpatient Medication Chart Working Group.8,9 The Drug Usage and Assessment Group (DUAG) conducted this audit on behalf of RPH, but because design problems were reported by an ad-hoc working party set up to examine the NIMC on behalf of the Drug Subcommittee, DUAG’s audit was extended to include an evaluation of aspects which were not part of the official audit. This approach made it necessary to compare the NIMC design with the displaced RPH chart (MR246); this comparison was extended include to charts from other WA and interstate hospitals and is the subject of this study.
The NIMC was assessed using three approaches.
Second, we performed a non-comparative audit of compliance with NIMC provisions by measuring the degree to which prescribers completed the individual fields in the NIMC, as required by the Office of Safety and Quality in Health Care, using the suggested audit criteria for each field.8 These criteria were similar to those of the pilot study.9 Only one criterion (prescription after documentation of an adverse drug reaction to a drug in the same class) was a patient-relevant outcome. Compliance was measured as the number of true responses for each criterion, expressed as a percentage of the relevant denominator. Two criteria (relating to use of the prohibited term “od” [once daily] and the use of trade names) were reciprocally related to improved compliance, and were excluded from the analysis. The remaining 28 audit criteria were essentially process measures whose relationship to medication safety is uncertain.
Third, we looked at changes in compliance after the introduction of the NIMC by comparing compliance with the MR246 and the NIMC before and 4 months after the NIMC was implemented for audit criteria that were applicable to both charts. To place the changes in context, the corresponding differences between the RPH NIMC audit and the aggregated pilot study results9 were used as a point of reference. For this purpose, the difference in average compliance between them (− 5.2%; 95% CI, − 14% to 6%) was deemed to represent interaudit variation of compliance with the NIMC. We arbitrarily defined changes greater than 30% (5 × 6% [upper 95% CI]) as “major”, 21% –30% as “moderate”, 11% – 20% as “minor” and lesser changes as “trivial”.
Box 1 compares selected design details of the NIMC with charts from other WA hospitals. Compared with the previous RPH chart, the NIMC had a smaller prescribing area and lacked capacity. Charts from other states were generally markedly different from the WA charts and from each other, often consisting of multifold page designs with a linear arrangement of prescribing data across the page or with self-copying pages for administrative purposes (details are available from the authors). Thus, there was marked heterogeneity in the design of prescription charts nationally before the NIMC was introduced.
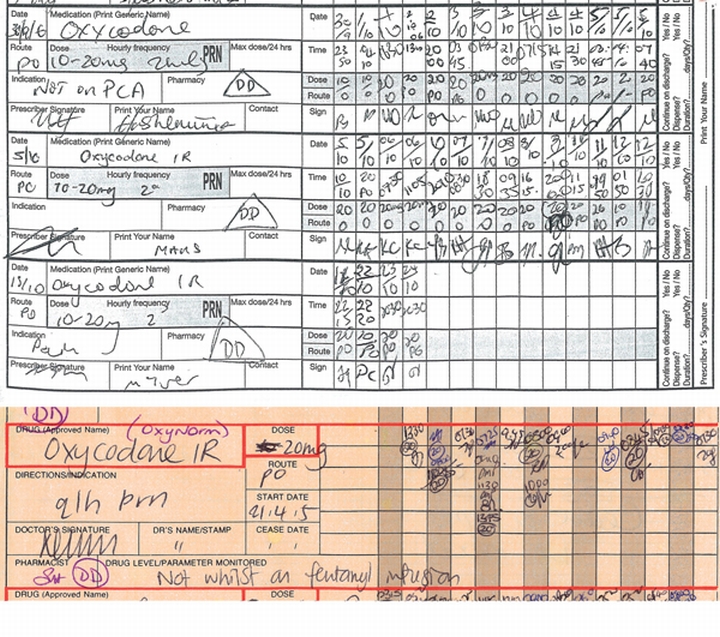
The NIMC introduced some new features that appeared positive (Box 2). However, four of the five innovations were unsuccessful or poorly complied with in practice. Five of seven advantages claimed by the WA Director General of Health were not realised (Box 3). In addition, the working party’s comments led to recognition of 10 design features that, according to DUAG, were prejudicial to medication safety (Box 4). An example, relating to the design of the PRN section, is shown in Box 5.
We found marked heterogeneity of chart design nationally that implementation of the NIMC has largely abolished. In addition, the NIMC introduced several novel features that might reasonably be expected to increase medication safety, although, in practice, several of these hopes were not realised (Box 2). We were also concerned about several aspects of the NIMC implementation and design, as follows:
The rationale for a standard chart was based largely on supposition. The Office of Safety and Quality in Health Care justification was: “Work conducted nationally has demonstrated that safety and efficiency of the prescribing process can be improved by changes to the medication chart”.10 The NIMC summary rationale stated: “Most of the benefit of having a National Medication Chart . . . comes from having a greater awareness that the prescribing process can result in direct patient harm. . .”.11 These statements were not referenced, and the former merely reflects the truism that medication charts should be well designed. No peer-reviewed study has reported that variation in prescription charts is an important cause of prescribing error, and the possibility was not mentioned in the Quality in Australian Health Care Study12 or detailed literature searches.13 How the new chart provides the greater awareness referred to above is unclear.
Differences between charts might have been beneficial insofar as they reflected the needs of individual institutions. For example, the displaced chart from King Edward Memorial Hospital provided for creams and lotions used in gynaecological and obstetric practice. A standard chart causes these benefits to be forfeited (Box 1).
The development of the NIMC did not rely on a systematic review of the currently available charts, but on translation of a chart previously in use in Queensland. We are uncertain of the reason for the ready adoption of the Queensland chart, other than a wish to avoid duplication of effort. We could find no web-based documents mentioning the possibility that hospitals with a satisfactory chart might be disadvantaged by the change to the NIMC.
The process-based Office of Safety and Quality in Health Care audit criteria8 measure only the extent to which the various chart fields are correctly completed. For example, 53% compliance was obtained in the NIMC requirement for the first prescriber to print the patient name under the identification label (a “key principle” of the ACSQH14). In this process, the name may simply be copied as a matter of course, and the requirement may be a waste of the prescriber’s time. Thus, reasonable compliance may give the appearance of benefit without real substantial change.
Some features that appeared to be positive initially were found by us to have adverse outcomes and need to be reconsidered. For example the change in respect of discharge drugs (Box 2) has increased patient waiting times at discharge from 55 to 95 minutes. This unexpected result arises because the circling method in the NIMC is not completed as was intended, and omits necessary information such as full details for Schedule 8 drugs. In addition, the NIMC contains several design elements that, in our opinion, detract from safe use of medicines (Box 4). These shortcomings were not and could not have been revealed by the “official” audit criteria. Staff using the NIMC were affected by its cramped design, low capacity, lack of colour, and poor provision for variable dosing. The increased need to rewrite charts is an imposition on prescribers and increases the risk of transcribing errors. The advance claims for the benefits of the NIMC (Box 3) made by the WA Director General of Health (which mirrored those made by the ACSQH11) were exaggerated.
Error theory from the aviation industry referred to as the SHEL model,15 which has been applied in health care,16,17 recognises that errors are caused by adverse interactions between system components including “environment”. In this case, environment is the background system of drug regulation and sociopolitical factors such as the contribution of management to policy implementation. The NIMC would not have been introduced without the involvement of the Australian Health Ministers’ Advisory Council and ACSQH, whose joint authority acted as a forcing mechanism for implementation with little further creative input. For example, there was no field testing in any WA teaching hospital. The official audit relied on surrogate markers of benefit, which tend to give the appearance but not the substance of quality. Finally, the mandated implementation prevented adequate discussion of the NIMC by drugs and therapeutics committees within individual hospitals. These problems highlight essential disadvantages of a “top-down” system of health administration in which solutions to problems are imposed rather than negotiated.
1 Comparison of design features of the national inpatient medication chart (NIMC) with the previous Royal Perth Hospital (RPH) chart (MR246) and charts from other Western Australian hospitals
PRN medication capacity | |||||||||||||||
2 Aspects of the national inpatient medication chart (NIMC) regarded as likely to improve medication safety, with problems in practice or other comment in parentheses
A new section for medication history (completed in only 2.3% of Royal Perth Hospital charts)
A means of recording the use of slow-release preparations (poorly complied with, possibly because of confusion about which drugs should be included)
Altered provision for discharge medications by circling inpatient drugs, intended to avoid transcription errors (increased waiting times at discharge and inadequate specification of Schedule 8 poisons)8
Provision for entering the indication for each drug (low compliance; 8.9%)
A direction to write the times of administration of each drug (high compliance; 98.5%)
3 Advantages claimed for the national inpatient medication chart by the Western Australian Director General of Health in his letter to clinicians dated 15 May 2006, and achievement of these aims in practice at Royal Perth Hospital
4 Description of 10 design features identified as likely to compromise medication safety by Royal Perth Hospital’s Drug Usage and Assessment Group
Limited to only one drug.* Suitable only for drugs whose dose is changed daily. |
|||||||||||||||
Absent. This limits a recognised “quality use of medicines” activity. |
|||||||||||||||
- J Alasdair Millar1
- Robyn C Silla2
- Glenda E Lee3
- Ann Berwick4
- Royal Perth Hospital, Perth, WA.
None identified.
- 1. Victorian Medicines Advisory Committee. National inpatient medication chart (NIMC) — rationale and background. http://www.health.vic.gov.au/vmac/nimc/rationale.htm (accessed Nov 2007).
- 2. Victorian Medicines Advisory Committee. Medication safety breakthrough collaborative. http://www.health.vic.gov.au/vmac/medicationsafety.htm (accessed Nov 2007).
- 3. Australian Government Department of Health and Ageing. Improving health by preventing medication error [media release]. 2003; 9 Sep. http://www.health.gov.au/internet/wcms/publishing.nsf/Content/health-mediarel-yr2003-kp-kp03188.htm (accessed Nov 2007).
- 4. Australian Government Department of Health and Ageing. Health ministers agree to reform agenda [joint communiqué]. 2004; 23 Apr. http://www.health.gov.au/internet/wcms/publishing.nsf/Content/health-mediarel-yr2004-jointcom-jc001.htm (accessed Nov 2007).
- 5. Youngman J, Coombes I, Stowasser D, Mitchell C. The implementation of a national inpatient medication chart in Australian public hospitals as a national initiative to address medication error [abstract]. Proceedings of the 23rd International Conference, International Society for Quality in Health Care; 2006 Oct 22-25; London. Melbourne: ISQua, 2006. http://www.isqua.org.au/isquaPages/Conferences/London/AbstractsSlides/MON23/AFTERNOON/6%20-%20212-ABS.pdf (accessed Nov 2007).
- 6. Western Australian Department of Health. Implementation of the national inpatient medication chart. 2006; 10 Jul. (Operational circular no. OP2080/06.) http://www.health.wa.gov.au/circulars/pdfs/12082.pdf (accessed Nov 2007).
- 7. Office of Safety and Quality in Health Care, Western Australian Department of Health. NIMC — audits and evaluation. http://www.safetyandquality.health.wa.gov.au/medication/nimc_audits.cfm (accessed Nov 2007).
- 8. Office of Safety and Quality in Health Care, Western Australian Department of Health. Audit tool. http://www.safetyandquality.health.wa.gov.au/docs/medication_safety/AuditTool_FormB.pdf (accessed Nov 2007).
- 9. Australian Council for Safety and Quality in Health Care. National inpatient chart pilot aggregate data report. http://www.health.gov.au/internet/safety/publishing.nsf/Content/80A0EF37F281A8D7CA25718 F000CCC2F/$File/chaggreg.pdf (accessed Nov 2007).
- 10. Office of Safety and Quality in Health Care, Western Australian Department of Health. NIMC — background. http://www.safetyandquality.health.wa.gov.au/medication/nimc_background.cfm (accessed Nov 2007).
- 11. South Australian Department of Health, Safety and Quality Unit, National Medication Chart Working Group. Summary rationale for a national medication chart. http://www.safetyandquality.sa.gov.au/DesktopModules/SSSA_Documents/LinkClick.aspx?tabid=58&mid=611&table=SSSA_Documents&field=ItemID&id=120&link=Summary+Rational +for+NIMC.pdf (accessed Nov 2007).
- 12. Wilson RM, Runciman WB, Gibberd RW, et al. The Quality in Australian Health Care Study. Med J Aust 1995; 163: 458-471.
- 13. Miller MR, Robinson KA, Lubomski LH, et al. Medication errors in paediatric care: a systematic review of epidemiology and an evaluation of evidence supporting reduction strategy recommendations. Qual Saf Health Care 2007; 16: 116-126.
- 14. Key achievements of the Australian Council for Safety and Quality in Health Care. Med J Aust 2006; 184 (10 Suppl): S37. <MJA full text>
- 15. Edwards E. Man and machine: systems for safety. Proceedings of the British Airline Pilots Association Technical Symposium; London, 1972. London: BAPA, 1972: 21-36.
- 16. Molloy GJ, O’Boyle CA. The SHEL model: a useful tool for analyzing and teaching the contribution of human factors to medical error. Acad Med 2005; 80: 152-155.
- 17. Eagle CJ, Davies JM, Reason J. Accident analysis of large-scale technological disasters applied to an anaesthetic catastrophe. Can J Anaesth 1992; 39: 118-122.
Abstract
Objective: To compare the national inpatient medication chart (NIMC) with the chart previously used at Royal Perth Hospital (RPH) in Western Australia, and with charts used at 13 other hospitals across Australia; and to audit NIMC performance in practice and to assess its design characteristics.
Design: Audit of patient prescribing documents extended to include a comparison with aggregated pilot study data and the previous RPH chart. Assessment of design features by inspection, based on their likely effect on medication safety.
Setting: A tertiary public hospital.
Main outcome measures: Compliance with the requirements of chart fields, measured as the percentage of correct entries according to predetermined criteria as required by the WA Office of Safety and Quality in Health Care.
Results: Average compliance was 56% (95% CI, 43%–67%). Differences in compliance after introduction of the NIMC were variable and only one was classified as “major”. The number of charts required per admission increased from 3.1 for the previous RPH chart to 6.3 for the NIMC, and chart replacement was required after 2.9 days for the NIMC compared with 5.5 days for the previous RPH chart. Of seven advantages of the NIMC claimed by the WA Director General of Health in a letter to doctors, five (71%) were not confirmed in practice. Ten notable design features of the NIMC with a potential adverse influence on medication safety were identified.
Conclusions: The NIMC contains adverse design features and is inferior to the medication chart previously in use at RPH. The purported advantages of introducing a national standard chart were not experienced at RPH.