


Australia has one of the highest prevalences of allergic disorders in the developed world. Recent decades have seen increases in the prevalences of allergic rhinitis, asthma and atopic eczema (although the proportion of people with asthma has plateaued in the past few years).1,2 Evidence that food allergy is becoming more common, however, is limited to changes in prevalence of peanut allergy in two separate studies of young children, which showed a doubling of clinical reactivity over 5 years.3,4
Patients were tested with glycerinated allergen extracts (HollisterStier, Spokane, Wash, USA) and histamine (10 mg/mL positive control; HollisterStier). Skin prick testing was performed on the volar aspect of the forearm using metal lancets (Stallergenes, Antony, France) according to standard guidelines.5 A positive skin prick test was defined as a weal with a diameter at least 3 mm greater than that produced by a negative control solution at 15 minutes.5
Food allergy was diagnosed in patients with a history of acute systemic allergic reactions after known food exposure, confirmed by a positive skin prick test to a relevant food. These were classified as: Class I (mild; urticaria/angioedema), II (moderate; dyspnoea, vomiting, abdominal pain) or III (severe; severe hypoxia, hypotension, vascular collapse).6 The Australasian Society of Clinical Immunology and Allergy (ASCIA) definition of anaphylaxis (“a rapidly evolving multisystem allergic reaction involving the presence of one of more symptoms or signs of hypotension or respiratory distress, and involvement of other organs such as the skin or gastrointestinal tract”)7 was used. Vomiting was not associated with hypoxia or hypotension in the children in this study, so patients were further classified into Classes IIa (vomiting and/or abdominal pain without dyspnoea) and IIb (dyspnoea as a prerequisite), as only Classes IIb and III meet the current ASCIA definition.7 Asthma, allergic rhinitis and atopic eczema were defined as has been previously described.1
Australian historical population statistics were obtained from the Australian Bureau of Statistics (ABS).8 Census data were available for 1996 and 2001; demographic data for other years were ABS estimates.
Australian national hospital morbidity database principal diagnosis cube data were obtained from the Australian Institute of Health and Welfare (AIHW) for the financial years 1993–94 to 2004–05.9 These record primary (and important secondary) discharge hospital diagnoses based on the ninth and 10th revisions of the International classification of diseases (ICD-9 and ICD-10) for each financial year (July–June), with ICD-9 used to June 1998, and ICD-10 thereafter. Admissions and deaths associated with FAA (ICD-9/ICD-10 codes, 995.6/T78), serum-related anaphylaxis (999.4/T80.5), anaphylaxis otherwise unclassified (995.0/T78.2), urticaria (708/L50), angioedema (995.1/T78.3), allergic rhinitis (477/J30.1–30.4), asthma (493/J45) and atopic eczema (691/L20) were examined. Anaphylaxis related to medication (ICD-10 code, T88.6) was excluded from the analysis, as data could not be clearly defined based on ICD-9 for 1993–94 to 1997–98. Sting anaphylaxis was excluded because it was not possible to distinguish anaphylaxis from other adverse reactions such as toxicity. To facilitate comparison between different age groups (and evaluate time trends), discharge diagnoses were expressed as age-standardised rates per million population (as previously described10,11), based on a combination of AIHW and ABS data. Calculations of age-standardised admission rates were based on ABS national population estimates for one calendar year,8 and the AIHW discharge rates ending in the same calendar year. Because most patients were ACT residents (which has a younger population than other states and territories), ACT population data8 and data from practice patients who resided in the ACT were combined to derive age-adjusted consultation rates. Data were grouped by patient age (0–4, 5–14, 15–29, and ≥ 30 years) after interim analysis.
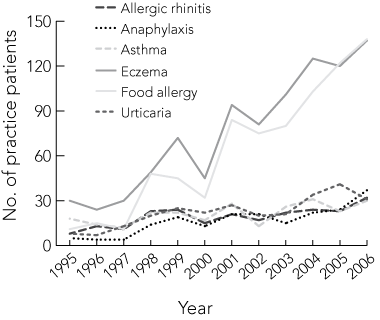
From 1995 to 2006, the number of children aged 0–5 years referred for assessment each year increased more than fourfold, from 55 to 240. Over that period, the number with food allergy increased from 11 to 138 and the number with FAA increased from five to 37 (Box 1). Consultations with new patients in the 0–5-years age group increased by 16.6 patients per annum (95% CI, 14.9–18.2), the number with food allergy increased by 10.4 per annum (95% CI, 9.4–11.3), and the number with FAA by 2.2 per annum (95% CI, 1.7–2.8). Increases in the number of 0–5-year-old patients with other atopic disorders were less prominent (Box 1). There was no significant change between 1995 and 2006 in the proportion of 0–5-year-old children diagnosed with allergic rhinitis (14.5% and 13.3%, respectively), urticaria (14.5% and 12.9%) or atopic eczema (54.5% and 57.0%). By contrast, the proportion of those with asthma dropped from 33.7% to 12.5% and of those with food allergy increased from 20.0% to 57.5%. Trends observed in patients resident within and outside the ACT were similar (data not shown).
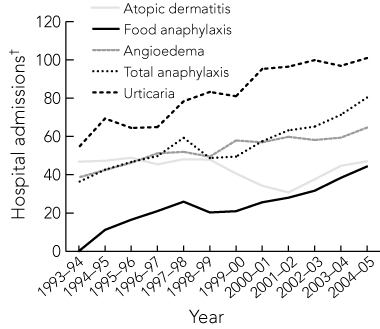
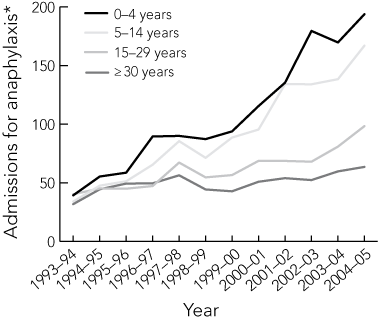
In the financial years 1993–94 to 2004–05, 43 893 admissions coded as representing possible systemic allergic reactions were recorded. These reactions were urticaria (18 788 admissions), angioedema (12 213) and anaphylaxis (12 892). Total admissions for these disorders increased from 2308 in 1993–94 to 5000 in 2004–05 (0.05% and 0.07% of all admissions, respectively). The cause of anaphylaxis was coded as serum (186; 1.4%), food (5469; 42.4%) or unclassified (7237; 56.1%). Seventy-nine per cent of admissions for anaphylaxis in children aged 0–4 years (1318/1665) were attributed to FAA. While the number of admissions for possible systemic allergic reactions increased in all age groups, the largest increases were for anaphylaxis, which increased from 36.2 to 80.3 admissions per million population (Box 2). When expressed as age-adjusted admission rates for FAA and total anaphylaxis, time trends were most pronounced in children aged 0–4 years (an increase from 39.3 to 193.8 per million population) compared with older patients (Box 3). Similar trends were observed for urticaria-related admissions (data not shown). Between 1997 and 2004, 68 anaphylaxis-related deaths were recorded (six food-related, 62 unclassified; six in patients aged 0–29 years). Comparable time trends were observed with age-adjusted consultation rates for food allergy and FAA in ACT residents (data not shown).
The dramatic increase in hospital admissions for anaphylaxis in Australia (around twice that described in United Kingdom studies10,11) is independent of both referral bias and location, and has been interpreted as evidence of a food allergy/FAA “epidemic” in some quarters.12 Admission rates, however, can be influenced by service availability, lowered threshold to seeking medical assistance (perhaps reflecting parental anxiety or perhaps even anaphylaxis management plans7), or changes in medical practice to lower the threshold for admission. Contrary evidence counters these interpretations, showing that emergency management plans reduce anxiety, the risk of relapse and need for medical intervention.13 Other studies have shown that only a small proportion of children presenting with food allergy/FAA are admitted to hospital,14 suggesting that patients with relatively minor symptoms are more likely to be coded as having urticaria (and discharged) than having anaphylaxis (and admitted). Even if hospital coding errors occurred, these are likely to have transferred patients between diagnostic categories for manifestations of allergy (eg, ana-phylaxis, acute urticaria/angioedema), and the number of patients in all these diagnostic categories increased. Nor are the data a statistical artefact — identical age-specific admission-rate time trends emerged using both ABS estimated population and census data. Overall, the data suggest that changes in admission rates reasonably reflect changing prevalence of FAA in infants.
Measuring demand for allergy-related medication is a less useful measure of changing prevalence. Hypoallergenic infant formula prescriptions increased fourfold in the 5 years ending 2004.15 Significant regional variation in prescribing rates could also reflect increased awareness, access to specialist services, or inappropriate prescribing. While sales of the EpiPen autoinjector (CSL Limited, Melbourne, Vic), which delivers adrenaline as first aid for severe allergic reactions, have increased substantially in recent years16 (and well before the introduction of Pharmaceutical Benefits Scheme subsidies in 2003), it is impossible to assess the relative distortions introduced by routinely providing two EpiPens to children, EpiPen-prescribing guidelines introducing asthma as a factor to be considered when evaluating those with food allergy (not necessarily anaphylaxis8), inappropriate prescribing and, possibly, medicolegal pressures.
Estimates of disease burden, prevalence and time trends for allergic disorders have been based (in part) on health service use in other studies.10,11,17 Unfortunately, it is difficult to quantify the effects of factors such as changes in health-seeking behaviour, driven (in part) by increased community awareness or by anxiety induced by recent media reports of fatal FAA,18 on apparent changes in the prevalence of allergy. The adoption of government policies on food allergy/FAA management in schools and childcare centres (adopted in South Australia in 1998 and the ACT and New South Wales in 2003) may not only reflect community concerns, but also drive demand for children to be assessed for food allergy before enrolment, which might partially explain the greater increase in consultations related to food allergy compared with FAA. Assuming that behavioural factors were the only explanation, however, would presuppose a large cohort of previously unassessed children with food allergies, many with anaphylaxis, and would not explain the similar trends observed in older age groups, both in terms of consultations and hospital admissions.
Rapid increases in disease prevalence over a decade are not unprecedented.2 Given the documented relationship between food allergy and infantile atopic eczema,19 it would be surprising if the prevalence of food allergy had not also increased in parallel with the almost doubling of the prevalence of atopic eczema documented between 1993 and 2002 in Australian children.2 Increases in food allergy/FAA-related consultations and admissions for infants (disproportionate to population size) would not be unexpected if food allergy is becoming even more prevalent in this “sentinel group” in which it is already most common. In the context of Australian and UK admissions data and increased incidence of food allergy in two well conducted population studies,3,4 it is difficult to escape the conclusion that, while anxiety has probably contributed to service demand, the underlying prevalence of food allergy has also increased in Australian infants over the past decade.
This study was not designed to explain the changing prevalence of food allergy. Hypotheses (for which there is limited published evidence) include greater exposure to potentially allergenic foods, sensitisation to topical allergens in emollients, increased use of antacid medication in infants, sensitisation through breast milk, prolonged breastfeeding, and increasing maternal age.20-23 If the data are confirmed to represent an actual increased prevalence of food allergy, long-term implications include: (i) a need for more resources for evaluating and re-evaluating patients; (ii) an eventual increase in the incidence of food allergy in older people in whom mortality is more common; and, possibly, (iii) a need to reassess the risk of fatal outcomes in young children if the underlying problem is more common.18
1 Time trends in allergy-related disorders in children aged 0–5 years referred to an Australian Capital Territory private practice
Received 8 December 2006, accepted 13 March 2007
- Raymond J Mullins1
- John James Medical Centre, Canberra, ACT.
Private practice data were presented in part at the Annual Scientific Meeting of the Australasian Society of Clinical Immunology and Allergy in Sydney, September 2006. Unpublished data on ACT birth rates were provided by Maureen Bourne (ACT Maternal and Perinatal Data Collection, Canberra Hospital, Canberra), and anaphylaxis mortality data by Robert van der Hoek (Australian Institute of Health and Welfare, Canberra). Louise Garone and Amanda Reese (CSL Limited, Melbourne) provided unpublished data on Australian EpiPen sales, and Bob Grant (Far Software Services, Sydney) helped with database analysis. Dr Bob Heddle (Flinders Medical Centre, Adelaide), Dr Pete Smith (Bond University, Gold Coast), Dr Carolyn Hawkins (Canberra Hospital, Canberra) and Professor Andrew Kemp (Westmead Children’s Hospital, Sydney) gave helpful comments on the data and manuscript before submission. Dates for implementation of anaphylaxis school policies were provided by Debra Kay (Manager, Interagency Health Care, Department of Education and Children’s Services, Adelaide), Robert Loblay (Royal Prince Alfred Hospital, Sydney) and Robert Franco (Injury Prevention and Management Section, Department of Education and Training, Canberra). Elmer Villanueva (Epidemiologist, National Breast Cancer Centre, Sydney) and Keith Dear (Biostatistician, National Centre for Epidemiology and Population Health, Australian National University, Canberra) provided extensive comments and input into the statistical and epidemiological analysis.
None identified
- 1. The International Study of Asthma and Allergies in Childhood (ISAAC) Steering Committee. Worldwide variation in prevalence of symptoms of asthma, allergic rhinoconjunctivitis, and atopic eczema: ISAAC. Lancet 1998; 351: 1225-1232.
- 2. Robertson CF, Roberts MF, Kappers JH. Asthma prevalence in Melbourne schoolchildren: have we reached the peak? Med J Aust 2004; 180: 273-276. <MJA full text>
- 3. Grundy J, Matthews S, Bateman B, et al. Rising prevalence of allergy to peanut in children: data from 2 sequential cohorts. J Allergy Clin Immunol 2002; 110: 784-789.
- 4. Sicherer SH, Munoz-Furlong A, Sampson HA. Prevalence of peanut and tree nut allergy in the United States determined by means of a random digit dial telephone survey: a 5-year follow-up study. J Allergy Clin Immunol 2003; 112: 1203-1207.
- 5. Bernstein IL, Storms WW. Practice parameters for allergy diagnostic testing. Ann Allergy Asthma Immunol 1995; 75: 543-625.
- 6. Brown SG. Clinical features and severity grading of anaphylaxis. J Allergy Clin Immunol 2004; 114: 371-376.
- 7. Baumgart K, Brown S, Gold M, et al; Australasian Society of Clinical Immunology and Allergy Anaphylaxis Working Party. ASCIA guidelines for prevention of food anaphylactic reactions in schools, preschools and child-care centres. J Paediatr Child Health 2004; 40: 669-671.
- 8. Australian Bureau of Statistics. Australian historical population statistics, 2006. Canberra: ABS, 2006. (ABS Cat. No. 3105.0.065.001.) http://www.abs.gov.au/AUSSTATS/abs@.nsf/DetailsPage/3105.0.65.0012006?OpenDocument (accessed May 2007).
- 9. Australian Institute of Health and Welfare. National hospital morbidity database principal diagnosis data cubes. Principal diagnosis cubes for 1993–94 to 1997–98 and 1998–99 to 2004–05. http://www.aihw.gov.au/hospitals/datacubes/datacube_06_pdx.cfm (accessed May 2007).
- 10. Gupta R, Sheikh A, Strachan DP, Anderson HR. Time trends in allergic disorders in the UK. Thorax 2007; 62: 91-96.
- 11. Gupta R, Sheikh A, Strachan D, Anderson HR. Increasing hospital admissions for systemic allergic disorders in England: analysis of national admissions data. BMJ 2003; 327: 1142-1143.
- 12. Warner JO. Anaphylaxis; the latest allergy epidemic. Pediatr Allergy Immunol 2007; 18: 1-2.
- 13. Ewan PW, Clark AT. Efficacy of a management plan based on severity assessment in longitudinal and case-controlled studies of 747 children with nut allergy: proposal for good practice. Clin Exp Allergy 2005; 35: 751-756.
- 14. Braganza SC, Acworth JP, Mckinnon DR, et al. Paediatric emergency department anaphylaxis: different patterns from adults. Arch Dis Child 2006; 91: 159-163.
- 15. Kemp A. Hypoallergenic formula prescribing practices in Australia. J Paediatr Child Health 2006; 42: 191-195.
- 16. Kemp AS. EpiPen epidemic: suggestions for rational prescribing in childhood food allergy. J Paediatr Child Health 2003; 39: 372-375.
- 17. Gupta R, Sheikh A, Strachan DP, Anderson HR. Burden of allergic disease in the UK: secondary analyses of national databases. Clin Exp Allergy 2004; 34: 520-526.
- 18. Kemp AS. Severe peanut allergy in Australian children [letter]. Med J Aust 2005; 183: 277. <MJA full text>
- 19. Sicherer SH, Sampson HA. Food hypersensitivity and atopic dermatitis: pathophysiology, epidemiology, diagnosis, and management. J Allergy Clin Immunol 1999; 104 (3 Pt 2): S114-S122.
- 20. Lack G, Fox D, Northstone K, Golding J; Avon Longitudinal Study of Parents and Children Study Team. Factors associated with the development of peanut allergy in childhood. N Engl J Med 2003; 348: 977-985.
- 21. Scholl I, Untersmayr E, Bakos N, et al. Antiulcer drugs promote oral sensitization and hypersensitivity to hazelnut allergens in BALB/c mice and humans. Am J Clin Nutr 2005; 81: 154-160.
- 22. Dioun AF, Harris SK, Hibberd PL. Is maternal age at delivery related to childhood food allergy? Pediatr Allergy Immunol 2003; 14: 307-311.
- 23. Pesonen M, Kallio MJ, Ranki A, Siimes MA. Prolonged exclusive breastfeeding is associated with increased atopic dermatitis: a prospective follow-up study of unselected healthy newborns from birth to age 20 years. Clin Exp Allergy 2006; 36: 1011-1018.
Abstract
Objective: To examine changing demand for specialist food allergy services for children aged 0–5 years over the 12 years from 1995 to 2006 as an index of changing prevalence.
Design, setting and participants: Retrospective analysis of the records of 1489 children aged 0–5 years referred to a community-based specialist allergy practice in the Australian Capital Territory (population, about 0.33 million).
Main outcome measures: Trends in demand for assessment for food allergy, dietary triggers and severity over 12 years, compared with Australian hospital morbidity data.
Results: 47% (697/1489) of 0–5 year-old children seen in private practice had food allergy (175 with food-associated anaphylaxis), most commonly to peanut, egg, cows milk and cashew. Over 12 years, the number of children in this age group evaluated each year increased more than fourfold, from 55 cases in 1995 to 240 in 2006. There was no change in the proportion diagnosed with allergic rhinitis in 1995 and 2006 (14.5% and 13.3%, respectively), urticaria (14.5% and 12.9%) or atopic eczema (54.5% and 57.0%). By contrast, the proportion with asthma dropped from 33.7% in 1995 to 12.5% in 2006 and the number with food allergy increased 12-fold, from 11 to 138 patients (and from 20.0% to 57.5% of children seen) The number with food anaphylaxis increased from five to 37 children (9.0% to 15.4%) over the same period. There were similar trends in age-adjusted Australian hospital admission rates for anaphylaxis in children aged 0–4 years, which increased from 39.3 to 193.8 per million population between the financial years 1993–94 and 2004–05, a substantially greater increase than for older age groups, or for the population as a whole (36.2 to 80.3 per million population).
Conclusions: There is an urgent need for coordinated systematic studies of the epidemiology of food allergy in Australia, to ascertain risk factors and guide public health policy. An increased prevalence of food allergy has implications for public health and medical workforce planning and availability of allergy services in Australia.