




Volume 180 - Issue 3
Making sense of trial results: outcomes and estimation
Authors: Rachel L O'Connell, Val J Gebski and Anthony C Keech
Med J Aust 2004; 180 (3): 128-130. || doi: 10.5694/j.1326-5377.2004.tb05836.x
Published online: 2 February 2004
Published online: 2 February 2004
The format in which the results of randomised controlled trials (RCTs) are presented can have a major impact on how they are interpreted, and the extent to which they will be adopted into clinical practice. A key element in the reporting of RCTs is the measurement scale on which outcomes are assessed. Scales which are presented as large whole numbers tend to attract the interest of clinicians and patients, independent of the reliability of the estimates.1,2 Enough information needs to be presented to allow clinicians to convert the size of the reported benefit into a format which allows easy comparison with other relevant trial results, including the range of certainty of the benefit (Box 1).3 As outcomes may be measured and collected in a variety of ways, it is essential that there is prior agreement on how any benefit or detriment of the intervention will be reported.
Measurement of outcome efficacy
Four critical measures of outcomes contribute to the interpretation of the benefits (or otherwise) of specific interventions:
Observed effect of the intervention, which should reflect both the magnitude and direction of the effect, and be indicated as differences (between means or medians, proportions), ratios of quantities measuring association (odds, risk, hazards) or ratios of quantities measuring effect (variances or correlations). Other specialised measures (such as the “location” effect) also occur in certain statistical analyses such as the Wilcoxon rank sum test.4
Precision of the estimate of effect is usually called the standard error (SE), and provides a measure of how accurately this estimate measures the true intervention effect. In general the SE is proportional to the sample size — the larger the sample size the smaller the SE. The calculated SE of the effect takes into account the inherent variability (as measured by the standard deviation, SD) in the measured outcome in each of the comparison groups.
Confidence interval for the true effect,5 which provides a range of feasible values within which the true effect may lie. The popularity of the 95% CI relates to the use of the 5% level of significance for testing whether the effect is likely to have occurred by chance alone. Confidence intervals are commonly two-sided, reflecting a two-sided hypothesis test (ie, compared with the control, the intervention can have either a benefit or detriment). A generic expression for a two-sided 95% CI is 95% CI = (effect – 1.96 × SE) to (effect + 1.96 × SE), where 1.96 is obtained from the standard normal distribution and relates to the 95% level chosen.
P value, a statistical measure of the “strength” of the observed effects. Small P values suggest strong evidence of a real effect, while large ones suggest weak evidence. The conventional “cut point”, 0.05, sometimes referred to as the level of significance, is that value below which it is commonly deemed there is sufficient evidence to declare that the effect of the intervention is truly beneficial or detrimental. Thus a P value of 0.05 reflects a likelihood of 5% that the observed effect might have occurred by chance alone. However, statistical significance does not necessarily imply clinically meaningful differences, making it critical that the magnitude of the effect be accompanied by confidence intervals.
Presentation of outcomes
Different formats for presenting results can make comparisons with other studies confusing (see Box 2). Whichever format is chosen, sufficient information must be provided to allow readers to convert from one format to another. The most popular format is to present results as relative risk reductions (Box 2, Trial B). When the four trials in Box 2 were presented to clinicians, more than 70% considered the active treatments in Trials B and D worth using in clinical practice, while less than 20% considered the treatments in Trials A and C worthwhile. In fact, the “trials” were the same study and treatment.6 Even though the reliability of the statements in Box 2 cannot be determined without either a confidence interval or a P value, confidence intervals are rarely requested.
Essential information to enable calculation of the results in all of these formats should be provided to readers. For studies of clinical events, this would include the numbers experiencing the event (numerators) in each group and the numbers at risk (denominators/group size) in each group (Box 3). From this, the proportion of participants in each group experiencing an event (risk) can be calculated, as well as the difference in proportions (absolute risk difference). A confidence interval around this difference and a P value can then be calculated. The relative risk reduction is then simply the risk difference divided by the risk in the control arm. The reciprocal of the absolute risk difference gives the number needed to treat (NNT),7 which is the expected number of patients who need to receive the intervention to see clinical benefit in one patient. A confidence interval for the NNT can be calculated by simply using the reciprocal of the confidence interval of the absolute risk difference.
Interpretation of results
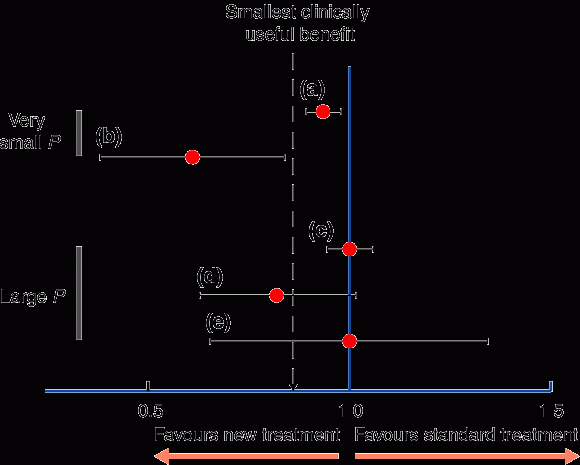
Graphical presentation of results can give a clearer indication of effect sizes and clinical and statistical significance than presenting the results in a table, particularly when reporting treatment effect on multiple outcomes or in subgroups.8 Box 4 shows various scenarios demonstrating effect size and direction, confidence intervals (reliability) and the strength of the evidence (P value). The smallest useful clinical benefit underpins the interpretation of the treatment effect, and this is usually determined by expert clinical discussion before the study is undertaken. Cost and known side effects, as well as comparison with alternative treatment options, need to be considered when determining smallest useful clinical benefit.
Box 4(a) shows a statistically significant benefit with a narrow confidence interval (confidence interval boundary does not cross the “no effect” [one] line) and a small P value. However, this effect is not large enough to achieve a clinically meaningful result and would not be considered important enough to change clinical practice, as the lower limit of plausible-effect magnitude falls above the smallest clinically useful benefit.
Box 4(b) shows an effect which is both clinically and statistically significant (small P value). The magnitude surpasses the limit for a clinically useful benefit and, even though the confidence interval is wide, the minimum plausible effect is just beyond (more extreme than) the smallest useful benefit.
Box 4(c) illustrates a null effect. This result is associated with a large P value and confidence intervals which cross the no-effect line. This is a reliably null result, with a zero-effect estimate, a narrow confidence interval and large P value.
Box 4(d) is statistically non-significant and shows an inconclusive clinical effect. The true effect may well be beneficial, but the wide confidence interval is consistent with a broad range of possible effect sizes, suggesting the sample size for the study may have been too small (study lacks statistical power).9
Box 4(e) also shows an inconclusive result — both clinically and statistically. The very wide confidence interval indicates that the estimate of effect is unreliable.
Discussion
Selecting the scale of measurement for the outcome is essential in study design, as this will be a critical factor in deciding the appropriate sample size.9 Some outcomes have a natural scale (eg, binary, ordinal), while others may lend themselves to reclassification. Thus, variables like blood pressure or cholesterol level may be easier to interpret when classified as high or low rather than being compared on their natural (continuous) measurement scale. The SE of the measured effect on outcome provides an estimate of the precision of the observed effect, while confidence intervals give a range of the plausible values in which the true effect may lie. Confidence intervals can also be used to aid in clinical decision making and to create clinical-significance curves and risk–benefit contours.5 Estimates of NNT provide a simple translation of the study results which can be directly applied to clinical practice. If these issues are considered, carefully planned and prospectively declared, the generalisability and validity of the final results will be enhanced.
A checklist for good reporting of results is given in Box 5.
1: CONSORT checklist of items to include when reporting a trial3
Selection and topic |
Item no. |
Descriptor |
|||||||||
Outcomes and estimation |
17 |
For each primary and secondary outcome, a summary of results for each group, and the estimated effect size and its precision (eg, 95% CI). |
|||||||||
2: Challenges in comparing trial results
Four treatments were tested against placebo in clinical trials for about 5 years. In no trial were there major side effects of the treatments. The results were reported as follows:
|
Trial A | 91.8% in the group allocated to the active treatment survived, compared with 88.5% in the placebo group. |
Trial B | Patients allocated to the active treatment had a 30% reduction in the risk of death. |
Trial C | Mortality was reduced by 3.4% in the group allocated to the active treatment. |
Trial D | One death was avoided for every 30 patients treated. |
On the basis of these reports, and assuming all treatment costs are modest, which treatments would seem reasonable to introduce into your clinical practice?
3: The calculation of different effect measures in a placebo-controlled trial
|
Treatment group (N = 1000) |
Control group (N = 1000) |
|||||||||
Number of events |
60 |
100 |
|||||||||
Group risk (proportion with event) |
60/1000 = 6% |
100/1000 = 10% |
|||||||||
Absolute risk difference |
10% - 6% = 4% |
||||||||||
Relative risk reduction |
4%/10% = 40% |
||||||||||
Relative risk/risk ratio (treatment v control) |
6%/10% = 0.6 |
||||||||||
95% CI for risk difference and P value |
1.6%–6.4% reduction, 2P < 0.001 |
||||||||||
Number needed to treat and 95% CI |
1/4% = 25; 1/0.064; 1/0.016 = 15.6–62.5 |
||||||||||
The “odds” of an event (and odds ratio) are commonly used instead of risk and risk ratio in reporting clinical trial results; odds are easily calculated as the number with an event divided by the number without an event. In this example, the odds of having an event are 6.4% for the treatment group and 11.1% for the control group, giving an odds ratio of 0.57 (95% CI, 0.41–0.80; 2P = 0.001). |
|||||||||||
5: Checklist: ideal reporting of trial results
Number of events expected in the control population, and the effect size assumed for the sample size calculation
Numbers of events observed and numbers at risk in each comparator group separately
The absolute risk reduction/difference for each event type
Relative risk or odds ratio for treatment effect
95% confidence interval for either absolute risk reduction or relative risk (or odds ratio)
2-sided P value for determining statistical significance of either absolute risk reduction or relative risk (or odds ratio)
Number needed to treat (NNT) and 95% CI and/or number needed to harm (NNH) and 95% CI
The minimum clinically worthwhile benefit of the intervention
Competing interests
None identified.
References
- Hux JE, Naylor CD. Communicating the benefits of chronic preventive therapy: does the format of efficacy data determine patients’ acceptance of treatment? Med Decision Making 1995; 15: 152-157. i1083022
- Naylor CD, Chen E, Strauss B. Measured enthusiasm: does the method of reporting trial results alter perceptions of therapeutic effectiveness? Ann Intern Med 1992; 117: 916-921. i1083024
- Moher D, Schulz KF, Altman DG, et al, for the CONSORT group. The revised CONSORT statement for reporting randomized trials: explanation and elaboration. Ann Intern Med 2001; 134: 663-694. i1083026
- Hollander M, Wolfe D. Nonparametric statistical methods. 2nd ed. New York: John Wiley, 1999. i1083028
- Shakespeare TP, Gebski VJ, Veness MJ, Simes J. Improving interpretation of clinical studies by use of confidence levels, clinical significance curves, and risk-benefit contours. Lancet 2001; 357: 1349-1353. i1083030
- Randomised trial of cholesterol lowering in 4444 patients with coronary heart disease: the Scandinavian Simvastatin Survival Study (4S). Lancet 1994; 344: 1383-1389. i1083032
- Cook RJ, Sackett DL. The number needed to treat: a clinically useful measure of treatment effect. BMJ 1995; 310: 452-454. i1083034
- Heart Protection Study Collaborative Group. MRC/BHF Heart Protection Study of cholesterol lowering with simvastatin in 5936 high-risk individuals with diabetes: randomised placebo-controlled trial. Lancet 2003; 361: 2005-2016. i1083036
- Kirby A, Gebski VJ, Keech AC. Determining the sample size in a clinical trial. Med J Aust 2002; 177: 256-257. <eMJA full text>
Interpreting Australian Stillbirth Rate Trends: Implications for Surveillance and Continuous Quality Improvement
Aleena M. Wojcieszek, Kirstine Sketcher-Baker, Christine Andrews, Michael Coory, Imogen Kettle, Melissa Malivoire, David Ellwood, Vicki Flenady
Paracetamol in Pregnancy: Uncertain Evidence, Certain Consequences
David J. Tunnicliffe, Miranda Cumpston, Debra Kennedy, Margie Danchin, Armando Teixeira-Pinto
Fatty Liver Disease in Australia: A Narrative Review on the Epidemiology, Natural History, Prognostication and Management in People With Metabolic Dysfunction
Karl Vaz, Daniel Clayton-Chubb, William W. Kemp, Stuart K. Roberts, Ammar Majeed
Birth prevalence, clinical sequelae, and management of congenital cytomegalovirus infections in Australia, 1999–2023: a national prospective study
Ece Egilmezer, Suzy M Teutsch, Carlos Nunez, Stuart T Hamilton, Adam W Bartlett, Pamela Palasanthiran, Elizabeth J Elliott, William D Rawlinson
The number of cancer‐related deaths that could be attributable to spatial disparities in survival in Australia, 2010–2019: a retrospective population‐based cohort study
Charlotte K Bainomugisa, Jessica Cameron, Paramita Dasgupta, Peter Baade
Mandatory research projects during medical specialist training in Australia and New Zealand
Paulina Stehlik, Caitlin Brandenburg, David A Henry