


The prevalence of obesity is rising in both developed and developing nations.1 Cited as an important risk factor for premature mortality,1 obesity has strong associations with all-cause mortality,2 cardiovascular disease,2-4 and diabetes,5,6 and is an important component of the insulin-resistance syndrome.7 In Australia in 1999–2000, 67% of men and 52% of women were overweight or obese.8
Body mass index, or BMI (weight in kilograms divided by the square of the height in metres), is promulgated by the World Health Organization as the most useful epidemiological measure of obesity.1 It is nevertheless a crude index that does not take into account the distribution of body fat, resulting in variability in different individuals and populations. Waist circumference has also been recommended as a simple and practical measure for identifying overweight and obese patients, and population-specific criteria have been tabulated.1
Here we propose that the waist–hip ratio is the preferred measure of obesity for predicting cardiovascular disease, with more universal application in individuals and population groups of different body builds. Benchmark studies of waist–hip ratio as a dominant cardiovascular risk factor were reported in Swedish men and women in 1984.9,10
The Australian Risk Factor Prevalence Study of 198911 provided an opportunity to compare the various measures of obesity in relation to subsequent mortality.
The National Heart Foundation of Australia conducted the third Risk Factor Prevalence Study from June to December 1989.11 This study involved residents aged 20–69 years who were registered on the federal electoral rolls of December 1988 in nine metropolitan centres across Australia: North Sydney, South Sydney, Melbourne, Brisbane, Adelaide, Perth, Hobart, Darwin and Canberra. A systematic probability sample of this population was selected by sex and 5-year age groups. The target was 1500 subjects in each catchment area. Subjects were invited to attend a local survey centre after an overnight fast. Of 15 164 people selected from the electoral rolls, 2694 were no longer living at the given address. Of the remaining 12 470 potential respondents, 9309 attended the surveys, giving a response rate of 74.7% (ranging from 60.7% in South Sydney to 88.7% in Darwin). This sample was predominantly of European descent, as reflected by place of birth: Australia 73%, United Kingdom and Europe 20%, Asia and Africa 5%. Complete data on 9206 subjects were analysed.
Participants completed self-administered questionnaires and their fasting status (> 12 hours) was confirmed. Respondents were classified as current smokers (cigarette smokers, cigar and/or pipe smokers), ex-smokers, or never-smokers. Self-reported coronary heart disease was coded if subjects gave a positive response for a past history of angina or heart attack. Self-reported diabetes was also recorded.
Physical measurements, with the participants in socks, stockings or bare feet, and in light street clothing, included height measured to the nearest centimetre, and weight to the nearest 10th of a kilogram (1 kg was deducted from the weights recorded as an allowance for clothing).
Waist circumference was measured around the narrowest point between ribs and hips when viewed from the front after exhaling. Hip circumference was measured at the point where the buttocks extended the maximum, when viewed from the side.11,12 Two consecutive recordings were made for each site to the nearest 1 cm using a metal tape on a horizontal plane without compression of skin. The mean of two sets of values was used. Blood pressure levels were obtained using mercury sphygmomanometers on the right arm of seated subjects. Systolic and phase 5 diastolic pressures were taken twice to the nearest 2 mmHg and the average recorded.
Fasting blood samples collected into EDTA tubes and separated within 3 hours were maintained at 4°C until despatched each week to the central laboratory at the Division of Clinical Chemistry, Institute of Medical and Veterinary Science, Adelaide (the WHO Collaborating Centre for blood lipids in the Asia–Pacific region). Plasma cholesterol and triglyceride levels were determined by colorimetric methods, and high-density lipoprotein (HDL) cholesterol level assayed in the supranatant after polyethylene glycol precipitation.11 Levels of low-density lipoprotein (LDL) cholesterol were calculated by the Friedewald formula if the total triglyceride level was < 4.5 mmol/L.11
Mortality rate was ascertained to 31 December 2000 using the National Death Index maintained by the Australian Institute of Health and Welfare (AIHW). The demographic data of the subjects in the 1989 survey were submitted to AIHW. These data were matched with the National Death Index using a probabilistic record linking package (“Automatch”). Multiple passes grouping date of birth, sex, full names, date of death, together with place of the survey and place of death, were included in a weighted algorithm to identify definite matches between survey subjects and those deceased.
Causes of death were coded according to the 9th (ICD-9) or 10th (ICD-10) revisions of the International classification of diseases.13,14 ICD-9 codes 3900 to 4589 or ICD-10 codes I 00.0 to I 99.9 were used for cardiovascular disease (CVD) deaths, and ICD-9 codes 4100 to 4499 or ICD-10 codes I 20.0 to I 25.9 were used for coronary heart disease (CHD) deaths.
Baseline measures and risk factors were included in Cox proportional hazards regression analysis for survival time from survey to day of death or to 31 December 2000. Survival time for an individual was censored if the individual died and the cause of death was other than CVD or CHD. Because the death rates and the risk factors showed strong associations with age, the candidate variables were age-standardised using age and the square of age to account for linear and non-linear relationships. We estimated hazard ratios with 95% confidence intervals for the associations between potential risk factors and CVD deaths and CHD deaths. The hazard ratios indicated the incremental risk of 1 SD above the mean for any continuous risk factor. For categorical risk factors, hazard ratios were calculated for the presence of the risk factor. Age-standardised univariate associations between candidate risk factors and CVD and CHD deaths were estimated. Finally, all of the risk factors were included in a multivariate Cox regression analysis using a forward stepwise variable selection procedure to determine significant independent associations with CVD deaths and CHD deaths.
Box 1 shows the baseline characteristics of the cohort, some details of which have been published previously.11,12 By 31 December 2000, 298 deaths (6.6%) from all causes had occurred among the 4508 men, including 96 CVD deaths (2.1%) and 69 CHD deaths (1.5%). Among the 4698 women, there were 175 deaths (3.7%) from all causes, including 41 CVD deaths (0.9%) and 22 CHD deaths (0.5%). In 1989, the mean age of the entire cohort was 43 years (range, 20–70), compared with a mean age of 61 years (range, 28–70) among those who later died of CVD or CHD.
All three measures of obesity correlated strongly with cardiovascular risk factors (Box 2). In particular, there were strong positive correlations between the obesity measures and serum triglyceride level, and strong negative correlations with serum HDL cholesterol level. BMI and waist circumference showed stronger correlations with systolic and diastolic blood pressure than waist–hip ratio.
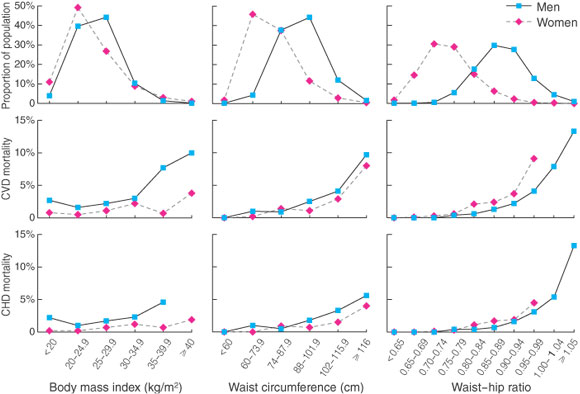
The unadjusted raw data, including the distributions of BMI, waist circumference, and waist–hip ratio in class intervals, with the corresponding 11-year CVD and CHD mortality rates, are shown in Box 3. BMI had very similar distributions in men and women, but the CVD and CHD mortality rates showed male-to-female preponderance, with increased mortality rates in men having a BMI > 30 kg/m2, and in women having a BMI > 25 kg/m2. In contrast, the measures of central obesity showed divergent distributions for men and women, but the sex gradient for mortality was abolished. For a given waist–hip ratio, the CHD death rates in men and women were similar. Increasing death rates appeared to occur with waist circumferences of 88–102 cm or more, or when the waist–hip ratio was > 0.80 in women or > 0.90 in men.
Box 4 shows the univariate and multivariate associations between candidate risk factors and CVD deaths. In the univariate analysis of measures of obesity, waist–hip ratio was a more powerful predictor than waist circumference, which, in turn, was a more powerful predictor than BMI in both men and women. Of the cardiovascular risk factors, a history of CHD and systolic and diastolic blood pressure showed significant associations with CVD deaths in both sexes.
Multivariate analysis showed that waist–hip ratio was a strong and independent predictor of CVD death in men and women, and a history of CHD (angina/myocardial infarction) is a highly significant independent risk factor. Current smoking was also an independent risk factor in women.
CHD deaths were included because they provide a more specific diagnostic category for risk factor evaluation, even though the number of CHD deaths is quite small. The univariate and multivariate associations between risk factors and CHD mortality shown in Box 5 are very similar to those of the CVD mortality results. Waist–hip ratio and baseline CHD are consistent, powerful and independent predictors of CHD death on multivariate analysis in both sexes.
Box 6 shows the age-standardised hazard ratios derived from the univariate analysis for CVD deaths and CHD deaths. Waist–hip ratio had much stronger predictive power and greater statistical significance than waist circumference, which, in turn, was superior to BMI for assessing risk in this population. Box 7 shows that the univariate hazard ratios for the conventional risk factors were substantially attenuated compared with those for waist–hip ratio.
Our Australian data provide the first systematic comparison of several measures of obesity, in parallel with conventional risk factors, in a longitudinal study of men and women from a representative population sample. Measurement of waist–hip ratio using a carefully standardised technique proved far superior to the other indices of obesity in determining the future risk of death from CVD or CHD. The multivariate analyses confirm that waist–hip ratios are independent of other risk factors, including self-reported coronary heart disease. In our study, the low prevalence of self-reported diabetes (2.7% in men and 2.4% in women) did not contribute to significant mortality risk.
Waist measurement alone may be relevant when assessing severely obese subjects whose hip measurements are difficult and unreliable. However, waist–hip ratio may be a better predictor of cardiovascular risk than waist circumference, as it is less dependent on body size and height. Furthermore, hip circumference is an index of muscle mass15 and may reflect exercise status and insulin sensitivity. Waist–hip ratio may prove also to be a more appropriate and universal indicator of risk for ethnically diverse populations, including small-framed Asian and Indian groups and large-framed Polynesians, but more detailed studies are required.
All the measures of obesity showed strong statistical correlations with triglyceride levels, HDL cholesterol levels and blood pressure, suggesting that vascular damage may be mediated by these associated factors. But waist–hip ratio proved to be independent of these factors on multivariate analysis, indicating that there may be other mechanisms whereby visceral adipose tissue confers risk.16
Waist–hip ratio appears superior to blood pressure and lipid levels in predicting cardiovascular endpoints, but caution in interpreting our findings is advised. In population studies, a single blood pressure or lipid reading is likely to underestimate the true risk (or hazard ratio) by at least a third,17 owing to random variation and fluctuation of an individual’s blood pressure and lipid levels, causing the well documented phenomenon of regression to the mean. In contrast, single measures of obesity such as BMI are much more stable and reproducible, with negligible regression dilution bias.18
BMI has been shown to be a significant risk factor for all-cause and cardiovascular mortality, but very large population samples are required to achieve conclusive statistical outcomes.2-4 Hazard ratios for BMI are quite low when compared with those of conventional risk factors. Moreover, exclusion of subjects with confounding conditions, such as past or present cigarette smoking and coexisting chronic disease, is required to sustain the relationship of BMI with mortality.
The importance of the central distribution of body fat has been known since the 1950s: Morris described increased cardiac deaths in London bus drivers with large belt sizes, in contrast to leaner, more active bus conductors;19 and Vague suggested that android (central and upper body) distribution of fat contributed to diabetes and atherosclerosis.20 The first longitudinal population studies from Gothenburg, Sweden, in 1984 showed that high waist–hip ratios were associated with stroke and ischaemic heart disease in men,9 and were the strongest anthropometric predictors of CVD and death in women.10,21 The data for men and women were combined (with statistical adjustment for different methods) to support a hypothesis that abdominal fat distribution “explained” the sex difference in the frequency of heart attacks.22 One further report of a large cohort of older women in Iowa (USA) confirmed waist–hip ratio as an important risk factor for death from CHD.23 The only other prospective data on central obesity relate to increased subscapular skinfold thickness, which is independently predictive of ischaemic heart disease.24,25 These studies raise the possibility that central fat deposits, other than visceral adipose tissue, contribute to increased risk.
Waist circumference has become the preferred measure for abdominal obesity. James advocates that waist measurements provide a simple discriminator of risk, in combination with BMI.15 He cites unpublished reanalysis of the Gothenburg data that waist circumference performs favourably in comparison with waist–hip ratio, although the original authors disagree.15 Waist circumference is the best surrogate measure for visceral fat mass, as estimated from computed tomography15,26 and dual-energy x-ray absorptiometry.27 The WHO has echoed these principles and supports the measurement of waist circumference.1 Subsequently, a number of cross-sectional studies have related waist measurement to the prevalence of diabetes6 and cardiovascular risk factors (most recently, the US Third National Health and Nutrition Examination Survey,28 and the Italian Olivetti Heart Study29). But there have been no further prospective studies in relation to cardiovascular endpoints.
We have used modern statistical methods to confirm that waist–hip ratio is the major obesity-related determinant of CVD and CHD death, and is independent of other modifiable risk factors. Our data also support the hypothesis22 that this measure accounts for much of the sex difference in incidence of CHD.
Recognition of central obesity by simple standardised means is clearly of clinical importance, as well as being relevant to epidemiological studies. Lifestyle interventions in those at risk are likely to yield significant benefits in preventing cardiovascular disease. There is strong evidence that sustained improvements in physical activity and diet will prevent diabetes.30 Similar studies should be mounted to determine the influence of such interventions on cardiovascular disease.
1: Baseline characteristics of the 1989 cohort of 9206 adults aged 20–69 years. The values are mean ± 1 SD or percentage, and are representative of the Australian urban population
|
Men |
Women |
|||||||||
Number of subjects |
4508 |
4698 |
|||||||||
Age (years) |
43 ± 13 |
43 ± 13 |
|||||||||
Height (cm) |
175 ± 7 |
162 ± 6 |
|||||||||
Weight (kg) |
79 ± 12 |
65 ± 13 |
|||||||||
Body mass index (BMI) (kg/m2) |
25.9 ± 3.6 |
24.9 ± 4.8 |
|||||||||
Waist circumference (cm) |
90 ± 11 |
77 ± 11 |
|||||||||
Waist–hip ratio |
0.89 ± 0.06 |
0.76 ± 0.06 |
|||||||||
Systolic blood pressure (mmHg) |
129 ± 17 |
123 ± 19 |
|||||||||
Diastolic blood pressure (mmHg) |
81 ± 11 |
76 ± 11 |
|||||||||
Total cholesterol (mmol/L) |
5.5 ± 1.1 |
5.5 ± 1.2 |
|||||||||
HDL cholesterol (mmol/L) |
1.2 ± 0.3 |
1.5 ± 0.4 |
|||||||||
Triglycerides (mmol/L) |
1.5 ± 1.3 |
1.1 ± 0.7 |
|||||||||
LDL cholesterol (mmol/L) |
3.7 ± 1.0 |
3.5 ± 1.0 |
|||||||||
Current smoker (%) |
27.0 |
21.0 |
|||||||||
Ever smoker (%) |
59.0 |
41.0 |
|||||||||
Self-reported diabetes (%) |
2.7 |
2.4 |
|||||||||
Self-reported angina/heart attack (%) |
5.1 |
2.4 |
|||||||||
HDL = high-density lipoprotein. LDL = low-density lipoprotein.
2: Correlation coefficients,* age standardised, between body mass index, waist circumference, waist–hip ratio, and cardiovascular risk factors in men and women
Risk factor |
Age-standardised partial correlation coefficients (R) |
||||||||||
Body mass index | Waist circumference | Waist–hip ratio |
|||||||||
Men |
Women | Men |
Women | Men |
Women |
||||||
Blood pressure |
|
|
|
|
|
|
|||||
Systolic |
0.27 |
0.25 | 0.25 |
0.23 | 0.19 |
0.15 |
|||||
Diastolic |
0.30 |
0.26 | 0.29 |
0.24 | 0.21 |
0.15 |
|||||
Cholesterol |
|
|
|
|
|
|
|||||
Total cholesterol |
0.17 |
0.12 | 0.17 |
0.15 | 0.17 |
0.15 |
|||||
HDL cholesterol |
− 0.25 |
− 0.26 | − 0.25 |
− 0.28 | − 0.22 |
− 0.23 |
|||||
Triglycerides |
0.33 |
0.29 | 0.35 |
0.38 | 0.35 |
0.36 |
|||||
LDL cholesterol |
0.15 |
0.16 | 0.15 |
0.18 | 0.14 |
0.16 |
|||||
* The correlation coefficients (R values) indicate the strength of the associations between obesity and risk factors, and may suggest causal mechanisms. All values were significant at P < 0.0001. HDL = high-density lipoprotein. LDL = low-density lipoprotein. |
|||||||||||
3: Distribution (%) of obesity measures, by class intervals for body mass index, waist circumference, and waist–hip ratio, with corresponding crude mortality rates for cardiovascular disease (CVD) and coronary heart disease (CHD) deaths, 1989–2000
4: Cardiovascular disease mortality, 1989–2000: age-standardised hazard ratios for risk factors by Cox regression. The hazard ratios (with 95% CIs) refer to the risk at 1 SD above the mean for each variable, and are shown for univariate and stepwise multivariate regression
Risk factor |
Cardiovascular disease mortality: hazard ratios for + 1 SD |
||||||||||
Men |
Women |
||||||||||
Univariate |
Multivariate |
Univariate |
Multivariate |
||||||||
Body mass index |
1.23 (1.01–1.50)§ |
— |
1.26 (1.00–1.60) |
— |
|||||||
Waist circumference |
1.39 (1.14–1.70)‡ |
— |
1.37 (1.06–1.78)§ |
— |
|||||||
Waist–hip ratio |
1.63 (1.31–2.01)* |
1.60 (1.27–2.02)* |
1.58 (1.19–2.09)‡ |
1.59 (1.16–2.17)‡ |
|||||||
Systolic blood pressure |
1.22 (1.02–1.46)§ |
— |
1.34 (1.03–1.24)§ |
— |
|||||||
Diastolic blood pressure |
1.32 (1.09–1.41)‡ |
1.28 (1.04–1.57)§ |
1.39 (1.03–1.88)§ |
— |
|||||||
Total cholesterol |
1.13 (0.91–1.39) |
— |
1.27 (0.93–1.74) |
— |
|||||||
High-density lipoprotein cholesterol |
0.96 (0.79–1.17) |
— |
0.80 (0.58–1.09) |
— |
|||||||
Triglycerides |
1.16 (1.06–1.27)‡ |
— |
1.10 (0.99–1.22) |
— |
|||||||
Low-density lipoprotein cholesterol |
1.02 (0.82–1.26) |
— |
1.28 (0.95–1.73) |
— |
|||||||
Current smoker |
1.11 (0.69–1.77) |
— |
3.36 (1.77–6.37)† |
3.08 (1.55–6.10)‡ |
|||||||
Ever smoker |
1.15 (0.74–1.80) |
— |
2.26 (1.22–4.19)‡ |
— |
|||||||
Angina/myocardial infarction |
2.87 (1.84–4.50)* |
2.46 (1.54–3.95)† |
4.59 (2.19–9.62)* |
5.10 (2.32–11.20)* |
|||||||
Diabetes |
1.25 (0.58–2.70) |
— |
2.69 (0.96–7.57) |
— |
|||||||
* P < 0.0001; † P < 0.001; ‡ P < 0.01; § P < 0.05. |
|||||||||||
5: Coronary heart disease mortality, 1989–2000: age-standardised hazard ratios for risk factors by Cox regression. The hazard ratios (with 95% CIs) refer to the risk at 1 SD above the mean for each variable, and are shown for univariate and stepwise multivariate regression
Risk factor |
Coronary heart disease mortality: hazard ratios for + 1 SD |
||||||||||
Men |
Women |
||||||||||
Univariate |
Multivariate |
Univariate |
Multivariate |
||||||||
Body mass index |
1.26 (1.00–1.59) |
— | 1.34 (1.00–1.79)§ |
— |
|||||||
Waist circumference |
1.43 (1.14–1.81)‡ |
— |
1.54 (1.10–2.15)§ |
— |
|||||||
Waist–hip ratio |
1.74 (1.35–2.23)* |
1.47 (1.10–1.96)§ |
1.77 (1.23–2.56)‡ |
1.88 (1.26–2.81)‡ |
|||||||
Systolic blood pressure |
1.31 (1.07–1.60)‡ |
— |
1.40 (0.99–1.99) |
— |
|||||||
Diastolic blood pressure |
1.36 (1.08–1.71)‡ |
1.27 (1.00–1.61)§ |
1.11 (0.72–1.71) |
— |
|||||||
Total cholesterol |
1.16 (0.91–1.48) |
— |
1.50 (1.00–2.24)§ |
— |
|||||||
High-density lipoprotein cholesterol |
0.79 (0.62–1.02) |
— |
0.77 (0.51–1.17) |
— |
|||||||
Triglycerides |
1.18 (1.07–1.30)† |
1.49 (1.03–2.15)§ |
1.13 (1.02–1.25)§ |
— |
|||||||
Low-density lipoprotein cholesterol |
1.09 (0.85–1.40) |
— |
1.44 (0.97–2.14) |
— |
|||||||
Current smoker |
1.11 (0.67–2.02) |
— |
3.29 (1.37–7.88)‡ |
2.89 (1.15–7.30)§ |
|||||||
Ever smoker |
1.09 (0.64–1.83) |
— |
2.55 (1.09–5.96)§ |
— |
|||||||
Angina/myocardial infarction |
3.69 (2.23–6.11)* |
3.14 (1.86–5.29)* |
7.18 (2.79–18.47)* |
7.28 (2.66–19.92)* |
|||||||
Diabetes |
1.21 (0.49–3.03) |
— |
2.52 (0.59–10.83) |
— |
|||||||
* P < 0.0001; † P < 0.001; ‡ P < 0.01; § P < 0.05. |
|||||||||||
6: Age-standardised hazard ratios for the three measures of obesity, waist–hip ratio (WHR), waist circumference and body mass index (BMI) in predicting cardiovascular disease deaths and coronary heart disease deaths
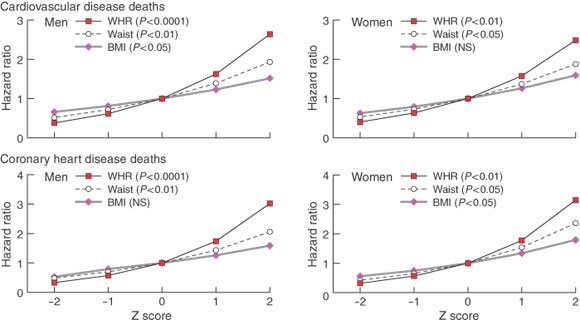
Univariate Cox regression analysis. The hazard ratios are expressed as a “Z score”, indicating the risk of - 2, - 1, + 1, + 2 SDs, compared with the mean.
7: Age-standardised hazard ratios for waist–hip ratio (WHR) in comparison with diastolic blood pressure (DBP), serum triglyceride levels (TRIG) and serum cholesterol levels (CHOL) in predicting cardiovascular disease deaths and coronary heart disease deaths
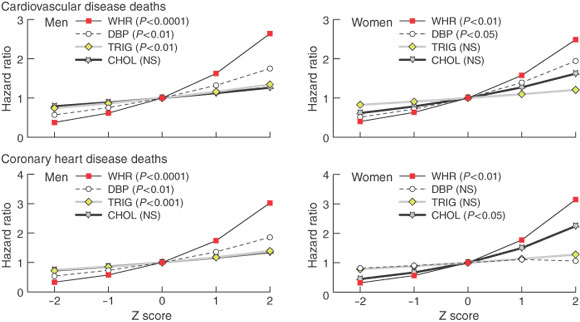
Univariate Cox regression analysis. The hazard ratios are expressed as a “Z score”, indicating the predictive risk of - 2, - 1, + 1, + 2 SDs, compared with the mean.
- Timothy A Welborn1
- Satvinder S Dhaliwal2
- Stanley A Bennett3
- 1 Department of Endocrinology and Diabetes, Sir Charles Gairdner Hospital, Nedlands, WA.
- 2 School of Public Health, Curtin University of Technology, Perth, WA.
- 3 National Centre for Monitoring Cardiovascular Diseases, Australian Institute of Health and Welfare, Bruce, ACT.
We are grateful to the National Heart Foundation of Australia for permission to use data from the 1989 Risk Factor Prevalence Survey. Officers of the Australian Institute of Health and Welfare linked the data to the National Death Index, and we thank Gabrielle Hodgson, Robert Vanderhoek, Paul Jelfs, Tracy Dixon and John Harding.
None identified.
- 1. World Health Organization. Obesity: preventing and managing the global epidemic. Report of a WHO Consultation on Obesity. Geneva: WHO, 1998.
- 2. Stevens J, Cai J, Pamuk ER, et al. The effect of age on the association between body mass index and mortality. N Engl J Med 1998; 338: 1-7.
- 3. Manson JE, Willett WC, Stampfer MJ, et al. Body weight and mortality among women. N Engl J Med 1995; 333: 677-685.
- 4. Lee I-M, Manson JE, Hennekens CH, et al. Body weight and mortality: a 27 year follow-up of middle-aged men. JAMA 1993; 270: 2823-2828.
- 5. Colditz GA, Willett WC, Stampfer MJ, et al. Weight as a risk factor for clinical diabetes in women. Am J Epidemiol 1990; 152: 501-513.
- 6. Chan JM, Stampfer MJ, Rimm EB, et al. Obesity, fat distribution, and weight gain as risk factors for clinical diabetes in men. Diabetes Care 1994; 17: 961-969.
- 7. Reaven GM. Pathophysiology of insulin resistance in human disease. Physiol Rev 1995; 75: 473-486.
- 8. Cameron AJ, Welborn TA, Zimmet PZ, et al. Overweight and obesity in Australia: the 1999–2000 Australian Diabetes, Obesity and Lifestyle Study (AusDiab). Med J Aust 2003; 178: 427-432. <MJA full text>
- 9. Larsson B, Svardsudd K, Welin L, et al. Abdominal adipose tissue distribution, obesity and risk of cardiovascular disease and death: 13 year follow up of participants in the study of men born in 1913. BMJ 1984; 288: 1401-1404.
- 10. Lapidus L, Bengtsson C, Larsson B, et al. Distribution of adipose tissue and risk of cardiovascular disease and death: a 12 year follow up of participants in the population study of women in Gothenburg, Sweden. BMJ 1984; 289: 1257-1261.
- 11. Risk Factor Prevalence Study Management Committee. Risk factor prevalence study survey — No. 3, 1989. Canberra: National Heart Foundation of Australia and Australian Institute of Health, 1990.
- 12. Boyle CA, Dobson AJ, Egger G, Bennett SA. Waist-to-hip ratios in Australia: a different picture of obesity. Aust J Nutr Diet 1993; 50: 57-64.
- 13. World Health Organization. International Classification of Diseases. Manual of the international statistical classification of diseases, injuries, and causes of death, 9th revision (ICD-9). Geneva: WHO, 1977.
- 14. World Health Organization. International Classification of Diseases. Manual of the international statistical classification of diseases, injuries, and causes of death, 10th revision (ICD-10). Geneva: WHO, 1998.
- 15. James WPT. The epidemiology of obesity. In: Chadwick DJ, Cardew G, editors. The origins and consequences of obesity. Chichester: Wiley, 1996: 1-16. (Ciba Foundation Symposium 201.)
- 16. Matsuzawa Y, Funahashi T, Nakamura T. Molecular mechanism of metabolic syndrome X: contribution of adipocytokines adipocyte-derived bioactive substances. Ann N Y Acad Sci 1999; 892: 146-154.
- 17. Clarke R, Shipley M, Lewington S, et al. Underestimation of risk associations due to regression dilution in long term follow-up of prospective studies. Am J Epidemiol 1999; 150: 341-353.
- 18. Woodward M, Oliphant J, Lowe G, Tunstall-Pedoe H. Contribution of contemporaneous risk factors to social inequality in coronary heart disease and death. Scottish Heart Cohort Studies Collaboration. Prev Med 2003; 36: 561-568.
- 19. Morris JN. Occupation and coronary heart disease. Arch Intern Med 1959; 104: 903-907.
- 20. Vague J. The degree of masculine differentiation of obesities: a factor determining predisposition to diabetes, atherosclerosis, gout and uric-calculous disease. Am J Clin Nutr 1956; 4: 20-34.
- 21. Bengtsson G, Bjorkelund C, Lapidus L, Lissner L. Associations of serum lipid concentrations and obesity with mortality in women: 20 year follow up of participants in prospective population study in Gothenburg, Sweden. BMJ 1993; 307: 1385-1388.
- 22. Larsson B, Bengtsson C, Bjorntorp P, et al. Is abdominal body fat distribution a major explanation for the sex difference in the incidence of myocardial infarction? The study of men born in 1913 and the study of women, Göteborg, Sweden. Am J Epidemiol 1992; 135: 266-273.
- 23. Prineas RJ, Folsom AR, Kaye SA. Central adiposity and increased risk of coronary artery disease mortality in older women. Ann Epidemiol 1993; 3: 35-41.
- 24. Donahue RP, Abbott RD, Bloom E, et al. Central obesity and coronary heart disease in men. Lancet 1987; 1: 821-824.
- 25. Freedman DS, Williamson DF, Croft JB, et al. Relation of body fat distribution to ischaemic heart disease. Am J Epidemiol 1995; 142: 53-63.
- 26. Pouliot M-C, Desprès JP, Lemieux S, et al. Waist circumference and abdominal sagittal diameter: best simple arthropometric indexes of abdominal visceral adipose tissue accumulation and related cardiovascular risk in men and women. Am J Cardiol 1994; 73: 460-468.
- 27. Samaras K, Campbell LV. The non-genetic determinants of central obesity. Int J Obesity 1997; 21: 839-845.
- 28. Zhu SK, Wang ZM, Heshka S, et al. Waist circumference and obesity-associated risk factors among whites in the third National Health and Nutrition Survey. Am J Clin Nutr 2002; 76: 743-749.
- 29. Siani AS, Cappucio FP, Barba G, et al. The relationship of waist circumference to blood pressure: the Olivetti Heart Study. Am J Hypertens 2002; 15: 780-786.
- 30. Diabetes Prevention Program Research Group. Reduction in the incidence of type 2 diabetes with lifestyle intervention or metformin. N Engl J Med 2002; 346: 393-403.
Abstract
Objective: To evaluate clinical measures of obesity for their ability to predict death from cardiovascular disease (CVD) and coronary heart disease (CHD), in parallel with conventional cardiovascular risk factors.
Design, participants and setting: Cross-sectional analysis of an age- and sex-stratified sample of 9206 adults aged 20–69 years from Australian capital cities (1989 Australian Risk Factor Prevalence Survey). Blood pressure, fasting serum lipid levels, smoking, history of heart disease or diabetes, and obesity as measured by body mass index (BMI), waist circumference and waist–hip ratio were recorded. These data were linked with the National Death Index to determine causes of death of the 473 survey subjects who had died to 31 December 2000.
Main outcome measures: Hazard ratios for the risk factors predicting CVD mortality and CHD mortality.
Results: Of the modifiable risk factors, obesity, as measured by waist–hip ratio, is a dominant, independent, predictive variable for CVD and CHD deaths in Australian men and women. Self-reported angina/myocardial infarction in both sexes, and cigarette smoking in women, are also independent risk factors.
Conclusions: Obesity assessed by waist–hip ratio is a better predictor of CVD and CHD mortality than waist circumference, which, in turn, is a better predictor than BMI. The recognition of central obesity is clinically important, as lifestyle intervention is likely to provide significant health benefits.