


The rising prominence of chronic diseases in ageing Western societies is increasing the role of prevention. However, the principles underlying curative and preventive medicine are quite distinct. The latter is characterised by long-term treatment of mostly healthy individuals, many of whom need to be treated to prevent disease in a few — the "prevention paradox".1 Accordingly, the benefits of treatment may be finely balanced against the risks and costs.
Randomised controlled clinical trials and meta-analyses of trials provide the most reliable data about the efficacies of drug therapies, but generally do not give sufficient information to dictate clinical practice. The temptation to "blindly" accept the results of clinical trials should be resisted, especially for preventive drugs, which have less tangible potential benefits and harms than drugs used to treat disease. The potential effect of any preventive strategy needs to be assessed within the broader context of long-term drug administration, competing mortality and morbidity risks, demographic change and disease trends.
Epidemiological modelling involves using mathematical functions to marry data from clinical trials with those from observational epidemiology and demography to estimate potential benefits, risks and costs of treatments. The aim is to facilitate clinical and health policy decision-making in light of the best available evidence. A common example of epidemiological modelling is decision analysis.
This article describes the application of epidemiological modelling to preventive medicine, with particular focus on preventive drug therapies.
Clinical trials of preventive therapies most commonly report efficacy in terms of relative risk reduction (proportional benefit). This provides an immediate impression of the strength of effect of a treatment and also allows comparison among various treatment strategies. Furthermore, as relative risk reductions are often similar across different subpopulations, clinical interpretation is easier.
However, decisions about introducing preventive therapy must be based on the likely absolute benefit of therapy rather than proportional benefit. Absolute benefit is determined by a combination of baseline (pretreatment) risk and the proportional benefit conferred by the intervention. As baseline risk may vary greatly among patients, potential absolute benefit of treatment may also vary.
For example, consider use of cholesterol-lowering therapy for primary prevention of coronary heart disease (CHD) in two patients with similar risk-factor profiles: total cholesterol, 6.5 mmol/L; high-density lipoprotein cholesterol, 0.9 mmol/L; and blood pressure, 170/100 mmHg. A constant relative risk reduction of 30% for a primary CHD event can be expected.2 The first patient is a 65-year-old man who smokes. According to a recent Framingham risk equation, he has a four-year absolute risk of CHD of 24%.3 The second patient is a 45-year-old non-smoking woman whose equivalent risk is 3%. Cholesterol-lowering treatment achieves a 7% absolute risk reduction in the man, meaning that 14 such individuals would need to be treated to prevent CHD in one. In contrast, in the woman, treatment achieves a 1% absolute risk reduction, meaning that 100 such individuals need to be treated to prevent CHD in one.
It is not rational to base treatment decisions solely on relative benefits when potential absolute benefits vary widely, as this may lead to treatment of many for whom absolute health gain and cost-effectiveness are low, and the omission from treatment of others for whom these are high.
In addition, the common practice of using the characteristics of trial subjects to define who should be treated is not always logical. For example, if inclusion criteria for the West of Scotland Coronary Prevention Study4 were used to decide eligibility for primary prevention of CHD using pravastatin, 11.5% of Scottish men aged 35 to 64 years would receive treatment, and the associated costs would cripple the UK health system.5
Research data must therefore be modelled to identify precisely who is most likely to benefit from preventive therapy. This concept has been reflected in recent guidelines for prevention of cardiovascular disease issued by major international organisations, which recommend therapy based on the potential for absolute benefit.6,7
The expense and logistical difficulties of large-scale clinical trials mean that they can be undertaken in only a few of the many possible clinical scenarios. The applicability of trial results to patients outside entry criteria is a critical consideration, but generally receives little attention. Answers are needed to fundamental questions, such as the age at which to start and stop preventive therapy, and the subpopulations for which its use is appropriate. The consequences of varying compliance and lag-time between drug initiation and effect also need to be determined. Each of these generally requires extrapolation well beyond available objective data.
An example of the use of epidemiological modelling to facilitate clinical decision-making is shown in Box 1. This modelling allows results of absolute risk equations to be extrapolated from the populations from which they were derived to other populations (such as the Australian population). It also allows the long-term effects of a preventive intervention (whose efficacy has been determined by clinical trials) to be gauged for individuals with different underlying risks.
With increasing focus on evidence-based medicine, the generalisability of research results is crucial for health practitioners. In the future, it is likely that clinical trials will serve mainly as "beacons" to clarify the risk–benefit trade-off in limited clinical settings, while epidemiological modelling will allow extrapolation to other scenarios.
Epidemiological modelling permits evaluation of the trade-off between the beneficial and harmful effects of preventive therapy. Uncommon or late-manifesting adverse effects that affect the risk–benefit ratio may not be evident within the limited setting of a clinical trial.
Modelling is also useful when trials reveal an increase in unexpected adverse effects, as was found with non-vascular mortality in studies of cardiovascular prevention with clofibrate8,9 and gemfibrozil.10 As the rate of adverse effects is unlikely to be related to the level of pretreatment cardiovascular risk, determination of their likelihood must be modelled from other data sources.
The economic efficiency of a preventive strategy is typically measured in terms of a cost-effectiveness ratio — the net expenditure per unit of health gain (Box 2). With the current explosion in health expenditure, cost-effectiveness has become a major determinant of the suitability of preventive strategies. The need for efficiency is highlighted by the fact that preventive medications cost the Pharmaceutical Benefits Scheme billions of dollars annually. For example, about $A600 million is spent on "statins" (hydroxymethylglutaryl coenzyme A [HMG CoA] reductase inhibitors) alone.11
The onus is on all healthcare practitioners to ensure responsible health expenditure, both in terms of technical and allocative efficiency. That is, not only to ensure that preventive strategies are delivered in the most cost-effective manner, but also that the benefits achieved through preventive activities are not substantially less than would be achieved if the funding was used for alternative health programs.
Epidemiological modelling provides a convenient tool for cost-effectiveness analysis. First and foremost, it allows relatively precise estimation of potential absolute benefit in a wide spectrum of individuals. Secondly, it facilitates the extrapolation required to predict the costs and effects of treatment beyond the limited duration and study population of most prevention trials.
Several studies have described the economic efficiency of preventing cardiovascular disease with statins,5,12-16 including the only evaluation undertaken in Australia (by the authors).16 All relied on epidemiological modelling of trial data. Results consistently suggested that cost-effectiveness was very sensitive to the age group treated and cardiovascular risk profile. Even among the narrow range of subjects studied in some analyses, cost-effectiveness varied greatly, emphasising the need to target treatment carefully.
Epidemiological modelling is likely to revolutionise the way that disease risk is described to patients. At present, the benefits of preventive therapies are typically presented in terms of proportional risk reductions. While this approach is simple, accurate and convenient, because of the consistency of proportional benefit of therapy, it may be misleading unless patients are aware of their absolute risk and other competing risks.
Modelling provides useful "bedside" outputs — life tables and associated survival curves that illustrate an individual's absolute likelihood of being alive and/or free of disease at various ages, depending on risk-factor profile. Modification of the life tables can then demonstrate the likely influence of various therapies on an individual's survival curve (as exemplified in Box 1). Additionally, it can allow patients to compare the effect of various interventions and choose that which best suits their preferences. This gives patients the necessary basis for making informed decisions about preventive therapy.
Such tools will also assist clinicians in choosing the most effective and tolerable interventions for specific patients. For example, it may be apparent that cholesterol-lowering therapy combined with aspirin is preferable to antihypertensive therapy for an individual with mild hypertension.
Future developments in medicine will lead to improved tools for predicting disease and more effective therapies. Despite these advances, questions will remain about whom to treat, when to commence therapy, and how long to continue it. As long as community resources are limited, and populations become healthier and longer-living, it will be necessary to determine objective and equitable ways of targeting preventive therapies based on the most reasonable extrapolations of available data. As major epidemiological studies, like clinical trials, will only ever be conducted on limited patient subgroups and within limited settings, epidemiological modelling will be required to extrapolate the results to the broader community and to the long-term.
1: An example of use of epidemiological modelling to assist targeting of interventions for primary prevention of coronary heart disease (CHD)
Step 1. Calibrate absolute risk estimates to the Australian population
This involves combining information from:
the Framingham absolute-risk prediction equation for CHD events based on multiple risk factor exposures;
distribution of cardiovascular risk factors in the Australian population; and
Australian CHD event rates.
1A. Assess cardiovascular risk factors in arepresentative sample of the Australian population (eg, the 1989 Risk Factor Prevalence Study and the recent Australian Diabetes, Lifestyle and Obesity [AusDiab] Study are large Australian surveys of risk factors). Allocate individuals in the sample to age and sex strata.
1B. Calculate the Framingham absolute risk of CHD event for each individual in each stratum of the sample based on individual risk factors (eg, age, sex, blood pressure, smoking and cholesterol levels).
1C. Calculate the average Framingham risk for each stratum.
1D. Calculate relative risk for each individual compared to the average Framingham risk for his or her age and sex stratum.
1E. For each individual, multiply his or her relative risk by the observed CHD event rate for his or her age and sex stratum in Australia. This gives a calibrated absolute risk of a CHD event, based on the individual's risk factor profile.
Hypothetical example
1A. A random sample of the Australian population includes 10 men aged 52 years. Using this stratum as an example, the following calculations are made.
Individual |
|||||||||||
1 |
2 |
3 |
4 |
5 |
6 |
7 |
8 |
9 |
10 |
||
1B. Absolute risk* (%/year) |
2.31 |
5.54 |
3.45 |
1.37 |
2.76 |
0.74 |
4.21 |
3.17 |
1.62 |
0.93 |
|
1C. Average absolute risk = 2.61%/year |
|||||||||||
1D. Relative risk (absolute risk/average risk) |
0.89 |
2.12 |
1.32 |
0.52 |
1.06 |
0.28 |
1.61 |
1.21 |
0.62 |
0.36 |
|
1E. Calibrated absolute risk (%/year) (relative risk x CHD event rate†) |
1.64 |
3.90 |
2.43 |
0.96 |
1.95 |
0.52 |
2.96 |
2.23 |
1.14 |
0.66 |
|
* Determined from a multivariate risk equation (eg, Framingham risk equation) on the basis of individual cardiovascular risk factor profiles. † Hypothetical rate for this subpopulation = 1.84% per person per annum. |
|||||||||||
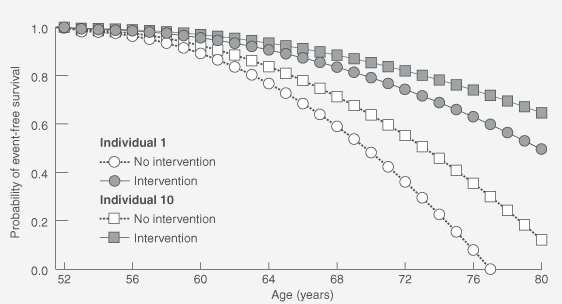
Step 2. Generate survival curves with and without a preventive intervention
Calculate the calibrated absolute risk estimates for an individual for each year over a period and apply to life-table analyses to generate a survival curve. Include the relative risk reduction associated with a preventive intervention to generate a second curve in the presence of this intervention.
Hypothetical example
Calibrated absolute risk estimates are calculated for Individuals 1 and 10 for each year between 52 and 80 years (not shown) and applied to life-table analyses to generate curves for event-free survival (graph). The effects of an intervention associated with a 30% reduction in relative risk are modelled; such measures of efficacy are drawn from clinical trials. (The graph assumes that the absolute risk of a CHD event increases exponentially with age, but that the 30% reduction in relative risk remains constant.)
- Danny Liew1
- John J McNeil2
- Anna Peeters3
- Stephen S Lim4
- Theo Vos5
- Epidemiological Modelling Unit, Department of Epidemiology and Preventive Medicine, Monash University Medical School, Alfred Hospital, Melbourne, VIC.
We thank Professor E Seeman (Department of Medicine and Endocrinology, Austin and Repatriation Medical Centre, Melbourne, VIC) for his useful comments. Danny Liew is supported by a Postgraduate Medical Scholarship from the National Health and Medical Research Council, and Stephen Lim by an Australian Postgraduate Award from Monash University, Melbourne, VIC.
None identified.
- 1. Rose G. What needs to be prevented? In: The strategy of preventive medicine. New York: Oxford University Press, 1992: 6-14.
- 2. Pignone M, Phillips C, Mulrow C. Use of lipid lowering drugs for primary prevention of coronary heart disease: meta-analysis of randomised trials. BMJ 2000; 321: 983-986.
Abstract
In contrast to curative therapies, preventive therapies are administered to largely healthy individuals over long periods. The risk–benefit and cost–benefit ratios are more likely to be unfavourable, making treatment decisions difficult.
Drug trials provide insufficient information for treatment decisions, as they are conducted on highly selected populations over short durations, estimate only relative benefits of treatment and offer little information on risks and costs.
Epidemiological modelling is a method of combining evidence from observational epidemiology and clinical trials to assist in clinical and health policy decision-making.
It can estimate absolute benefits, risks and costs of long-term preventive strategies, and thus allow their precise targeting to individuals for whom they are safest and most cost-effective.
Epidemiological modelling also allows explicit information about risks and benefits of therapy to be presented to patients, facilitating informed decision-making.