


Length of consultation is an important characteristic of general practice care, and, in Australia, general practitioners are remunerated on the basis of consultation time. Time spent consulting with patients is an important feature of quality of care in general practice.1 Longer consultations are associated with higher patient satisfaction.2-4 Length of consultation has also been shown to be an important predictor of patient enablement, a measure of the extent to which patients feel empowered to self-manage their illness as a result of a consultation.5 Preventive care is more likely to be offered in longer consultations.3 Complex chronic illness is more time consuming to manage, and best practice may require longer consulting times. Psychosocial problems are also better recognised and managed in longer consultations.6
People from socioeconomically disadvantaged areas have higher mortality and higher rates of nearly all chronic diseases.7,8 This increased disease burden would be expected to require a higher rate of longer consultations in such disadvantaged areas. Similarly, disadvantaged people have lower uptake rates for preventive care.7 While there is evidence that this may be in spite of their being offered preventive services at a similar or higher rate than more advantaged people,9 increased need for preventive care would also be expected to lead to a higher rate of long consultations in disadvantaged areas.
Our aim in this study was to examine the rate of provision of longer consultations among practices categorised by the socioeconomic status of the practice billing location.
Summarised Medicare claims data were obtained from the General Practice Branch of the Commonwealth Department of Health and Ageing for the financial years 1998–99 and 1999–2000. The data included numbers of all non-referred consultations for all general practitioners and other non-vocationally registered, non-specialist medical practitioners in Australia, grouped by time and complexity type (short, standard, long, prolonged, as described in the Medical Benefits Schedule10). Specialists were excluded. Data for each general practitioner were allocated to the postcode of his or her billing practice location, or to the relevant postcode for GPs who consulted over a number of postcodes. For analysis, short and standard consultations were grouped, as were long and prolonged consultations.
Socio-Economic Indexes for Areas, Index of Relative Socio-Economic Disadvantage (SEIFA IRSD) scores for each postcode, obtained from the HealthWIZ database, were then used to group postcodes into quantiles of relative disadvantage.11,12 Postcodes were grouped on the basis of about equal numbers of postcodes rather than about equal population. Eleven groups (–5 [most disadvantaged] to +5 [most advantaged]) were used, consistent with the categories reported in HealthWIZ. Data for practice locations in each postcode quantile were added to give total numbers of consultation type for each quantile of relative socioeconomic disadvantage.
Population estimates for postcodes for the same periods were obtained from the Australian Bureau of Statistics.13
Data for each collection year were analysed separately.
Data on the percentage of consultations that were direct (or bulk) billed across the SEIFA categories were obtained from HealthWIZ for the financial years 1997–98 and 1998–99, being the latest available for SEIFA categories.
The percentage of longer (long plus prolonged) consultations was calculated for each SEIFA quantile and financial year. The rate of consultations per person per year was calculated by dividing the total consultations by the total estimated population for each quantile and year. The 95% confidence interval was calculated for the percentage of consultations and rate of consultations per year.
Poisson regression was used to calculate the rate ratio for the rate of longer consultations per person across the 11 SEIFA postcode categories, adjusted for year.
Statistical significance was set at 5% for a two-sided test.
Analysis was performed with STATA statistical software.14
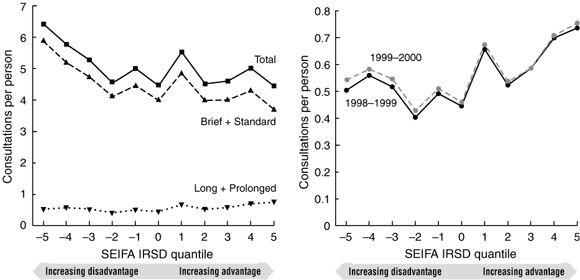
Shorter (brief plus standard) consultations predominated, comprising 88.9% of the total in 1998–99 and 88.3% in 1999–2000. The rate of brief plus standard consultations per head of population within each SEIFA category increased with increasing disadvantage (Boxes 1, 2a). Long plus prolonged consultations followed a reverse trend, most marked across the four most socioeconomically advantaged groups (Boxes 1, 2b).
There was a highly significant increase in the rates of long plus prolonged consultations per head of population with increasing socioeconomic advantage (Box 3). Based on the Poisson regression model, the rate of long plus prolonged consultations per person increased 3.8% for every unit increase in the SEIFA category. For instance, the rate ratio between the lowest (–5) and highest (+5) SEIFA category was 1.46 (95% CI, 1.46–1.46), while the rate ratio between the lowest (–5) and middle (0) SEIFA category and the middle (0) and highest (+5) SEIFA category was 1.21 on each occasion.
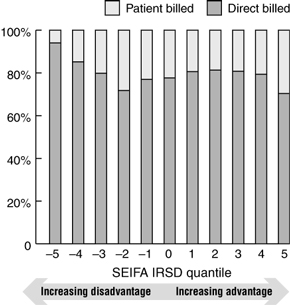
Almost 95% of consultations in the most disadvantaged SEIFA category were direct billed, compared with 70%–80% in more advantaged postcode groups (Box 4).
There was a significant increase in the rate of long plus prolonged consultations with increasing socioeconomic status. There was also a marked increase in the use of brief plus standard consultations per person with each step in disadvantage across the four most disadvantaged categories.
People in disadvantaged areas visit GPs more often annually, but they are less likely to have a long consultation. The rate of long plus prolonged consultations per person increased by almost 4% with each step up in socioeconomic status. This is despite the increased burden of chronic disease and need for preventive care in patients from disadvantaged areas.
There were a number of limitations to our data.
We were unable to report the rate of consultation types per GP across SEIFA categories, as about 40% of GPs consulted across more than one SEIFA postcode group. For privacy reasons, the data were not provided in a way that made it possible to identify individual GPs. The distribution across SEIFA categories of practices with multiple billing locations and full-time or part-time GPs might explain some of the findings presented in Box 1. However, this would need further research.
There has been recent criticism of the use of SEIFA IRSD as a measure of socioeconomic disadvantage at a population level,15 because of the loss of fine detail when examining area differences in health indicators. This would tend to mean that any differences we have identified may be less than would appear if smaller areas of disadvantage were examined.
Additionally, associations observed from aggregate data may not be true at the individual level. Further, given the large number of records analysed the statistical tests should be interpreted with care. Small differences may be found to be statistically significant, but may not be considered clinically important.
The extent to which GPs in disadvantaged areas see patients from outside those areas is unknown. The SEIFA scores we used were for GP location rather than patient residence. Patients may have come from areas that were more or less disadvantaged than the area in which the GPs' practices were located.
Finally, while they remain the only data available, the relationship between billing data and actual time spent in consultations is not known.
The higher levels of chronic disease and lower rates of preventive care found in disadvantaged communities would suggest that longer consultations should be more common in these areas. This assumes that the provision of care is proportional to need. In fact, we have identified a reverse trend, with longer consultations being more common for patients in relatively advantaged areas. This confirms, on a national scale, the trend identified in an earlier study on a small number of patients in the Australian Capital Territory, which showed that longer consultations were unrelated to need.16
Are people in poorer areas seeing GPs more frequently, for shorter consultations? Our findings show that there was some trend in that direction.
Consultation length may be determined to some extent by the fee structure that GPs work within. GPs in more disadvantaged areas are more likely to bulk bill (Box 4), and it may be that those who bulk bill are best able to maximise their income through multiple shorter consultations rather than fewer longer ones. However, one report on the period 1989 to 1996 showed that longer consultations were twice as common when the consultation was bulk billed.16 Further analysis of the proportions of old and new medical problems managed within each location would help clarify this issue.
It may be that GPs in poorer areas are more overwhelmed with unmet need and are only able to meet patient demand through more frequent, shorter consultations.
It is possible to manage some aspects of complex chronic problems through more frequent, shorter consultations. However, this ignores the findings that many markers of quality care, including satisfaction, patient enablement, preventive care, fewer prescriptions, appropriate referral and investigation, recognition and management of psychosocial problems, are all more likely within longer consultations. These are important and meaningful outcomes in terms of the burden of chronic disease.
Patient factors, including their expectations of GPs, their ability to articulate needs, their readiness for preventive action and their cultural difference from the GP, may also play a part in determining the time spent in the consultation.
Further research into the relationship between consultation length and quality of care and health outcomes is needed.17
Patients visiting GPs in disadvantaged areas may not be receiving the same high quality care as patients in more advantaged locations.
This may represent an example of the inverse care law,18 where medical care is least likely to reach those most in need. With the current emphasis on the importance of coordinating care, integrating care and promoting self-management, people in disadvantaged areas are missing out on the feature of care most likely to enhance these within a consultation — namely, time. Patients and GPs in these areas may not be well placed to benefit from these new initiatives. It will be important to examine data on the uptake of the new Enhanced Primary Care items (which support care planning for aged patients and people with chronic diseases requiring multidisciplinary care) to see if they follow a similar inverse relationship to need.
A number of responses are possible. More GPs are needed to meet the increased need in disadvantaged communities, both rural and metropolitan. Financial structures are needed that encourage longer consultations. GPs struggling to meet the medical need in disadvantaged communities need better support to allow them to meet this need through strengthened allied health and community health services in those areas. The community in disadvantaged areas needs to be aware of the benefits of longer time spent consulting with a GP.
Inequity in access to high quality care requires systematic monitoring and action within health policy, and programs at both a federal and State level.
Whatever the underlying reason, it seems that people from disadvantaged areas are less likely to have longer consultations with GPs in their area. This is despite the fact that, as a group, they have significantly higher need for care. This indicates that this aspect of high quality general practitioner care is inequitably distributed in our community. Further exploration of how other aspects of care, such as prescribing, referral and investigation rates, are used according to need will help explain how poorer access to longer consultations is influencing other aspects of care.
1: Percentage of consultations that were long plus prolonged, and the rate of all consultations and long plus prolonged consultations per person per year, for each Socio-Economic Indexes for Areas, Index of Relative Socio-Economic Disadvantage (SEIFA IRSD) postcode group for the financial years 1998–1999 and 1999–2000
SEIFA IRSD quantile* |
Estimated population† |
Total consultations |
Percentage of long plus prolonged consultations |
Total consultations per person per year |
Long plus prolonged consultations per person per year |
||||||
% |
95% CI |
IR‡ |
95% CI |
IR‡ |
95% CI |
||||||
1998–1999 |
|||||||||||
−5 |
1 325 241 |
8 645 716 |
7.72 |
7.70–7.74 |
6.52 |
6.52–6.53 |
0.504 |
0.502–0.505 |
|||
−4 |
1 783 680 |
10 522 727 |
9.49 |
9.47–9.50 |
5.90 |
5.90–5.90 |
0.560 |
0.559–0.561 |
|||
−3 |
1 607 592 |
8 620 733 |
9.61 |
9.59–9.63 |
5.36 |
5.36–5.37 |
0.515 |
0.514–0.517 |
|||
−2 |
1 397 957 |
6 379 674 |
8.80 |
8.78–8.82 |
4.56 |
4.56–4.57 |
0.402 |
0.401–0.403 |
|||
−1 |
1 599 299 |
8 137 543 |
9.61 |
9.59–9.63 |
5.09 |
5.08–5.09 |
0.489 |
0.488–0.490 |
|||
0 |
1 808 475 |
8 240 420 |
9.74 |
9.72–9.76 |
4.56 |
4.55–4.56 |
0.444 |
0.443–0.445 |
|||
1 |
1 669 266 |
9 344 267 |
11.70 |
11.68–11.72 |
5.60 |
5.59–5.60 |
0.655 |
0.654–0.656 |
|||
2 |
1 589 607 |
7 392 708 |
11.24 |
11.22–11.26 |
4.65 |
4.65–4.65 |
0.523 |
0.522–0.524 |
|||
3 |
1 802 719 |
8 606 921 |
12.24 |
12.22–12.26 |
4.77 |
4.77–4.78 |
0.584 |
0.583–0.585 |
|||
4 |
2 117 809 |
10 879 805 |
13.57 |
13.55–13.59 |
5.14 |
5.13–5.14 |
0.697 |
0.696–0.698 |
|||
5 |
2 229 175 |
10 199 483 |
16.05 |
16.03–16.08 |
4.58 |
4.57–4.58 |
0.734 |
0.733–0.736 |
|||
1999–2000 |
|||||||||||
−5 |
1 333 215 |
8 535 595 |
8.43 |
8.42–8.45 |
6.40 |
6.40–6.41 |
0.540 |
0.539–0.541 |
|||
−4 |
1 797 526 |
10 356 909 |
10.10 |
10.09–10.12 |
5.76 |
5.76–5.77 |
0.582 |
0.581–0.583 |
|||
−3 |
1 619 805 |
8 555 867 |
10.30 |
10.28–10.32 |
5.28 |
5.28–5.29 |
0.544 |
0.543–0.545 |
|||
−2 |
1 408 949 |
6 392 354 |
9.40 |
9.37–9.42 |
4.54 |
4.53–4.54 |
0.426 |
0.425–0.427 |
|||
−1 |
1 615 342 |
8 055 505 |
10.25 |
10.23–10.27 |
4.99 |
4.98–4.99 |
0.511 |
0.510–0.512 |
|||
0 |
1 827 619 |
8 137 883 |
10.32 |
10.30–10.34 |
4.45 |
4.45–4.46 |
0.460 |
0.459–0.461 |
|||
1 |
1 690 764 |
9 337 249 |
12.25 |
12.23–12.27 |
5.52 |
5.52–5.53 |
0.677 |
0.675–0.678 |
|||
2 |
1 616 038 |
7 302 833 |
11.79 |
11.77–11.82 |
4.52 |
4.52–4.52 |
0.533 |
0.532–0.534 |
|||
3 |
1 834 355 |
8 434 194 |
12.75 |
12.72–12.77 |
4.60 |
4.59–4.60 |
0.586 |
0.585–0.587 |
|||
4 |
2 156 598 |
10 808 451 |
14.10 |
14.08–14.12 |
5.01 |
5.01–5.01 |
0.707 |
0.706–0.708 |
|||
5 |
2 250 148 |
10 033 689 |
16.87 |
16.85–16.89 |
4.46 |
4.46–4.46 |
0.752 |
0.751–0.753 |
|||
* −5 represents the most disadvantaged and +5 represents the most advantaged SEIFA IRSD postcode group. | |||||||||||
2: Rate of consultations per person, by Socio-Economic Indexes for Areas, Index of Relative Socio-Economic Disadvantage (SEIFA IRSD) postcode group
(a) All consultations, 1999–2000 | (b) Long plus prolonged consultations, 1998–1999 and 1999–2000 |
3: Rate ratio for the rate of long plus prolonged consultations per person for the Socio-Economic Indexes for Areas (SEIFA) categories, adjusted for year
Rate ratio |
95% CI |
P |
|
SEIFA |
1.0383 |
1.0381–1.0384 |
< 0.001 |
Year (1999–2000 v 1998–99) |
1.0324 |
1.0316–1.0333 |
< 0.001 |
- John S Furler1
- Patty Chondros2
- Doris Y L Young3
- Elizabeth Harris4
- P Gawaine Powell Davies5
- Mark F Harris6
- 1 Department of General Practice, University of Melbourne, Carlton, VIC.
- 2 Centre for Health Equity Research, Training and Evaluation, South West Sydney Area Health Service, Liverpool, NSW.
- 3 School of Community Medicine, University of NSW, Sydney, NSW.
The project was supported by a grant from the General Practice Branch, Commonwealth Department of Health and Ageing. Data were provided by the General Practice Branch, Department of Health and Ageing. Thanks to Professor Brian McAvoy for comments on an early draft.
None identified.
- 1. Howie JG, Porter AM, Heaney DJ, Hopton JL. Long to short consultation ratio: a proxy measure of quality of care for general practice. Br J General Practice 1991; 41: 48-54.
- 2. Baker R. Development of a questionnaire to assess patients' satisfaction with consultations in general practice. Br J General Practice 1990; 40: 487-490.
- 3. Wilson A. Consultation length in general practice: a review. Br J General Practice 1991; 41: 119-122.
- 4. Bolton PG, Mira M, Roberts LJ, Usher HE. Is health care card status related to consultation time? [letter; comment]. Med J Aust 1998; 168: 527-528.
- 5. Howie JG, Heaney DJ, Maxwell M, et al. Quality at general practice consultations: cross sectional survey. BMJ 1999; 319: 738-743.
- 6. Freeman GK, Horder JP, Howie JG, et al. Evolving general practice consultation in Britain: issues of length and context. BMJ 2002; 324: 880-882.
- 7. National Health Strategy. Enough to make you sick: how income and environment affect health. Canberra: AGPS, 1992.
- 8. Glover JHK, Tennant S. A social health atlas of Australia. Adelaide: University of Adelaide; 1999.
- 9. Wiggers JH, Sanson-Fisher RW. Practitioner provision of preventive care in general practice consultations: association with patient education and occupational status. Soc Sci Med 1997; 44: 137-146.
- 10. Commonwealth Department of Health and Aged Care. Medicare benefits schedule, 1 November 2000, including 1 May and 1 July 2001 Supplements, 2000, 17.9.01. <http://www.health.gov.au/pubs/mbs/mbs6/default.htm>
- 11. Australian Bureau of Statistics. 1996 Census of population and housing: Socio-Economic Indexes for Areas. Canberra: ABS, 1996.
- 12. HealthWIZ: The national social health database. Canberra: Prometheus Information, 2000.
- 13. Australian Bureau of Statistics. Postal area and collection districts estimated resident populations 1998–9 and 1999–2000. Based on 1996 Census data. Canberra: ABS, 2002.
- 14. STATA Statistical Software. Version 7.0. College Station, Tx: STATA Corporation, 2001.
- 15. McCracken K. Into a SEIFA SES cul-de-sac. Aust N Z J Public Health 2001; 25: 305-306.
- 16. Martin CM, Attewell RG, Nisa M, et al. Characteristics of longer consultations in Australian general practice. Med J Aust 1997; 167: 76-79.
- 17. Saltman D, O'Dea N. General practice consultations: quality time? Med J Aust 1997; 171: 76.
- 18. Hart JT. The inverse care law. Lancet 1971; 1: 405-412.
Abstract
Objective: To compare the rate of provision of longer consultations per head of population across practice locations categorised by socioeconomic status.
Design: Retrospective analysis of Medicare data for all consultations for all general practitioners in Australia for the 1998–99 and 1999–2000 financial years, grouped by postcode of practice location. Postcodes were categorised by the Socio-Economic Indexes for Areas, Index of Relative Socio-Economic Disadvantage score.
Main outcome measures: Number of consultations and number of brief, standard, long and prolonged consultations per capita in each postcode grouping.
Results: The absolute number of long plus prolonged consultations showed no trend across postcode groups, but the rate ratio per person was significantly higher in more advantaged postcode areas. This represents an example of care provision in inverse relationship to need.
Discussion: Despite higher rates of chronic disease and lower rates of preventive care uptake, patients in low socioeconomic status areas receive longer GP consultations at a lower rate than patients in more advantaged areas. Possible strategies to overcome this inverse care provision include increased numbers of GPs in disadvantaged communities, removal of financial disincentives to longer consultations, and strengthening health promotion and community health services in disadvantaged areas.