


The recent Australian Diabetes, Obesity and Lifestyle Study (AusDiab) found that 7.5% of the Australian population aged 25 years or older had type 2 diabetes, and that for every person diagnosed with diabetes mellitus there is another with undiagnosed diabetes.1 Early diagnosis is recognised as a key to reducing the impact of the disease, including the risk of micro- and macrovascular complications.2 Most people with undiagnosed diabetes have recognisable risk factors,3 and over 90% visit doctors (mainly general practitioners) each year.4 Australian GPs therefore have the opportunity to identify many of the estimated 300 000–500 000 Australians with undiagnosed diabetes.1
Recommended diagnostic criteria for diabetes now differ across international associations and organisations, with the American Diabetes Association (ADA) and World Health Organization (WHO) publishing new criteria in 1997 and 1999, respectively5,6 (Box 1). The American association recommends that a fasting plasma glucose (PG) test is preferable for diagnosis, while WHO recommends ideally using both the fasting PG level and 2 h PG level in an oral glucose tolerance test (OGTT).
In Australia, there has been support for continued use of the OGTT.7 Both the Australian Diabetes Society (ADS) and the Diabetes Australia Guideline Development Consortium advocate a two-step screening strategy,8,9 which involves screening people with symptoms or risk factors with a laboratory glucose measurement, preferably a fasting test, followed by a full OGTT if fasting PG values fall in the range 5.5–6.9 mmol/L. The Australian (ADS) strategy has been modified to include the lower diagnostic fasting glucose levels recommended by the American association.2,8 The American and Australian associations and WHO all emphasise the need for a second, confirmatory test in the absence of typical symptoms, such as thirst, polyuria, genital thrush and weight loss, before making a clinical diagnosis.
To evaluate these different approaches to diagnosing diabetes, we have examined their effect on the estimated prevalence of diabetes in a large Australian general practice population, using the WHO criteria (OGTT) as the gold standard for comparison.10
The study used data obtained by the Australian Diabetes Screening Study, which was undertaken between 1 December 1994 and 30 June 1995.11 It involved a survey of 50 859 patients attending 535 general practices from all Australian States to identify patients with no previous diagnosis of diabetes who were aged 40 years or over and had two or more symptoms (thirst, polyuria, weight loss, skin infections or genital thrush) or two or more risk factors for diabetes (defined as overweight, hypertension, family history of diabetes, or age over 50 years). Patients who met these criteria had a random PG measurement and, if the result was > 5.5 mmol/L, an OGTT (fasting and 2 h post-glucose PG measurement). The current study analysed results of all patients who underwent an OGTT and had complete data available.
The level of agreement in diabetes diagnoses between the three sets of criteria was evaluated by pairwise comparisons using the κ statistic (κ ≥ 0.75, excellent agreement; κ = 0.4–0.74, fair to good; and κ < 0.4, poor).12 Characteristics of patients with concordant diagnoses (diagnosed consistently by all sets of criteria) and discordant diagnoses (diagnosed with diabetes only by Australian or WHO criteria) were compared using contingency table analysis and χ2 statistics.12,13 To control for confounding and interaction, this analysis was stratified by the most significant characteristic or risk factor.
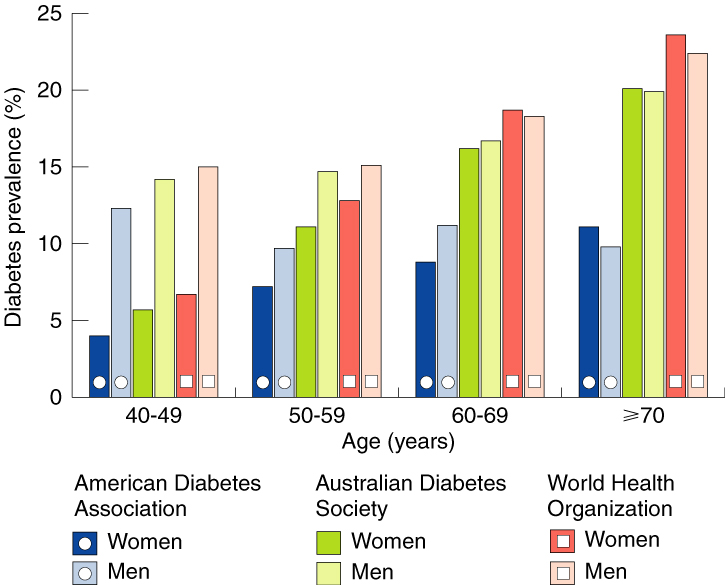
Prevalence of diabetes in this group using the three sets of diagnostic criteria is shown in Box 2, and differentiated by age and sex in Box 3. Overall prevalence increased with age using all three sets of criteria, as did prevalence in each sex, except in men using the American criteria. WHO criteria identified a greater proportion of people with diabetes than the other two sets of criteria in all age groups, particularly in the oldest group (≥70 years), and particularly compared with the American criteria.
Distribution of fasting and 2 h PG results is shown in Box 4, along with resulting diagnoses. Most patients were diagnosed consistently by the three sets of criteria: 555 (9.4%) with diabetes and 4843 (82%) without diabetes. However, the WHO criteria diagnosed an extra 513 patients (8.7%) with diabetes compared with the American criteria (comprising people with fasting PG levels < 7.0 mmol/L but 2 h post-glucose levels ≥ 11.1 mmol/L). If the 2 h post-glucose test had been performed only in those with fasting PG level in the range 5.5–6.9 mmol/L (as recommended in the Australian strategy), then 390 of these 513 patients (76%) would have been detected. Thus, the Australian strategy would have diagnosed a total of 945 people with diabetes (88% of the total diagnosed by the WHO criteria).
Box 5 shows the percentages of patients with particular demographic characteristics, symptoms and risk factors among those with concordant and discordant diagnoses. Patients diagnosed with diabetes based on fasting PG (common to all three sets of criteria, giving a concordant diagnosis) were more likely to be men than those diagnosed based on post-challenge hyperglycaemia alone (used only by Australian and WHO criteria, giving a discordant diagnosis) or those without diabetes. Re-analysis after age-group stratification to control for confounding and interaction confirmed this trend for the 40–49- and 50–59-years age groups. Conversely, people diagnosed on the basis of post-challenge hyperglycaemia (discordant diagnosis) were more likely to be aged 70 years or over than those diagnosed by fasting PG (concordant diagnosis). Symptoms of diabetes were poor discriminators for diagnosis of diabetes.
In this study, the WHO criteria (the gold standard) diagnosed almost twice as many people with diabetes as the American (ADA) criteria, consistent with previous findings.14 People with isolated post-challenge hyperglycaemia who were not detected by the American criteria have a high risk of microvascular complications and cardiovascular disease.15,16 The Australian (ADS) stepwise screening strategy detected 88% of those who met the WHO criteria for diabetes, including about three-quarters of those with isolated post-challenge hyperglycaemia.
Our analysis of the outcome of the Australian strategy was limited by the fact that this strategy involves a fasting PG test followed by a full OGTT (comprising a second fasting PG and 2 h post-glucose PG test), while our study involved only one fasting PG test, as part of the OGTT. This also meant that we could not evaluate patient attrition between a first fasting PG test and follow-up OGTT, estimated at 21.5%.17 In addition, our analysis included only people with random PG levels > 5.5 mmol/L, while current Australian (ADS) guidelines recommend diabetes testing, preferably by a fasting PG test, in all people with risk factors.9 Consequently, we may have underestimated diabetes prevalence using all three sets of criteria. However, we believe any effect would have been minimal, as diabetes is unlikely in people with random PG level < 5.5 mmol/L.2 In addition, our estimates of diabetes prevalence were probably slightly higher than if PG testing had been repeated, as recommended before a clinical diagnosis of diabetes is made.2,6
We found that, in the 40–59 years age group, people identified with diabetes by the criterion of fasting PG > 7.0 mmol/L (common to all sets of diagnostic criteria) were more likely to be male than those identified by the WHO criterion of isolated post-challenge hyperglycaemia. Sex differences in metabolic response to fasting have been noted by others, with men having higher fasting glucose values than women,18 and it has been suggested this may represent a systematic bias.19 We also found that people identified with diabetes by isolated post-challenge hyperglycaemia were more likely to be aged 70 years or over than those identified by fasting PG level, and less likely to be in the 40–59-years age group. Previous research has found that fasting PG level, unlike 2 h post-glucose PG level, does not increase with age,20 indicating either that fasting PG is more stable or that its sensitivity in diagnosing diabetes decreases with age.
1: Diagnostic criteria for diabetes mellitus recommended by WHO (1999)4 and ADA (1997)6 for epidemiological or population screening
2: Prevalence estimates for undiagnosed diabetes among 5911 high-risk people according to different diagnostic criteria
4: Distribution of fasting and 2 h plasma glucose (PG) results in 5911 people with high risk of diabetes
5: Percentage of patients with demographic characteristics, symptoms and risk factors among those with concordant and discordant diagnoses by the three sets of criteria
- Deborah J Hilton1
- Christopher M Reid2
- Peter K O'Rourke3
- Timothy A Welborn4
- 1 CVD Prevention Unit, Baker Medical Research Institute, Melbourne, VIC.
- 2 Queensland Centre for Public Health, University of Queensland, Brisbane, QLD.
- 3 Department of Endocrinology and Diabetes, Sir Charles Gairdner Hospital, Perth, WA.
We acknowledge the assistance of Gerarda Marriott (Servier Laboratories (Australia) Pty Ltd) and all the general practitioners and patients involved in the study. The Australian Diabetes Screening Study (1994–1995) was supported by Servier Laboratories (Australia) Pty Ltd.
- 1. Dunstan D, Zimmet P, Welborn T, et al on behalf of the AusDiab Steering Committee. Diabesity and associated disorders in Australia 2000. The accelerating epidemic Australian diabetes, obesity and lifestyle report. Melbourne: International Diabetes Institute, 2000.
- 2. Colagiuri S, Colagiuri R, Ward J. National diabetes strategy and implementation plan. Canberra: Diabetes Australia, 1998.
- 3. Cowie CC, Harris MI, Eberhardt MS. Frequency and determinants of screening for diabetes in the US. Diabetes Care 1994; 17: 1158-1163.
- 4. Australian Bureau of Statistics. National health survey 1995: diabetes. Canberra: Australian Bureau of Statistics, 1997. (Catalogue No. 4371.0.)
- 5. Report of the Expert Committee on the Diagnosis and Classification of Diabetes Mellitus. Diabetes Care 1997; 20: 1183-1197.
- 6. World Health Organization. Definition, diagnosis and classification of diabetes mellitus and its complications. Report of a WHO Consultation. Part 1: Diagnosis and classification of diabetes mellitus. Geneva: Department of Noncommunicable Disease Surveillance, 1999. WHO/NCD/NCS/99.2.
- 7. Colman PG, Thomas DW, Zimmet PZ, et al. New classification and criteria for diagnosis of diabetes mellitus. Position statement from the Australian Diabetes Society, New Zealand Society for the Study of Diabetes, Royal College of Pathologists of Australasia and Australasian Association of Clinical Biochemists. Med J Aust 1999; 170: 375-378.
- 8. Australian Diabetes Society. Position statement. Screening for non-insulin dependent diabetes. Sydney: Australian Diabetes Society, 1996.
- 9. The Australian Centre for Diabetes Strategies, Prince of Wales Hospital, Sydney for the Diabetes Australia Guideline Development Consortium. Revised draft. National evidence based guidelines for the management of type 2 diabetes mellitus. Part 3. Evidence based guideline for case detection and diagnosis of type 2 diabetes. Canberra: Commonwealth Department of Health and Aged Care, 30 Nov 2000.
- 10. Harris MI, Eastman RC. Early detection of undiagnosed non-insulin-dependent diabetes mellitus. JAMA 1996; 276: 1261-1262.
- 11. Welborn TA, Reid CM, Marriott G. Australian Diabetes Screening Study: impaired glucose tolerance and non-insulin-dependent diabetes mellitus. Metabolism 1997; 46 Suppl 1: 35-39.
- 12. Armitage P, Berry G. Statistical methods in medical research. 3rd ed. Oxford: Blackwell Scientific Publications, 1994.
- 13. Hilton DJ. Impact of a change in the diagnostic criteria for the classification of diabetes. An analysis of a cohort from the Australian Diabetes Screening Study [dissertation]. Brisbane: University of Queensland, 2000.
- 14. Puavilai G, Chanprasertyotin S, Sriphrapradaeng A. Diagnostic criteria for diabetes mellitus and other categories of glucose intolerance: 1997 criteria by the Expert Committee on the Diagnosis and Classification of Diagnosis Mellitus (ADA), 1998 WHO Consultation criteria, and 1985 WHO criteria. Diabetes Res Clin Pract 1999; 44: 21-26.
- 15. Shaw JE, Hodge AM, de Courten M, et al. Isolated post-challenge hyperglycaemia confirmed as a risk factor for mortality. Diabetologia 1999; 42: 1050-1054.
- 16. The Decode Study Group, on behalf of the European Diabetes Epidemiology Group. Glucose tolerance and cardiovascular mortality: comparison of fasting and 2-hour diagnostic criteria. Arch Intern Med 2001; 161: 397-405.
- 17. Li CL, Tsai ST, Chou P. Comparison of the results between two diagnostic criteria by ADA and WHO among subjects with FPG 5.6-7.8 mmol/l in Kin-Hu and Kin-Chen, Kinmen, 1991-94. Diabetes Res Clin Pract 1999; 45: 51-59.
- 18. Pomerleau J, McKeigue PM, Chaturvedi N. Relationships of fasting and postload glucose levels to sex and alcohol consumption. Are American Diabetes Association criteria biased against detection of diabetes in women? Diabetes Care 1999; 22: 430-433.
- 19. The DECODE Study Group, the European Diabetes Epidemiology Group. Will new diagnostic criteria for diabetes mellitus change phenotype of patients with diabetes? Reanalysis of European epidemiological data. BMJ 1998; 317: 371-375.
- 20. Blunt BA, Barrett-Connor E, Wingard DL. Evaluation of fasting plasma glucose as screening test for NIDDM in older adults. Rancho Bernardo Study. Diabetes Care 1991; 14: 989-993.
Abstract
Objectives: To study the influence of different diagnostic criteria on the prevalence of diabetes mellitus and characteristics of those diagnosed.
Design and setting: Retrospective analysis of data from the general-practice-based Australian Diabetes Screening Study (January 1994 to June 1995).
Participants: 5911 people with no previous diagnosis of diabetes, two or more symptoms or risk factors for diabetes, a random venous plasma glucose (PG) level > 5.5 mmol/L and a subsequent oral glucose tolerance test (OGTT) result.
Main outcome measure: Prevalence of undiagnosed diabetes based on each of three sets of criteria: 1997 criteria of the American Diabetes Association (ADA), 1996 two-step screening strategy of the Australian Diabetes Society (ADS) (modified according to ADA recommendations about lowered diagnostic fasting PG level), and 1999 definition of the World Health Organization (WHO).
Results: Prevalence estimates for undiagnosed diabetes using the American (ADA), Australian (ADS) and WHO criteria (95% CI) were 9.4% (8.7%–10.1%), 16.0% (15.3%–16.7%) and 18.1% (17.1%–19.1%), respectively. People diagnosed with diabetes by fasting PG level (common to all sets of criteria) were more likely to be male and younger than those diagnosed only by 2 h glucose challenge PG level (Australian and WHO criteria only). The Australian (ADS) stepwise screening strategy detected 88% of those who met the WHO criteria for diabetes, including about three-quarters of those with isolated post-challenge hyperglycaemia.
Conclusion: The WHO criteria (which include an OGTT result) are preferable to the American (ADA) criteria (which rely totally on fasting PG level), as the latter underestimated the prevalence of undiagnosed diabetes by almost a half. The Australian (ADS) strategy identified most of those diagnosed with diabetes by WHO criteria.