


The natural environments in which we live play a major role in our health and wellbeing and include the important roles of weather and climate. The depth and breadth of this connection with our health in Australia continues to be the subject of new research.1,2,3 Climate change is a leading issue of our times, and Australia is especially sensitive to this change. Indeed, the CSIRO has recently reiterated that climate change and the environment is one of six major challenges facing the nation.4 In September 2019 the Australian Medical Association recognised climate change as a health emergency.5 With the enormity of the threat to health from climate change being well established, the challenge is to embrace the opportunity to reduce or avoid this threat through proactive adaptation and mitigation. However, there continues to be much we do not know about the potential impacts of climate change on health in Australia, and this heightens our underlying vulnerability and weakens our ability to act effectively.
The Lancet Countdown, a multi‐institutional collaboration spearheaded by University College London, examines progress on climate change and human health at a global scale. Its first two assessments were published in 20176 and 2018,7 and annual assessments will continue until 2030, consistent with the near‐term timeline of the Paris Agreement.
In partnership with The Lancet, University College London and the MJA, Australia was the first and only country to produce its own national Countdown assessment report in 2018.8,9,10 That report found that, overall, Australia is vulnerable to the impacts of climate change on health, and that policy inaction in this regard threatens Australian lives.10 The current report presents our first annual update of this assessment tracking Australia's engagement with and progress on this vitally important issue.
Methods
We track progress on health and climate change in Australia across 31 indicators divided into five broad sections: climate change impacts, exposures and vulnerability; adaptation, planning and resilience for health; mitigation actions and health co‐benefits; finance and economics; and public and political engagement. Where possible, we adopt the methods used by the Lancet Countdown, including those used in its current report.11 Where more appropriate for an Australia‐focused assessment, or where it was possible to refine or improve on the original method as more precise and comprehensive data or methods were available at the national level, the method for the Australian indicators was modified or an alternative method was employed.
Consistent with developments in the Lancet Countdown,7,11 three new indicators are introduced this year: 1.1 Vulnerability to the heat‐related risks of climate change, 1.6 Wildfire exposure, and 5.4 Engagement in health and climate change in Australian corporate sector. Similarly, 13 of the previously reported indicators10 are not included this year, either due to their discontinuation by the Lancet Countdown or because insufficient new data were available to provide an update to the indicator.
Details of our methods, data and caveats are provided for each indicator in the Supporting Information. We also provide a brief summary of the method within the text for each indicator here. Our final list of 31 indicators is provided in Box 1, including mapping to the equivalent indicator numbers from our previous report.10
Section 1: Climate change impacts, exposures and vulnerability
Last year, we presented ten indicators of climate change impacts, exposures and vulnerability. We are here presenting our first updates for four of these: exposure to temperature change (previously “health effects of temperature change”; we have changed the title of this indicator to better reflect its purpose); health effects of heatwaves; change in labour capacity; and mental health. This year, we also present two new indicators: “vulnerability to the heat‐related risks of climate change” and “wildfire exposure”. Finally, we present an introduction to the topic of climate change and health attribution (Box 2).
We are not presenting updates for six indicators this year, including “lethality of weather‐related disasters” and “climate‐sensitive infectious diseases”. Our indicator “trends in overall burden of climate‐sensitive diseases” was reported for the years 1990–2016 last year. Rather than reporting annual numbers, which vary considerably, we propose reporting this indicator every second year to allow trends to emerge. Food insecurity and malnutrition remain significant yet under‐addressed problems in Australia, particularly in rural, remote and low income locations.15,16 However, as Australia does not collect consistent data on the prevalence of food insecurity or on malnutrition, we cannot yet include a food insecurity indicator in this report. For that reason, we do not present indicators for food insecurity and malnutrition. Finally, due to insufficient data, we do not include migration and population displacement as an indicator this year; however, we do discuss this important issue in Box 3.
1.1. Vulnerability to the heat‐related risks of climate change
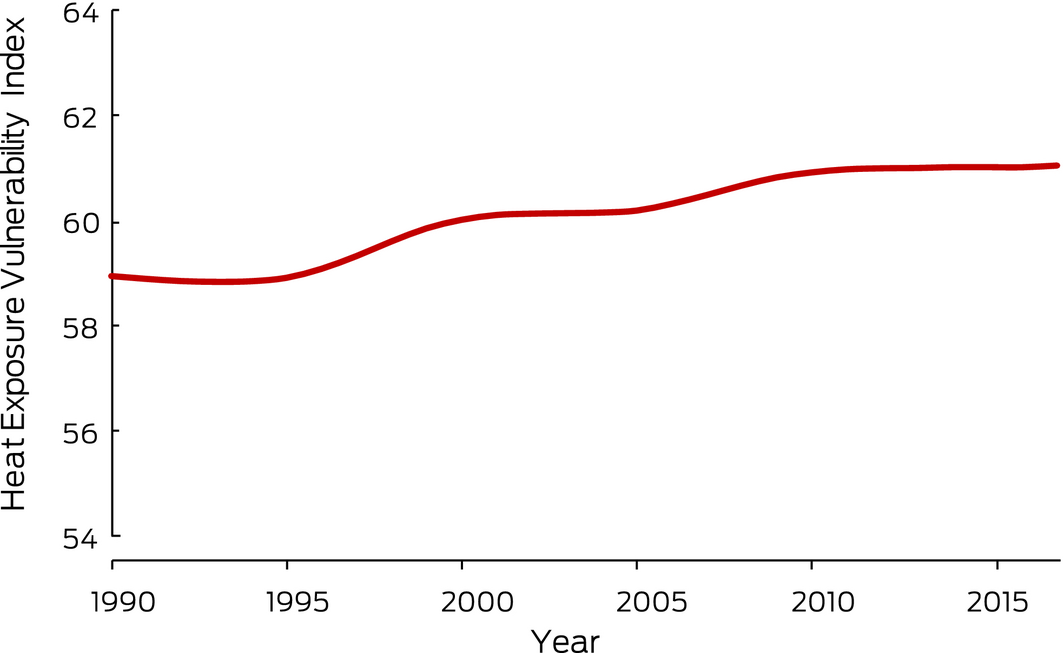
Adults aged over 65 years and people with underlying cardiovascular diseases, diabetes and chronic respiratory diseases are particularly vulnerable to heat‐related morbidity and mortality.7 The urban heat island (the tendency for urban areas to be warmer than surrounding rural areas), combined with increasing temperatures resulting from climate change, also puts those living in urban areas at greater risk of heat‐related disease. Australia is one of the world's most urbanised countries, with almost 90% of people living in urban areas. This indicator reports the Heat Exposure Vulnerability Index, a measure of potential vulnerability of a country to heat exposure. It is based on the proportion of the population aged over 65 years, the prevalence of the above underlying diseases in this subpopulation, and the proportion of the population living in urban areas (Supporting Information). The Heat Exposure Vulnerability Index for Australia for 1990–2017 is high and shows an upward trend (Box 4). The impact of this trend will be felt throughout the already stretched public health system in Australia, with numbers of heat‐related hospital presentations increasing more quickly among those living with the greatest vulnerability and disadvantage than among other groups. Impacts will continue to rise because of the general rise in ambient temperatures and will be especially large during and shortly after heatwave events.
1.2. Exposure to temperature change
Summer maximum temperatures are expected to rise as a result of global warming. Box 5 shows nationally averaged Australian summer (December–February) maximum temperature anomalies (ie, departures from the long term average) for the past 20 summers, 1999–2000 to 2018–19, relative to a 30‐year baseline period of 1981–2010. An ordinary least squares linear regression analysis calculated for the nationally averaged Australian summer maximum temperature anomalies over the past 50 summers (1969–70 to 2018–19), relative to the same 30‐year baseline period, shows that summer maximum temperatures have risen by around 0.43°C over the past 20 years. The summer maximum temperature rise calculated from regression analysis over the past 20 years is much larger (1.66°C). While this figure is not indicative of the longer term trend, it suggests the rate of increase may be getting larger in more recent years. Details of the data and methods used for this indicator are provided in the Supporting Information.
1.3. Health effects of heatwaves
The excess heat factor is a measure of heatwave intensity as it applies to human health impacts.21,22 It is based on 3‐day‐averaged daily mean temperatures. Box 6 shows the Australian averaged accumulated heatwave season (November to March) excess heat factor for the past 20 heatwave seasons (1999–2000 to 2018–19). An ordinary least squares linear regression analysis calculated over the past 50 heatwave seasons (1969–70 to 2018–19) shows that this indicator has risen by about 31 K2 (around 33%) over the past 20 years. The reasons for using the longer period in the trend calculation are the same as those mentioned above for summer maximum temperature: the calculation over the past 20 heatwave seasons (a rise of 81 K2 or 113%) is not indicative of the longer term change.
1.4. Change in labour capacity
Exposure to heat during work can reduce labour capacity and result in decreased productivity. Recent Australian research investigating the relationship between self‐reported heat stress and subjective wellbeing showed that many people thought that heat compromised their productivity.23 Last year, we reported on the combined effects of temperature and humidity on hours of labour lost, captured in what is referred to as the wet bulb globe temperature. This year, we calculated annual total hours of labour lost due to heat in the agriculture, industry and service sectors in Australia from 2000 to 2018 using an indicator that also includes the impact of sunlight on work hours lost (Box 7). In 2018, there were fewer hours of labour lost due to heat (just over 1.35 million) than in 2017 (just over 3.34 million). This continues the significant inter‐annual variability in this indicator that we highlighted last year. However, hours of labour lost due to heat in the service sector rose from 5579 hours in 2017 to 15 409 hours in 2018. Overall, from 2000 to 2018, annual total hours of labour lost due to heat have been increasing and this continues to be of concern.
1.5. Mental health
Data for this indicator were obtained from the Australian Bureau of Statistics and the Australian Bureau of Meteorology. Details of the data and methods used are provided in the Supporting Information. Last year, we presented baseline data (2007–2016) showing that higher mean annual maximum temperatures predicted elevated age‐adjusted suicide rates in warmer jurisdictions, while the inverse (less‐hot years) predicted elevated suicide rates in cooler jurisdictions (Box 8 and Supporting Information, Figure A2). This finding was replicated this year and a similar pattern was observed for the available year of post‐baseline data (2017). There are many factors affecting suicide rates and we cannot and do not attempt to explain the association between hot years and suicide. However, this year's updated indicator does reinforce the need to examine the role that warming may play in accounting for suicide rates nationally and by jurisdiction.
This year, we also examined the association between mean annual minimum temperatures and suicide, finding that higher minimum temperatures (ie, less‐cold years) were associated with elevated suicide rates in warmer and cooler jurisdictions. Thus, except for less‐hot years in cooler jurisdictions, higher annual mean maximum and minimum temperatures were associated with elevated suicide rates. Finally, we again found that the association between annual mean maximum temperatures and suicide was gendered. Men completed suicide more often than did women, and male suicide rates increased faster with increasing heat.
We note that this indicator is in early development and can be improved to take account of additional factors. Future refinements will consider known correlates of suicide, such as the social determinants of mental health, as well as jurisdictional and subjurisdictional factors. These subnational factors will target conditions which related to the suicide rates and which vary from one jurisdiction to another, such as local socio‐economic and demographic characteristics and jurisdiction‐level political factors. The refined indicator will also account for local underlying climates. As we have this year, for future reports we will recalculate our indicator for the baseline and for subsequent years to reflect improved modelling.
1.6. Wildfire exposure
Fires are an integral process that occurs in all vegetated landscapes. Fire regimes are shaped by many factors including weather, climate, land use, ignition sources and land management activities. Climate change is causing fire seasons to start earlier and finish later;24,25 and anomalous meteorological conditions have been linked to a trend towards more extreme fire events.26 Compared with smaller, shorter and less severe fire events, extreme fire events are more likely to cause disasters with substantial social and economic harms from the loss of life, livelihoods, property and infrastructure.26,27,28 Further, increases in landscape fire activity overall, including severe events, will increase air pollution, further harming health.29 Climate change‐related increases in landscape fire smoke emissions may offset health gains from reducing pollution emissions from other sources.30,31 For example, it has been estimated that premature mortality associated with wildfire smoke will double in the United States by 2100.30 Similar projections have not been performed in Australia. However, 197 deaths attributable to landscape fire smoke were estimated for Sydney from 2001 to 2013,32 while five direct fire‐related deaths were reported during the same period.33 While fire disasters and serious smoke impacts in Australia appear to be escalating in line with global trends, we lack the systematic ongoing data collection and reporting needed for Australia.
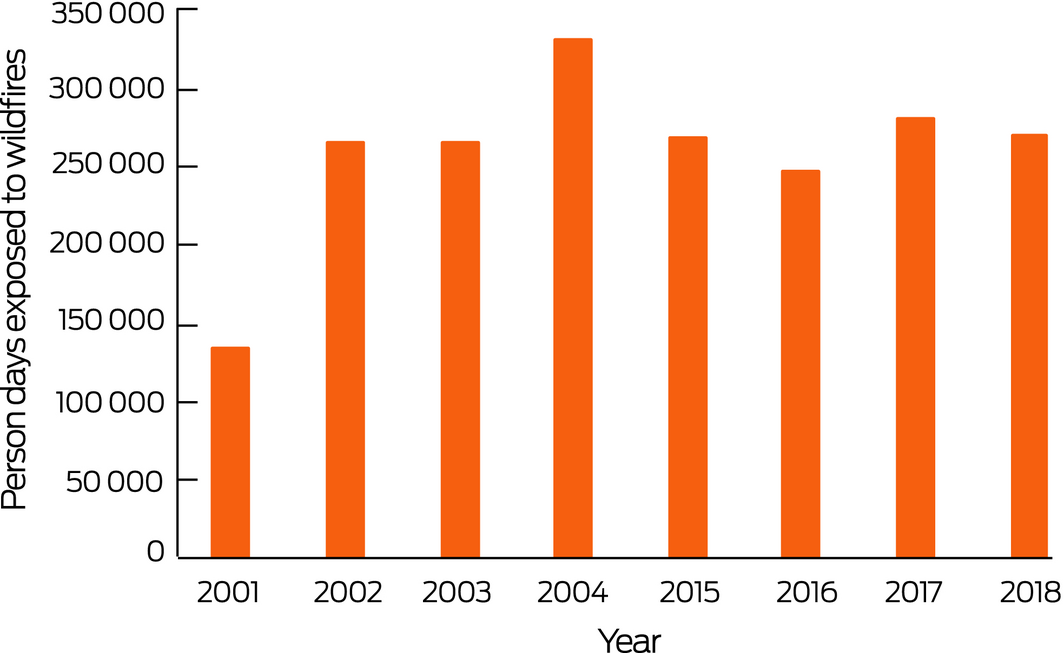
To be consistent with the approach used in the global Lancet Countdown report, we adopted the methods used by Watts and colleagues:11 the number of days people were exposed to wildfire during a 4‐year baseline period (2001–2004) compared with the most recent 4 years (2015–2018) (Box 9). The indicator uses the Collection 6 active fire product from the moderate resolution imaging spectroradiometer aboard the NASA Terra and Aqua satellites, and population count per square kilometre.11 While the 4‐year average of 266 744 was only slightly higher in the more recent period, compared with 249 397 in 2001–2004, this represents substantial adverse exposure in both periods. It also misses some of Australia's worst wildfires because these occurred in 2007–2009. A major confounding factor in identifying trends in fire activity in Australia is the very significant inter‐annual variability due to factors including the El Niño–Southern Oscillation cycle and other inter‐annual climate drivers including the Indian Ocean Dipole and the Southern Annular Mode.34,35
Conclusion: climate change impacts, exposures and vulnerability
Increases in heat continue to present as a leading source of climate change‐related health risk in Australia. This trend is likely to continue and, despite uncertainties created by the large variability in daily and seasonal temperatures, there has been a striking upward trend in the rate of increase in maximum temperatures over the past two decades. Large increases in heatwave intensity are also evident over the same period, with consequent risks for health, particularly among people experiencing underlying vulnerability and disadvantage. While hours of labour lost due to heat in 2018 were far fewer than they were in 2017, hours lost in the service sector substantially increased last year. Additionally, hot years, in terms of both maximum and minimum annual temperatures, continued to be associated with higher suicide rates. We find little evidence to suggest that Australia is acting effectively to mitigate these multiple heat‐related risks for physical and mental health (Supporting Information, Table A1). This is particularly concerning in the context of a growing and ageing population.
Progress in developing our impact indicators continues to be hampered by inadequate data availability. We do not have reliable data for Australia on weather‐related temporary or permanent displacement and migration, or on food insecurity or malnutrition, although these are climate change‐sensitive and already affect many Australians, particularly those living with underlying vulnerabilities.
Section 2: Adaptation, planning and resilience for health
Most of the indicators on adaptation, planning and resilience that were used in 2018 have been updated for this year, with the exceptions of “Health adaptation funding from Australian climate financing mechanisms” and “Climate‐resilient health infrastructure”, which have not been included this year. Two new topics have been introduced — “Climate change adaptation to vulnerabilities from mosquito‐borne diseases” and “Inclusion of health and climate change within medical curricula” (Box 10 and Box 11) — and these warrant more detailed exploration in future iterations of this report.
Of particular relevance to this section is that three Australian cities have recently declared a climate emergency — Canberra in May 2019 and Hobart and Sydney in June 2019 — following similar declarations by cities overseas. These declarations recognise the need for urgent climate action, and both Canberra and Sydney are already at the forefront of climate adaptation action.
2.1. Australian adaptation plans for health
There are no new climate change and health adaptation plans for Australia as a whole, and Queensland is still the only state to have produced a comprehensive standalone health adaptation plan.41 All other states and territories, and Australia as a whole, have a broad‐ranging adaptation plan or strategy in which health receives only a mention as a sector of note and requiring attention. However, some progress is being made. Tasmania is in the process of developing its health adaptation strategy, having convened an expert climate and health roundtable in April 2019. In March 2019, Western Australia announced an inquiry into the impacts of climate change on health in Western Australia, to be conducted under the Public Health Act 2016. A final report will be presented to the WA Minister for Health by March 2020. The Climate and Health Alliance has produced a Framework for a National Strategy on Climate, Health and Well‐Being for Australia42 based on expert and stakeholder consultation. This would be helpful should the Australian Government choose to develop a comprehensive national plan for climate change and health.
2.2. City‐level climate change risk assessments
No new climate change risk assessments were found for Australia's capital cities. Local, more grassroots action remains the principal domain of activity in climate adaptation and mitigation, with 99 local councils now signed up to the Cities Power Partnership, a free, non‐profit support and networking initiative to facilitate local renewable energy projects (Box 12). With the exception of the Australian Capital Territory (which only has one local government area), New South Wales still has the highest proportion of its councils participating in the Partnership, increasing from 58.5% to 66.2% of councils (Box 13). South Australia still has the lowest participation rate, at 8%, but this has increased fivefold since 2018. Participation in the Northern Territory and Tasmania remains unchanged from 2018.
2.3. Detection, preparedness and response to health emergencies
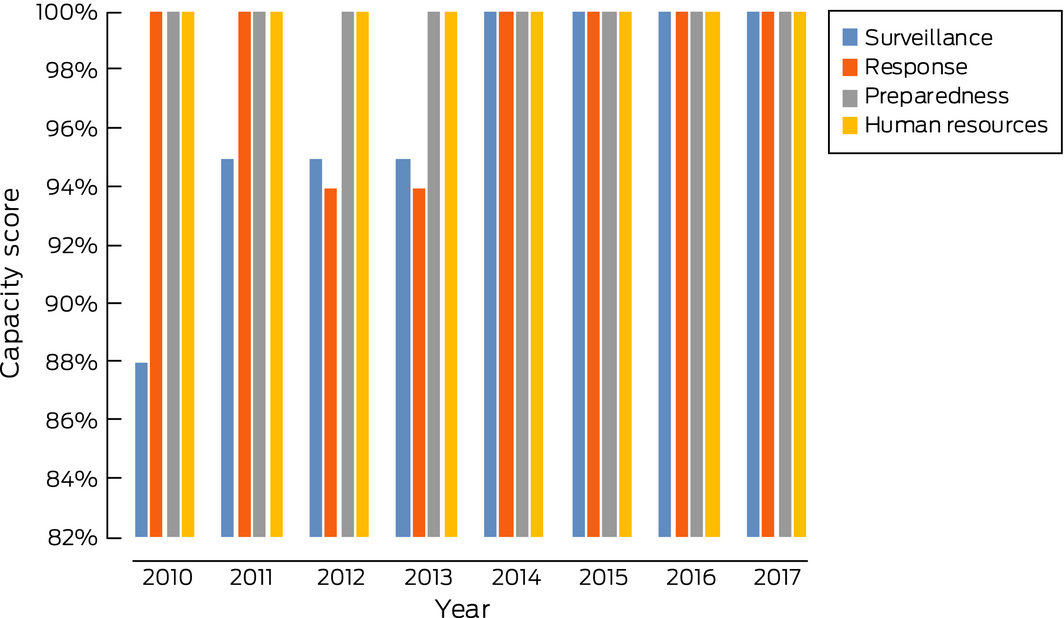
This indicator tracks Australia's International Health Regulations capacities relevant to climate adaptation and resilience, as reported in the World Health Organization's Global Health Observatory data repository (http://apps.who.int/gho/tableau-public/tpc-frame.jsp?id=1100). In 2017, the most recent year available, Australia maintained its average value of 100% for the 13 core capacity indicators. Similarly, surveillance, response, preparedness and human resources capacities were scored at 100% (Box 14). While this is an excellent result for Australia, we note that two of these capacities have not consistently scored at this level over the period 2010 to 2017, with Australia's surveillance capacity score being as low as 88% in 2010, and its response capacity score decreasing from 100% in 2010 and 2011 to 94% in 2012 and 2013. It is therefore important that Australia actively works to maintain its current excellent capacities in these important areas.
2.4. Climate information services for health
The Australian Bureau of Meteorology continues to provide routine forecasts to the health sector and public for ultraviolet radiation and heatwaves through its website, mobile app, and other channels. Web traffic to the heatwave website (http://www.bom.gov.au/australia/heatwave) was measured during the period 11 October 2018 to 17 April 2019 (the operational heatwave season) using Google Analytics. The heatwave site was the tenth most viewed page on the Bureau website. Unique page views for that period were 226 911 for the main heatwave page, with people spending an average time of 2:52 minutes on the page. This was more than two‐and‐a‐half times the number of unique page views measured during the previous operational heatwave season (87 663 views during 20 October 2017 to 30 April 2018). Due in part to the trend to earlier starts to heatwaves, the Bureau has advanced its operational start to the heatwave season in recent years (as indicated above), with the operational start for the 2019–20 season starting even earlier, on 1 October 2019.
As for 2017, the pilot thunderstorm asthma early warning service led by the Bureau of Meteorology and the Victorian Department of Health and Human Services provided daily 3‐day forecasts of thunderstorm asthma risk in Victoria during the 2018 grass pollen season, October–December.
2.5. National assessments of climate change impacts, vulnerability and adaptation for health
Australia's 2008 Garnaut climate change review43 remains the federal government's only national assessment of climate change impacts, vulnerability and adaptation, and it was mainly focused on economic indicators with health included as a sectoral component. The crowd‐funded not‐for‐profit Climate Council continues to produce reports of national significance in this area, including a major 2018 report44 which provides evidence for the impacts climate change is already having on Australia's water cycle, with significant implications for human health. Other new reports of significance to health include one on extreme weather in Australia,45 and an interim report ahead of a forthcoming major report on the increasing threat of bushfires in Queensland.46 The reports continue to recommend deep cuts to greenhouse gas emissions to avoid the worst impacts of climate change.
Conclusion: adaptation, planning and resilience for health
In the absence of coherent, meaningful policy at national level, states, territories, cities and local councils continue to take the lead in Australia on climate adaptation strategy and activities. While Australia's Bureau of Meteorology plays a role in disseminating information on forecasting climate‐related health events (heat stress and thunderstorm asthma), this is not explicitly linked to a broader national climate change and health policy. Overall, very little has changed in Australia's adaptation space since the baseline 2018 report. An update on these indicators was included this year to highlight that inaction on climate adaptation risks serious damage to infrastructure and people's health and will be increasingly financially costly without leadership in adaptation planning and implementation.
Section 3: Mitigation actions and health co‐benefits
Updated data available in 2019 show that, since last year's report, Australia has seen some slight progress in lowering the carbon intensity of the Australian energy system and in phasing out coal and shifting towards lower carbon and renewable sources (Box 15). However, Australia lags well behind other developed countries in its shift towards renewable energy.
3.1. Carbon intensity of the energy system
As for last year, we define the carbon intensity of the energy system as “the tonnes of CO2 emitted for each unit of primary energy supplied”.10 Data for our previous report10 were only available up to 2012. This year, new data have become available47 up to 2016 (Box 16) and show relatively little change since 2012. The carbon intensity of Australia's total primary energy supply continues to be the highest of the developed countries presented, with China only in recent years (2010–2016) reporting values slightly higher than Australia.
3.2. Coal phase‐out
According to data provided by the International Energy Agency,48 world coal production was in decline in 2015 and 2016. However, new reports49 confirm a rise in 2017 and 2018 to 7585 Mt because of global economic growth and because some large developing nations (Indonesia, India) increased the share of coal in their energy mix. The latest available data for world coal production from 2016 show that coal accounted for 27% of the world total energy supply that year, second behind oil, which accounted for 32% (2017 and 2018 data not available at the time of writing).50 However, in terms of electricity production, the share of coal was higher (38%), while renewables and natural gas respectively accounted for 25% and 23%.50
Along with Indonesia, Australia remains one of the world's largest net exporters of coal. Both countries together accounted for 57% of world coal exports in 2016, and Australia's share alone was 31% of world coal exports.50 Provisional data suggest that Australia and Indonesia accounted for 60% of world coal exports in 2017. Leading countries for production of coal are China (45% of global production), India (10%), followed by the US, Australia and Indonesia. Together, these five countries account for 77% of production of coal (Box 17).50
Domestically, coal and coal products continued to be used primarily for power generation. In 2016, 91% of Australia's coal consumption was devoted to power generation, while the average was 79% for OECD countries.50
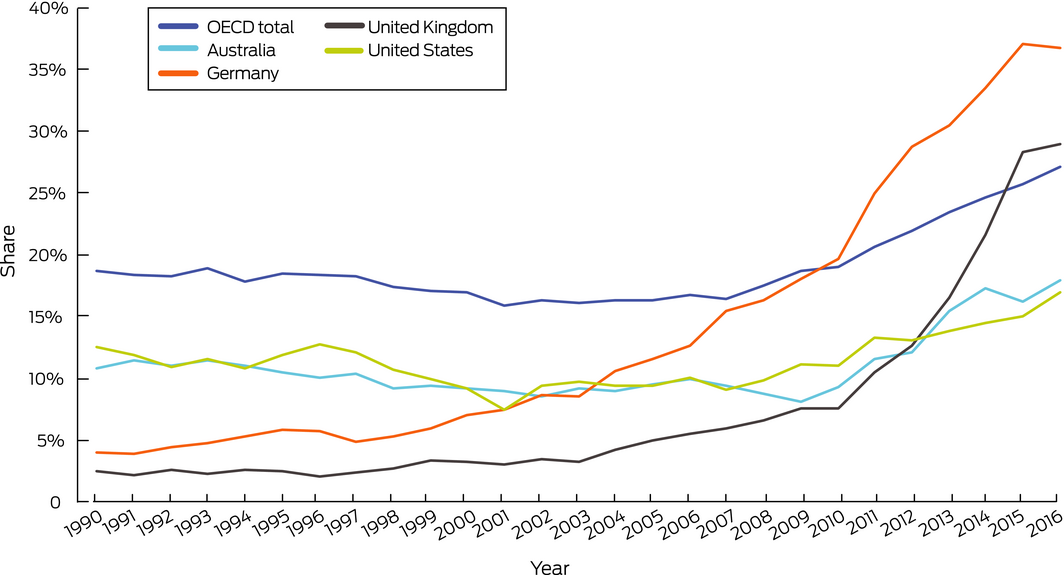
3.3. Renewable and low carbon emission electricity
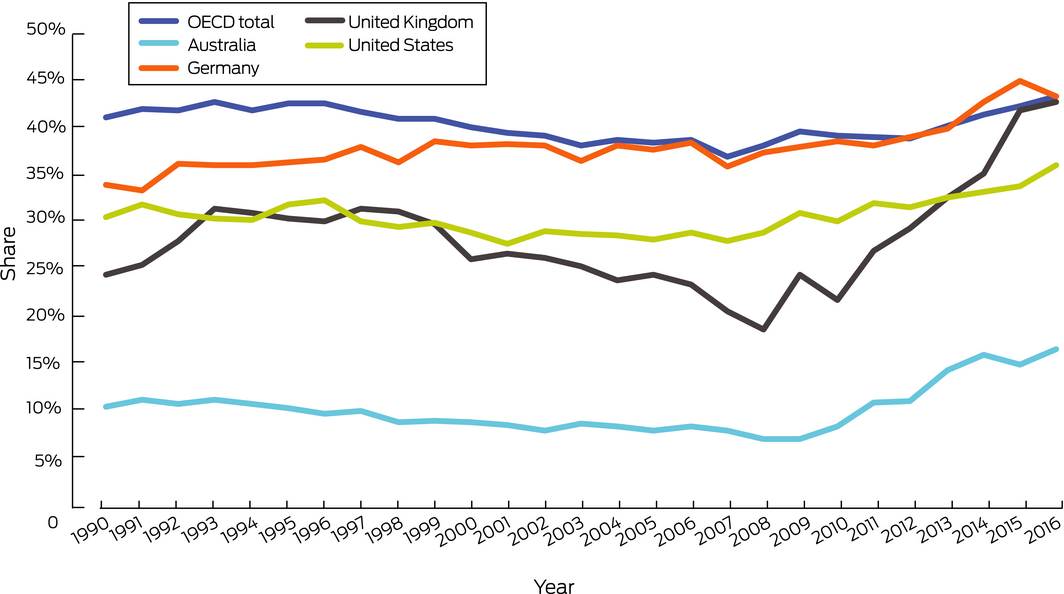
As for last year, we define renewable energy sources as those which “produce energy from renewable sources in a sustainable manner (including bioenergy, geothermal energy, hydropower, ocean energy, solar energy and wind energy, but excluding nuclear power)”, while low carbon sources are defined as “sources that have zero carbon or low carbon emissions at the point of energy production (ie, this excludes biomass, but includes nuclear and hydro)”.10 Data for this indicator are now available for 2016.51
As can be seen from Box 18 and Box 19, countries such as Germany and the United Kingdom that were leading the adoption of renewable and low carbon energy sources have not reported strong increases for 2016. However, recent German data show that the upward trend has continued in 2017 and 2018, with renewables contributing to 38% of energy production in Germany.52,53 From 1990 to 2016, the share of electricity generation from renewable sources increased from 11% to 18%, and from 10% to 16% from low carbon sources in Australia. However, Australia continues to have a much smaller proportion of electricity from low carbon sources compared with leading countries.
3.4. Access to clean energy
In 2018, 21% of Australia's electricity was provided by renewable energy sources.54 It is estimated that 35.2% of Australia's renewable energy was contributed by hydroelectric power plants in 2018, making hydro power an important contributor.54 Australia has had a renewable energy target regulation in place, with a target of 33 000 GWh for large scale generation by 2020 from wind and solar farms or hydroelectric power stations. About half of the renewable energy target has been achieved so far.55 However, the federal government elected in mid‐2019 has no renewable energy target in place as of September 2019.
Australia has a small scale renewable energy scheme,56 providing incentives for individual households or small businesses to install renewable energy systems (eg, solar hot water or solar photovoltaic). About 220 000 solar rooftop systems were installed in 2018, a 26% increase on 2017.57 NSW recorded the highest growth of installations in 2018, up 35% from 2017. In 2018, 20% of Australian households had rooftop solar. There are also signs that uptake is increasing, especially in Victoria where the Victorian Government's Solar Homes Rebate makes the rooftop solar installation more affordable.54
However, as noted above, Australia tracks behind other countries such as Germany and the UK. Furthermore, there is limited additional evidence regarding improvements of energy supply (in particular, from renewable and low carbon sources) for Australia's remote and Indigenous communities that still lack a reliable energy supply.58
3.5. Exposure to ambient air pollution
This indicator provides information on the health impacts of exposure to airborne fine particulate matter, that is, particles less than 2.5 μm in diameter (PM2.5). Fine particulate matter, once inhaled, can affect the respiratory system and the cardiovascular system. We report on two sub‐indicators: exposure to air pollution in cities, and premature mortality from ambient anthropogenic air pollution.
3.5.1. Exposure to air pollution in cities
Last year, we calculated exposure to air pollution using air pollution monitor data, reporting the average of all monitors within 50 km of the centre of major cities (defined as urban areas with populations greater than 100 000 in 2016). This year's indicator uses information on annual average background concentrations of PM2.5 in typical urban settings. We calculated population weighted averages of PM2.5 modelled data for all major Australian cities. In all these cities, the annual average PM2.5 concentrations were below the World Health Organization annual guideline of 10 mg/m3 and the Australian advisory reporting standard of 8 mg/m3. PM2.5 pollution concentrations in these cities have generally remained stable over the past few years.
3.5.2. Premature mortality from ambient anthropogenic air pollution
Ambient air pollution in the form of PM2.5 causes premature mortality. Last year, we reported 2900 deaths attributable to fine particulate matter in 2015 (the latest data available at the time of reporting). Around 2800 deaths were attributable to anthropogenic air pollution in Australia in 2016 (equivalent to 2% of all deaths); slightly fewer than for the previous year.
3.6. Clean fuel use for transport
While the uptake of electric drive vehicles in Australia has been slow compared with international trends, some progress has been observed, such as significant increases in electric drive vehicle sales and numbers of charging stations.59 This indicator shows the proportion of new vehicle sales in Australia which were electric. The largest shares were found in South Australia and the ACT, where electric drive (or hybrid) vehicles comprised 0.22% and 0.21% of new vehicle sales, respectively, while the smallest share was sold in NT, where they comprised only 0.01% of new sales (Box 20). Overall, only 0.09% of new cars sold in Australia in 2016 were electric drive (or hybrid) vehicles.
3.7. Sustainable travel infrastructure and uptake
This indicator is based on household travel data for the capital city of each Australian state and territory. The data were sourced from the Australian Bureau of Infrastructure, Transport and Regional Economics,60 which provides research services to the Australian Government Department of Infrastructure, Transport, Cities and Regional Development. People living in Canberra recorded the highest number of kilometres travelled per capita, as well as the highest number of kilometres travelled in private modes (per capita). Hobart, however, had the greatest share of passenger kilometres travelled in private modes (96.6%). Sydney, Australia's most populous city, had the lowest share of passenger kilometres associated with private transport (85.1%). Correspondingly, the share of passenger kilometres associated with public transport (bus and rail) in Australian capital cities is low, ranging from 14.6% in Sydney to 3.8% in Hobart.
3.8. Health care sector emissions
This indicator quantifies carbon dioxide (CO2) equivalent emissions in Australia's health care sector, using existing data on CO2 equivalent intensities from Malik and colleagues,61 coupled with updated health care expenditure data from the Australian Institute of Health and Welfare.62 Australia's health care expenditure has increased in nominal terms over time. From 2011–12 to 2016–17, there has been a nominal 4.94% average annual increase in expenditure (Supporting Information, Figure A4).62 Looking at the last three reporting rounds: in 2014–15 Australia's health care expenditure was $161.6 billion, leading to 35 772 Kt of emissions;61 expenditure increased to $170.5 billion in 2015–16, resulting in 37 711 Kt of emissions, and to $180.7 billion in 2016–17, contributing 40 102 Kt of emissions. While the causes of these increases in health care sector expenditure and emissions are complex and beyond the scope of this analysis, we note that they do not appear to have been accompanied by corresponding increases in health care accessibility. Indeed, some indicators of accessibility, such as waiting times for emergency department care, have worsened over this period.63
These emission estimates are derived using a national input–output table for Australia with existing data on CO2 equivalent intensities.61 There have been efforts directed at using a global multiregional input–output table for quantifying the contribution of Australian and international industry sectors to Australia's health care emissions. The results for various studies show some variation owing to differences in procedures used for the compilation of greenhouse gas emissions inventories and monetary input–output tables for different databases.11,61,64 The supply chains of hospitals and pharmaceuticals are emissions intensive; hence efforts need to be directed at ensuring sustainable practices are implemented in health care sectors.65
Conclusion: mitigation actions and health co‐benefits
Australia has seen slight progress in transitioning to clean technology and shifting towards lower carbon and renewable sources. However, overall, Australia lags well behind other developed countries, particularly in terms of clean energy uptake and coal phase‐out. The uptake of sustainable transportation, as measured by the uptake of electric drive vehicles in Australia, also remains relatively slow compared with international standards. This means that Australians miss out on less‐polluting sources of energy production and also on the substantial economic benefits associated with a transition to clean technology.66
Section 4: Finance and economics
This section examines the financial and economic enablers of a transition to a low carbon economy, and the implications of inaction.7 We consider recent developments in mitigating carbon emissions and the transition of the electricity sector to a substantial share of renewable energy generation. We also report trends in economic losses due to climate‐related extreme events as well as developments on carbon pricing and the use of revenues from pricing carbon emissions.
4.1. Economic losses due to climate‐related extreme events
This indicator tracks the total insured economic losses from climate‐related disaster events and is based on numbers provided by the Insurance Council of Australia (http://www.icadataglobe.com/access-catastrophe-data/). Box 21 plots the cumulative annual insured losses arising from bushfires, cyclones, flooding, hail storms, storm flooding and tornadoes. For 2018, total annual insured losses from climate‐related catastrophes were estimated to be $1.62 billion. About 80% ($1.30 billion) of these losses resulted from the significant hail storm event in multiple metropolitan and rural regions across NSW in December 2018. Estimated total insured losses for 2018 were lower than in 2015 and 2017, but higher than in 2016.
4.2. Investments in zero carbon energy and energy efficiency
This indicator reports investment in renewable zero carbon energy based on generation capacity in the Australian National Electricity Market (NEM). Investment in generation from renewable energy sources has substantially increased over the past decade. According to the most recent report by the Australian Energy Regulator,67 between 2012–13 and 2018–19, new investment in renewable plant capacity was about 5100 MW. Of this additional capacity, 3445 MW (67%) was in wind power, 1618 MW (32%) in solar, and 70 MW in hydro. Box 22 illustrates that most of this investment in renewable generation capacity occurred between 2017 and 2019 (3187 MW). By October 2018, more than 2000 MW of additional committed capacity from renewable energy were expected to be commissioned in 2018–19.67
Further, 185 MW of battery storage have been added to the market, including the 100 MW Hornsdale Power Reserve in South Australia, the first scheduled battery in the NEM and currently the world's largest lithium ion battery. Further investment in battery storage has been commissioned, which will increase the efficiency of the NEM.
4.3. Investment in new coal capacity
This indicator reports investment in coal capacity. As reported last year,10 since 2009–10, investment in coal capacity has decreased substantially and several major coal‐fired power plants have been removed from the market. According to the most recent report by the Australian Energy Regulator67 and information provided by the Australia Energy Market Operator,68 market participants in the NEM (including AGL, ENGIE and Origin Energy) have signalled they have no plans to invest in new coal‐fired power plants.
At the same time, investment is still flowing into improving existing generation from coal. For example, in 2018, AGL had completed $70 million of work that included the installation of a new control system at the coal‐fired Bayswater power station in NSW to improve plant stability, operational flexibility and reliability.69 Additional investment, including a $200 million turbine efficiency upgrade, will be conducted over the next 2 years.
4.4. Employment in renewable and fossil fuel energy industries
This indicator suggests that direct full‐time equivalent (FTE) employment in renewable energy activities in Australia has increased by 3890 (28%) from the 2016–17 financial year, following a 25% increase over the previous year. Annual direct FTE employment is now estimated at 17 740 people in 2017–18, representing the highest level since 2012–13. Box 23 illustrates the recent substantial rise in employment numbers in renewable energy since 2015–16, after a decline between 2012 and 2016. The highest estimated growth rates in FTE employment in the sector were in Victoria (47%), followed by Queensland (44%) and NSW (27%). The boost in employment in renewable energy activities over the past 12 months has been mainly supported by increased construction activity for large scale solar photovoltaic systems and increased installation of rooftop photovoltaic systems.70
The mining sector, a key representative of high carbon industries, also exhibited some growth. FTE employment in mining operations increased by 7% to 168 000 for 2017–18, after a significant drop in the previous 5 years from 194 000 in 2011–12 to 157 000 in 2016–17.
4.5. Funds divested from fossil fuels
We assessed funds divested from fossil fuels in Australia through two indicators. The first is the number of companies and government organisations which have partially or entirely committed to divest themselves of assets involved in extracting or generating energy from fossil fuels. While Australia continues to play a major role in the divestment movement,71,72 we have no updated information on the actual number of organisations and committed funds this year.
The second indicator measures the withdrawal of electricity generation capacity from coal‐fired power plants. About 1400 MW of generation capacity from black coal and 2700 MW capacity from brown coal were withdrawn from the NEM between 2014 and 2017 (Box 22). This also included Australia's most emissions‐intensive power station in Hazelwood (Victoria), which supplied about 5% of the total output of the NEM.67 Further retirements of coal‐fired power plants are scheduled in upcoming years, including the Liddell power station (1680 MW) in NSW in 2022.68
4.6. Coverage and strength of carbon pricing
Australia's carbon pricing policy is categorised as “ETS [emissions trading system] implemented or scheduled for implementation” on the World Bank's Carbon Pricing Dashboard (https://carbonpricingdashboard.worldbank.org/). However, it could be reasonably argued that the voluntary Emissions Reduction Fund (ERF), with its safeguard mechanism, is not a genuine ETS.73,74 The ERF uses taxpayer funds to support emission reduction actions through a reverse auction process; it does not require polluters to pay for emissions reductions, which is a key FASTER (fairness, alignment of policies and objectives, stability and predictability, transparency, efficiency and cost‐effectiveness, reliability and environmental integrity) principle for successful carbon pricing.75 Recent figures also show that less than one‐fifth of the paid‐for abatement has been delivered.56 In early 2019, amendments were made to the safeguard mechanism to soften baselines76 and the ERF was augmented by $2 billion and renamed the Climate Solutions Fund.
4.7. Use of carbon pricing revenues
There is no indication that any revenue obtained by the ERF has been used for mitigation, adaptation, revenue recycling or other relevant general funds in 2018–2019. Further, the additional $2 billion put into the Climate Solutions Fund in 2019 will not be revenue explicitly returned to a broad portion of the population through tax cuts or rebates. Consequently, it is not included in this indicator.
Conclusion: finance and economics
This section highlights the financial and economic enablers of a transition to a low carbon economy, and the implications of inaction (Box 24). The indicators provide evidence of a continued trend of rising economic losses from climate‐related extreme events. In recent years, there has also been a substantial increase in investment in renewable energy generation from wind and solar, and the withdrawal of generation capacity from coal‐fired power plants. Between 2016 and 2018, employment in renewable energy activities increased by almost 60%, providing further evidence of progress towards a low carbon economy in Australia. At the same time, only limited efforts towards carbon pricing are evident, while no revenue from pricing carbon emissions has been spent on climate mitigation, adaptation or health‐related activities.
Section 5: Public and political engagement
Public and political engagement in health and climate change is a prerequisite for action by governments, industry and communities. The domains of engagement covered in this section are media, science, government and corporate. The indicators track hard copy newspaper coverage, selected online media, scientific journal articles, parliamentary records and corporate sector engagement with the United Nations (UN) Global Compact.
5.1. Media coverage of health and climate change
Exposure to news coverage about health and climate change in Australia has declined over the past decade. This decline contrasts with the increase in global media coverage of this topic.7
This indicator examined media stories in 13 national and regional high circulation English language newspapers from 1 January 2008 until the day before the Australian federal election on 18 May 2019. This year, the indicator included Australian Broadcasting Corporation (ABC) online news and transcripts of programs. Overall, coverage of health and climate change in the Australian newspapers dropped 67% between 2008 and 2018, with the largest regional drop occurring in Canberra (Box 25). ABC online coverage of health and climate change has also substantially decreased (Supporting Information, Figure A5). Notably, in the first four‐and‐a‐half months of 2019, the number of news stories addressing health and climate change was similar to or higher than that of the whole of 2018, especially in Melbourne, Sydney and Hobart. The increase may be attributable to the federal election campaign, as well as reporting of the warmest January on record for Australia.77 Our findings indicate that the Australian public has diminishing opportunities to be engaged in health and climate change discourse via mainstream newspapers and online news media.
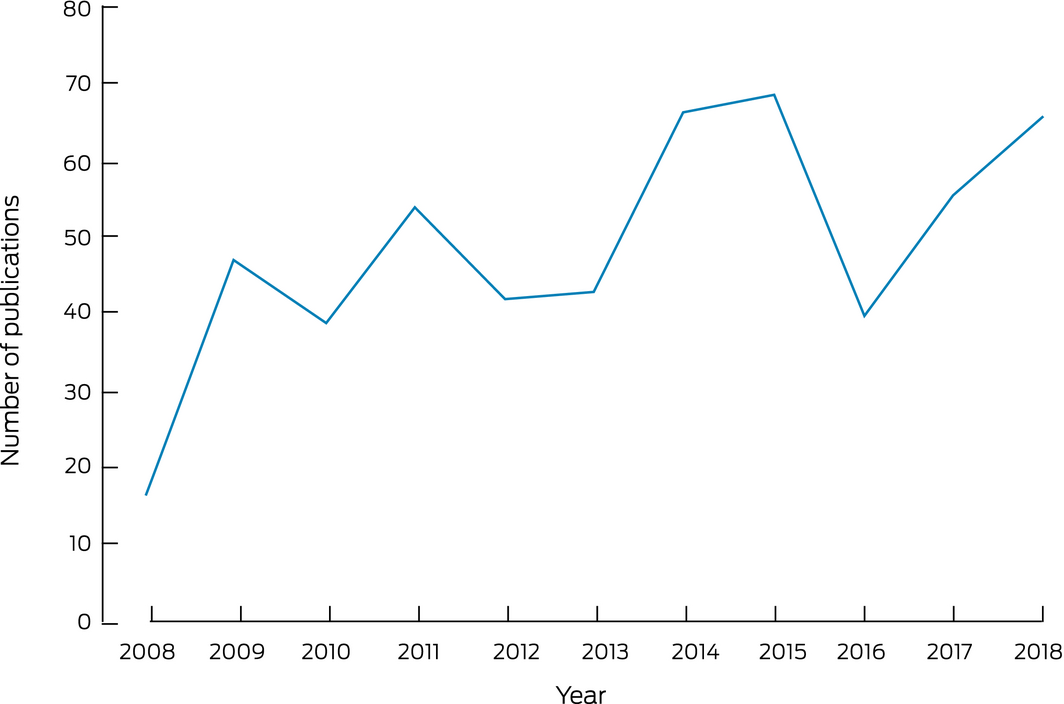
5.2. Coverage of health and climate change in scientific journals
Scientific publications on health and climate change in Australia increased fourfold between 2008 and 2014, but no further increase has since been observed (Box 26). In total, we have identified 540 scientific publications about health and climate change from 2008 to 2018, which account for 5% of the total number of Australian climate change scientific publications over the same period.
We adopted similar search terms to those used by the Lancet Countdown7 with added geographic terms to identify Australian studies. Among the identified publications, 84% were original research and the others were reviews (10%), editorials (3%) and correspondence (3%) (Supporting Information, Figure A6). The proportion of scientific publications reporting original research was much higher in Australia than for the world as a whole (47%), which may reflect research capacity in Australia and contribution to knowledge about health and climate change at a global level. In terms of subject areas, 34% of these scientific publications were in medicine, followed by environmental sciences (23%) and social sciences (14%) (Supporting Information, Figure A7). With respect to health outcomes, while infectious diseases were the most common health focus (24%) at a global level, in Australia more publications focused on total mortality/non‐communicable disease related to heat, respiratory health related to bushfire, and mental health related to bushfire and other natural disasters. More studies were carried out in Victoria and Queensland, with few studies in Tasmania, the NT and the ACT.
5.3. Engagement in health and climate change in Australian government
We searched the Parliamentary websites of the Australian Government for legislation, programs, policy, speeches and statements on health and climate change. We also searched the website of the federal Department of Health for policies, programs or statements on climate change. We found no engagement in health and climate change by the Australian Government during the past ten years (Supporting Information, Table A6). Given the current and projected impacts of climate change on the health of the Australian population, and the related escalation in frequency and severity of extreme weather events, the lack of engagement by the Australian Government is of significant concern.
At the state level, the Queensland Government has a health and wellbeing climate adaptation plan.41 In March 2019, the WA Government announced a Chief Health Officer Inquiry to investigate the health implications of climate change, including the health impacts of more frequent and intense weather events. The aim of the inquiry is to review the current planning and response capacity of the WA health system for the health impacts of climate change. The inquiry will also make recommendations for improving climate change mitigation and public health adaptation strategies. We will formally review the engagement at state level in future assessments.
5.4. Engagement in health and climate change in Australian corporate sector
Compared with the data available for the global report,7 Australian data from the UN Global Compact Communication on Progress, relevant to the corporate sector's engagement in health and climate change, are extremely limited. Only 170 organisations in Australia are signed up for this initiative and, of those, 150 are classified as active (ie, they are reporting under the initiative). Of the 150 active organisations, 20 joined very recently in 2019, meaning that these organisations have not yet submitted a report. A further 24 organisations joined in 2018, and only seven of those have started to submit reports (mostly existing annual or sustainability reports). Around one‐fifth of the organisations in the Australia database (21%) consist of academic institutions or non‐government organisations. Given the small number of corporate reports available, and their lack of comment on malnutrition, communicable diseases or malaria, a statistical analysis of corporate engagement with the intersection of health and climate change issues was not feasible. However, most ASX‐listed companies have produced sustainability reports alongside their annual/financial reports. Thus, a future version of this indicator could focus on sourcing sustainability reports for a sample of Australia's ASX‐listed companies and examining the intersection between local/regional and global health outcomes.
Conclusion: public and political engagement
Progress on public and political engagement in health and climate change has been mixed, as summarised in Box 27. Media coverage about health and climate change in Australia continues to be modest by comparison with the levels of coverage in other countries. In the context of the federal election, there was a relative increase in this coverage in the first part of 2019. The number of Australian scientific journal articles on health and climate change has risen in recent years to more than 60 per annum, returning to a level similar to the previous peak in 2014 and 2015. While there continues to be no engagement on health and climate change in the Australian federal Parliament, the climate change and health inquiry recently commenced by the WA Government is a positive development. Corporate engagement on health and climate change in Australia is currently difficult to assess using the UN Global Compact reporting processes because, at this time, only a limited number of Australian organisations have signed up for this initiative.
Conclusion: the MJA–Lancet Countdown in 2019
In a year marked by an Australian federal election in which climate change featured prominently, we find mixed progress on health and climate change in this country. There has been progress in renewable energy generation, including substantial employment increases in this sector. There has also been some progress at state and local government level. However, there continues to be no engagement on health and climate change in the Australian federal Parliament, and Australia performs poorly across many of the indicators in comparison to other developed countries. We also find significant increasing exposure of Australians to heatwaves and, in most states and territories, greatly elevated suicide rates at higher temperatures.
The lack of Australian national policy to address threats of climate change to health — and the consequent failure to realise the enormous opportunities that doing so would afford our nation — is disappointing to say the least. This work is urgent and should be undertaken within a complex systems thinking framework.78 As a direct result of this failure, we conclude that Australia remains at significant risk of declines in health due to climate change, and that substantial and sustained national action is urgently required in order to prevent this.
Box 1 – Indicators assessed for the 2019 MJA–Lancet Countdown, including equivalent 2018 MJA–Lancet Countdown indicators
|
2019 indicator |
2018 equivalent |
||||||||||||||
|
|
|||||||||||||||
|
Section 1: Climate change impacts, exposures and vulnerability |
|
||||||||||||||
|
1.1 Vulnerability to the heat‐related risks of climate change |
New |
||||||||||||||
|
1.2 Exposure to temperature change |
1.1 |
||||||||||||||
|
1.3 Health effects of heatwaves |
1.2 |
||||||||||||||
|
1.4 Change in labour capacity |
1.3 |
||||||||||||||
|
1.5 Mental health |
1.9 |
||||||||||||||
|
1.6 Wildfire exposure |
New |
||||||||||||||
|
Section 2: Adaptation, planning and resilience for health |
|||||||||||||||
|
2.1 Australian adaptation plans for health |
2.1 |
||||||||||||||
|
2.2 City‐level climate change risk assessments |
2.2 |
||||||||||||||
|
2.3 Detection, preparedness and response to health emergencies |
2.3 |
||||||||||||||
|
2.4 Climate information services for health |
2.4 |
||||||||||||||
|
2.5 National assessments of climate change impacts, vulnerability and adaptation for health |
2.5 |
||||||||||||||
|
Section 3: Mitigation actions and health co‐benefits |
|||||||||||||||
|
3.1 Carbon intensity of the energy system |
3.1 |
||||||||||||||
|
3.2 Coal phase‐out |
3.2 |
||||||||||||||
|
3.3 Renewable and low carbon emission electricity |
3.3 |
||||||||||||||
|
3.4 Access to clean energy |
3.4 |
||||||||||||||
|
3.5 Exposure to ambient air pollution |
3.5 |
||||||||||||||
|
3.5.1 Exposure to air pollution in cities |
3.5.1 |
||||||||||||||
|
3.5.2 Premature mortality from ambient anthropogenic air pollution |
3.5.2 |
||||||||||||||
|
3.6 Clean fuel use for transport |
3.6 |
||||||||||||||
|
3.7 Sustainable travel infrastructure and uptake |
3.7 |
||||||||||||||
|
3.8 Health care sector emissions |
3.9 |
||||||||||||||
|
Section 4: Finance and economics |
|||||||||||||||
|
4.1 Economic losses due to climate‐related extreme events |
4.4 |
||||||||||||||
|
4.2 Investments in zero carbon energy and energy efficiency |
4.1 |
||||||||||||||
|
4.3 Investment in new coal capacity |
4.2 |
||||||||||||||
|
4.4 Employment in renewable and fossil fuel energy industries |
4.5 |
||||||||||||||
|
4.5 Funds divested from fossil fuels |
4.3 |
||||||||||||||
|
4.6 Coverage and strength of carbon pricing |
4.7 |
||||||||||||||
|
4.7 Use of carbon pricing revenues |
4.8 |
||||||||||||||
|
Section 5: Public and political engagement |
|||||||||||||||
|
5.1 Media coverage of health and climate change |
5.1 |
||||||||||||||
|
5.2 Coverage of health and climate change in scientific journals |
5.2 |
||||||||||||||
|
5.3 Engagement in health and climate change in Australian government |
5.3 |
||||||||||||||
|
5.4 Engagement in health and climate change in Australian corporate sector |
New |
||||||||||||||
|
|
|||||||||||||||
|
|
|||||||||||||||
Box 2 – Climate change and health attribution
- In climate science, “extreme event attribution” refers to estimating the change in likelihood of a severe weather‐related event due to underlying specific mechanisms, including anthropogenic climate change. Recently, extreme event attribution studies have begun to calculate the anthropogenic climate change‐related health impacts of certain weather events.12,13 For example, in the 2003 European heatwaves, anthropogenic climate change increased the risk of heat‐related mortality in central Paris by ~70% and by ~20% in London.12
- Being able to quantify the extent to which anthropogenic climate change contributes to conspicuous impacts means that scientists can more fully demonstrate the range of climate change and related costs to health, society and the economy.13 Because this field is still in its infancy, many technical questions remain unresolved, such as reliable long term datasets, which physical climate models to employ, how to measure impacts, and how to suitably merge these respective fields in standardised approaches for effective attribution of climate change impacts.13,14 Moreover, some events and their impacts are more amenable to attribution calculations than are others, which is not always clear until analyses are underway. There are thus numerous questions to answer before important uncertainties can be resolved. Nevertheless, attribution assessments show great potential in helping to demonstrate the many ways in which anthropogenic climate change has influenced extreme events and their health impacts.13
Box 3 – Migration and population displacement
- While climate change is unquestionably altering Australia's landscape and affecting resource availability (eg, causing severe drought and more frequent and severe bushfires, and affecting agriculture), there are no published quantitative data for Australia on migration related to climate change.
- However, since the publication of the first MJA–Lancet Countdown report in 2018, anecdotal evidence has been reported for evacuation or temporary displacement (although not for permanent migration) made necessary by climate change‐sensitive weather‐related disasters. For example, severe fire events have occurred in New South Wales, Queensland, Tasmania, Victoria and Western Australia requiring community evacuations due to the fire threat, or advice that vulnerable individuals relocate away from hazardous air pollution.17,18
- Australian Indigenous peoples face particularly severe threats due to their unique circumstances and the vulnerability of some of their lands, for example, in the Torres Strait.19 Disruption to traditional relationships to land resulting from weather‐related disasters, such as the loss of meeting places on rivers during the millennium drought, profoundly affect social and emotional wellbeing.20
Box 5 – Nationally averaged Australian summer (December–February) maximum temperature anomalies for the past 20 summers (1999–2000 to 2018–19)
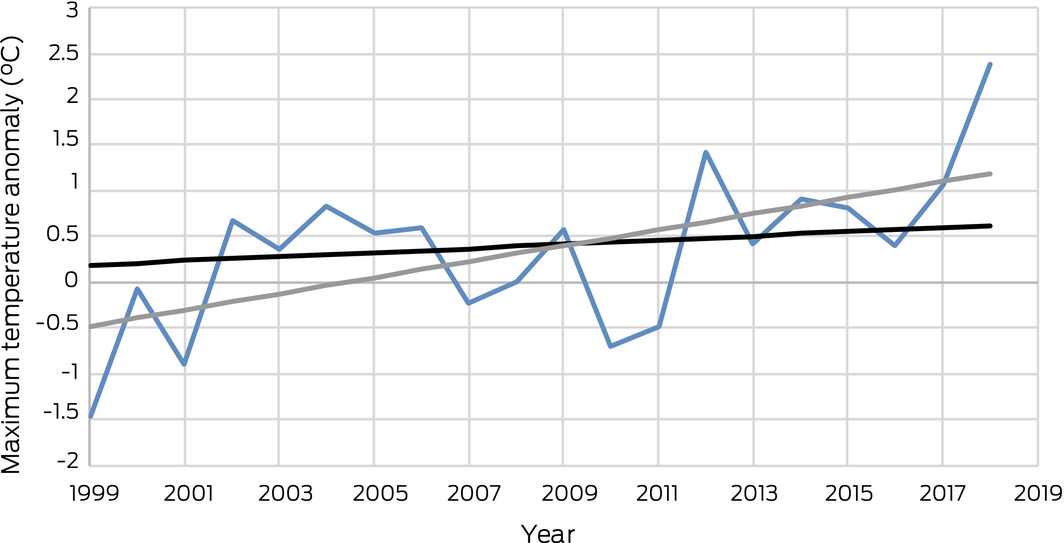
The base period for the anomalies is 1981–2010. The black trend line is calculated over the past 50 summers (1969–70 to 2018–19), while the grey trend line is calculated over the past 20 summers.
Box 6 – Nationally averaged Australian heatwave season (November–March) accumulated excess heat factor (EHF) for the past 20 heatwave seasons (1999–2000 to 2018–19)
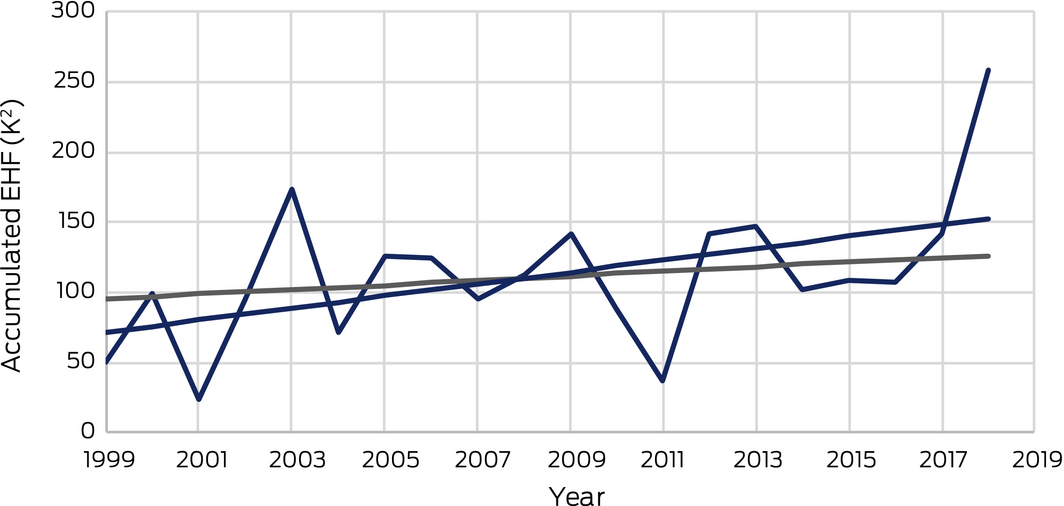
The grey trend line is calculated over the past 50 heatwave seasons (1969–70 to 2018–19), while the blue trend line is calculated over the past 20 heatwave seasons.
Box 7 – Total hours of labour lost due to heat, by sector in Australia, 2000–2018
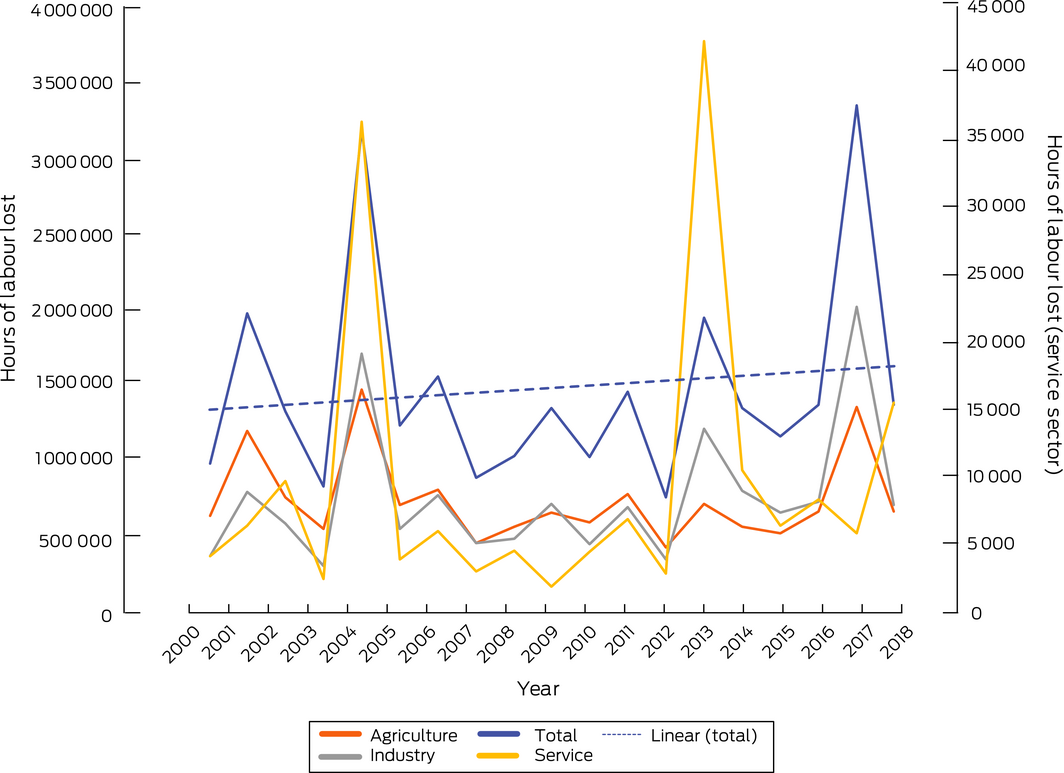
Only the service sector is plotted against the right‐hand y‐axis. A linear trend line is included for just the total hours of labour lost.
Box 8 – Relationship between mean maximum and mean minimum annual temperature and age‐standardised suicide rates by warm compared with cool jurisdictions in Australia and by sex, for baseline (2007–2016), baseline plus one year (2007–2017) and for latest year of available data (2017)
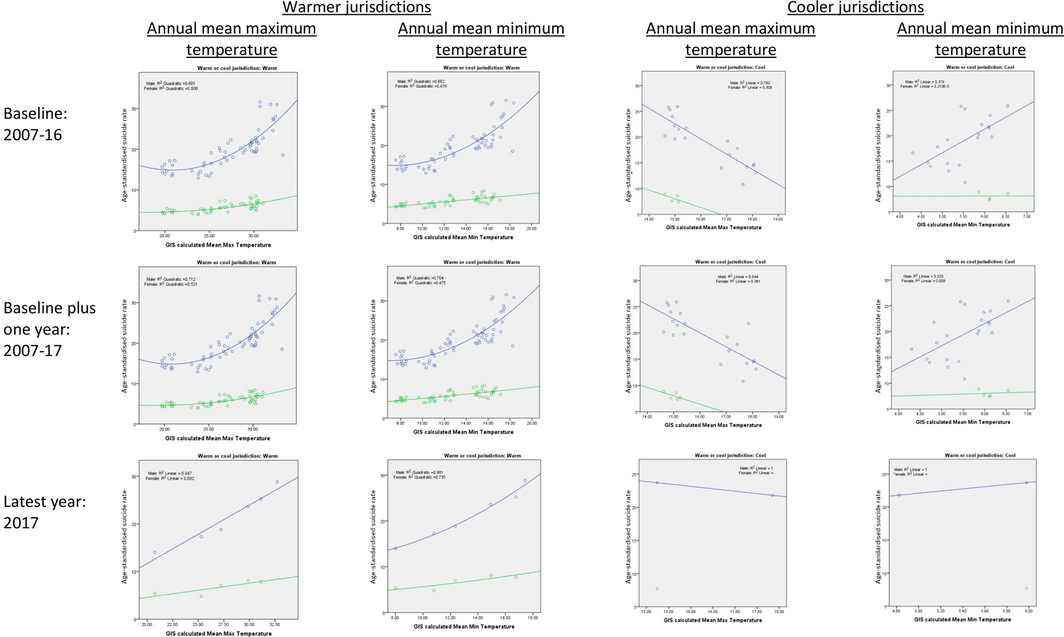
Cool jurisdictions are Tasmania and the Australian Capital Territory. All other jurisdictions are classified as warm. Blue markers indicate males; green markers indicate females.
Box 10 – Climate change adaptation to vulnerabilities from mosquito‐borne diseases
- Several mosquito‐borne diseases are currently transmitted within Australia, causing about 9000 infections annually.36 Dengue virus (about 700 cases notified per year) is not endemic but circulates locally each year after it is introduced by an overseas visitor or a resident returning from an endemic country. Most of these cases occur in Queensland. Ross River virus and Barmah Forest virus are endemic to a number of regions in Australia, including in the south, and affect around 5500 and 1400 people each year, respectively.36 Murray Valley encephalitis, Japanese encephalitis, and Kunjin virus occur only rarely. Malaria has not been transmitted on the mainland for several decades but occasional cases occur in the Torres Strait. Other mosquito‐borne diseases not currently transmitted in Australia but which occur in the region and could potentially take hold are zika virus, chikungunya, and yellow fever.
- While there are many factors at play in the transmission of mosquito‐borne disease, climate sets the parameters under which mosquitoes and the pathogen occur and disease can be transmitted. Mosquitoes favour warm, wet environments, and generally speaking will proliferate under these conditions and feed more frequently, which provides more opportunities to transmit disease. However, the relationship between virus transmission and temperature is not linear, and is characterised by optimal transmission temperatures and bounded by thresholds, below and above which transmission does not occur, and these temperature effects vary by both mosquito species and pathogen.37 To an upper threshold, virus replication is sped up under warmer ambient temperatures, also enhancing transmission potential. Temperature effects on mosquito abundance are also moderated by humidity and rainfall. Humid environments generally enhance mosquito survival, while rainfall can contribute to breeding habitat. With the increased likelihood of more intense rainfall events over much of Australia even as overall rainfall declines (as is expected in the south‐east and south‐west of the country), there is potential for increased mosquito breeding habitats available through localised flooding, but the effect on disease may be season and location dependent.38 The changes to climate in Australia overall are likely to lead to more favourable habitats for mosquitoes and greater transmission potential for the diseases they carry in some regions. The transmission ecology of certain pathogens that can involve multiple host species, such as Ross River virus,39 further increase the complexity of predicting the effects of climate change on disease incidence. A focused adaptation response to this increasing threat of disease from climate change is required, and how Australia is tracking on adaptation to mosquito‐borne disease will be included as an indicator in subsequent versions of this report.
Box 11 – Inclusion of health and climate change within medical curricula
- From 2020, the MJA–Lancet Countdown will track an indicator of the actions of Australia's 21 medical schools in preparing medical graduates to deal with the health consequences of climate change and to work in an environmentally sustainable health care system. To date, there has been a limited response in medical training to developing the capacity of future doctors to respond to the current and future challenges posed by climate change and other environmental threats in Australia and internationally.
- Consequently, the Medical Deans of Australia and New Zealand (MDANZ), the peak body for professional medical education in Australia and New Zealand, has formed a working group to develop learning resources and to support medical schools to work collegially to implement change.40 The working group has developed graduate outcome statements and learning objectives, and MDANZ has distributed these to all medical schools. The introduction of the MJA–Lancet Countdown indicator provides an opportunity to track engagement with these resources and create a baseline in this area of learning against which developments can be monitored.
- This approach potentially presents a model that can be adapted by other regulated health professions in Australia.
Box 12 – Summary of progress on Australian climate change adaptation, planning and resilience for health
|
Indicator number |
Indicator name |
Previous value |
Current value |
Change |
Progress |
||||||||||
|
|
|||||||||||||||
|
2.1 |
Australian adaptation plans for health |
1 |
1+* |
0 |
Yes* |
||||||||||
|
2.2 |
City level climate change risk assessments† |
70 |
99 |
41% |
Yes |
||||||||||
|
2.3 |
Detection, preparedness and response to health emergencies‡ |
100% |
100% |
0 |
Yes |
||||||||||
|
2.4 |
Climate information services for health |
3 |
3 |
0 |
Yes |
||||||||||
|
2.5 |
National assessments of climate change impacts, vulnerability and adaptation for health |
1 |
1+§ |
0 |
Yes§ |
||||||||||
|
|
|||||||||||||||
|
*While there is still only one published health adaptation plan, unchanged from 2018, Tasmania's progress towards a state plan should be acknowledged.†Number of local councils (nationally) participating in the Cities Power Partnership supporting local initiatives in adaptation and mitigation.‡While the latest data show Australia scoring 100% on all core capacities, previous years have been inconsistent.§While there is still only one national impact assessment produced by the Australian Government — the 2008 Garnaut climate change review43 — the growing contributions to policy relevant information by the Climate Council should be acknowledged. |
|||||||||||||||
Box 13 – Proportion of councils in each Australian state and territory participating in the Cities Power Partnership in 2018 and 2019
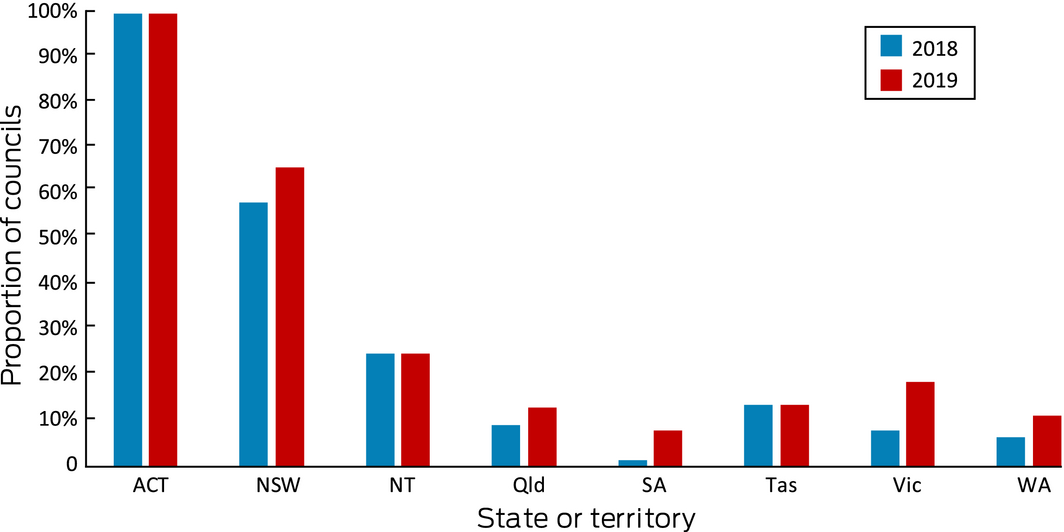
Note the Australian Capital Territory has only one local government area.
Box 14 – International Health Regulations (2005) monitoring framework capacity scores for Australia for surveillance, response, preparedness and human resources, 2010–2017
Box 15 – Summary of progress on Australian climate change mitigation actions and health co‐benefits
|
Indicator number |
Indicator name |
Previous value* |
Updated value† |
Change |
Progress |
||||||||||
|
|
|||||||||||||||
|
3.1 |
Carbon intensity of the energy system (total energy supply) |
71.89 CO2/MJ (2013 data);* subsequently adjusted to 72.35 CO2/MJ (2013 data)† |
72.23 CO2/MJ (2016) |
− 0.12 CO2/MJ |
Yes |
||||||||||
|
3.2 |
Coal phase‐out (total primary coal supply) |
42.87 Mtoe (2015) |
44.02 Mtoe (2016) |
+ 1.15 Mtoe |
No |
||||||||||
|
3.3 |
Renewable and low carbon emission electricity (% of total) |
|
|
|
|
||||||||||
|
|
Renewable sources |
16.17% (2015) |
17.95% (2016) |
+ 1.78% |
Yes |
||||||||||
|
|
|
|
18.80%(2017) |
+ 2.63% |
Yes |
||||||||||
|
|
Low carbon sources |
14.66% (2015) |
16.42% (2016) |
+ 1.76% |
Yes |
||||||||||
|
|
|
|
17.41% (2017) |
+ 2.75% |
Yes |
||||||||||
|
3.4 |
Access to clean energy‡ |
|
|
|
|
||||||||||
|
3.5 |
Exposure to ambient air pollution (3.5.2) |
2900 (2015) |
2800 (2016) |
− 3.45% |
Yes |
||||||||||
|
3.6 |
Clean fuel use for transport‡ |
|
|
|
|
||||||||||
|
3.7 |
Sustainable travel infrastructure and uptake‡ |
|
|
|
|
||||||||||
|
3.8 |
Health care sector emissions |
35.8 Mt emissions (2014–15) |
40.1 Mt emissions (2016–17) |
+ 4.3 |
No |
||||||||||
|
|
|||||||||||||||
|
Mtoe = million tonnes of oil equivalent. *As reported in Zhang et al.10 † Based on latest available data (year noted in parentheses). ‡ For details, see discussion of this indicator in main text of this report. |
|||||||||||||||
Box 16 – Carbon intensity of total primary energy supply for Australia, selected countries and the world, and corresponding total carbon dioxide (CO2) emissions, 1971–2016
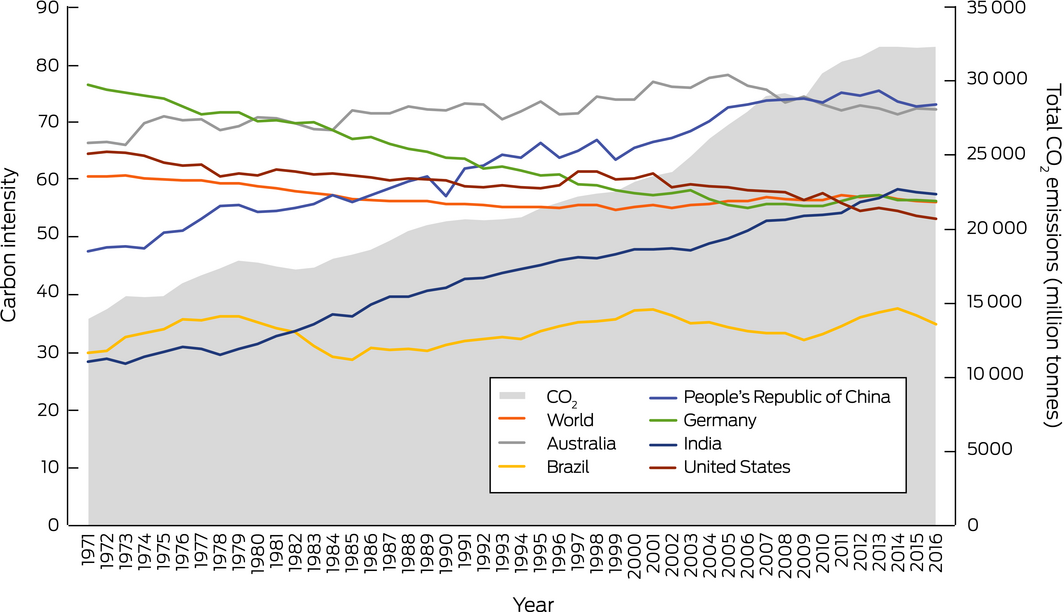
Source: International Energy Agency47
Box 17 – Total primary coal supply in Australia, China, India and the United States, 1973–2017
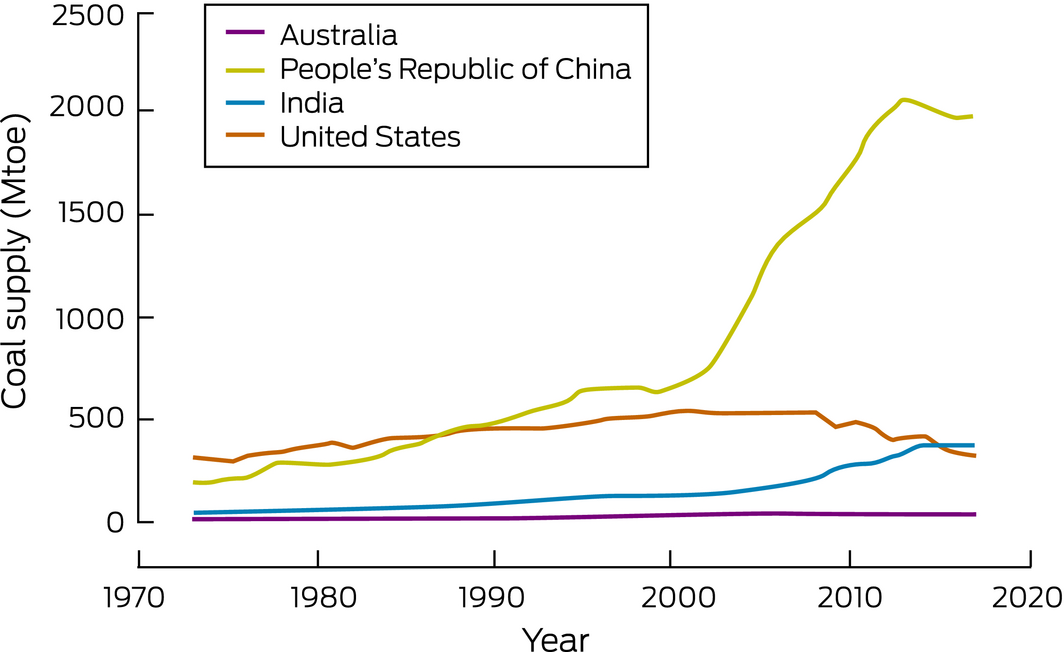
Mtoe = million tonnes of oil equivalent. Source: International Energy Agency.50 All rights reserved.
Box 18 – Share of electricity generation from renewable sources in Australia, Germany, the United Kingdom and the United States, and the Organisation for Economic Co‐operation and Development (OECD) total, 1990–2016
Box 19 – Share of electricity generation from low carbon sources in Australia, Germany, the United Kingdom and the United States, and the Organisation for Economic Co‐operation and Development (OECD) total, 1990–2016
Box 20 – Share of new vehicles in each Australian state and territory in 2016 which are electric (or hybrid)
|
State/territory |
Share of new vehicles which are electric (or hybrid) |
||||||||||||||
|
|
|||||||||||||||
|
South Australia |
0.22% |
||||||||||||||
|
Australian Capital Territory |
0.21% |
||||||||||||||
|
New South Wales |
0.10% |
||||||||||||||
|
Victoria |
0.10% |
||||||||||||||
|
Western Australia |
0.08% |
||||||||||||||
|
Queensland |
0.06% |
||||||||||||||
|
Tasmania |
0.03% |
||||||||||||||
|
Northern Territory |
0.01% |
||||||||||||||
|
Australia |
0.09% |
||||||||||||||
|
|
|||||||||||||||
|
|
|||||||||||||||
Box 21 – Annual total insured economic losses in Australia from bushfires, cyclones, flooding, hailstorms, storm flooding and tornadoes for the period 2000–2018*
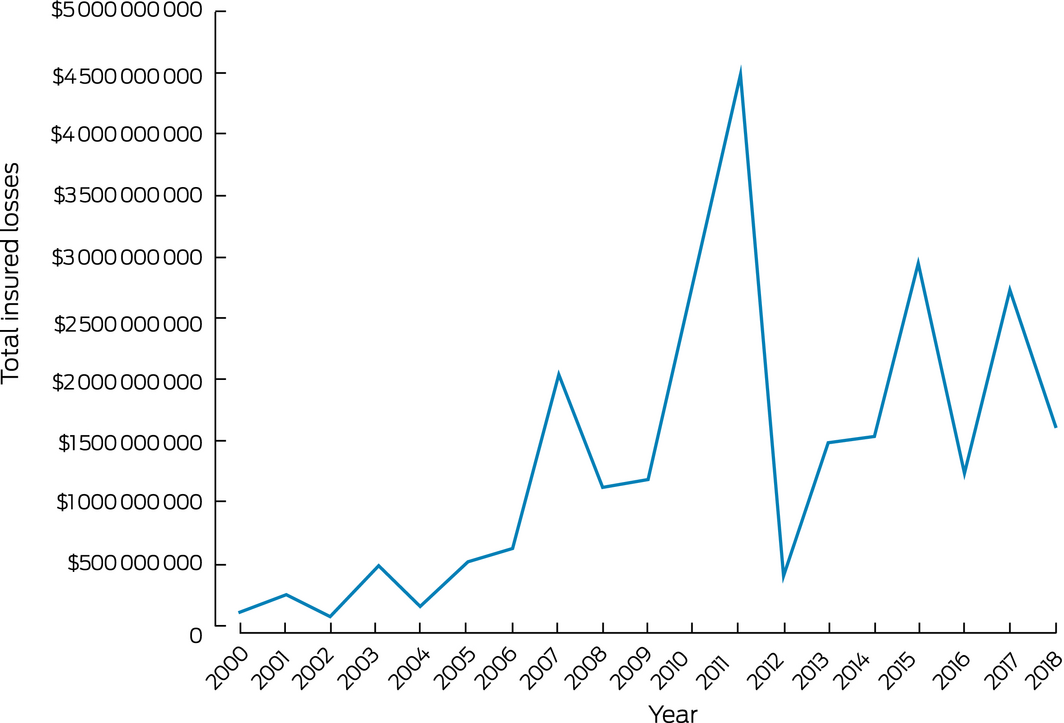
* Based on data from the Insurance Council of Australia Historical Catastrophe Database: http://www.icadataglobe.com/access-catastrophe-data/.
Box 22 – New investment and capacity withdrawal in the Australian National Electricity Market for different fuel sources (black coal, brown coal, gas, hydro, wind, solar and battery) for financial years 2012–13 to 2018–19
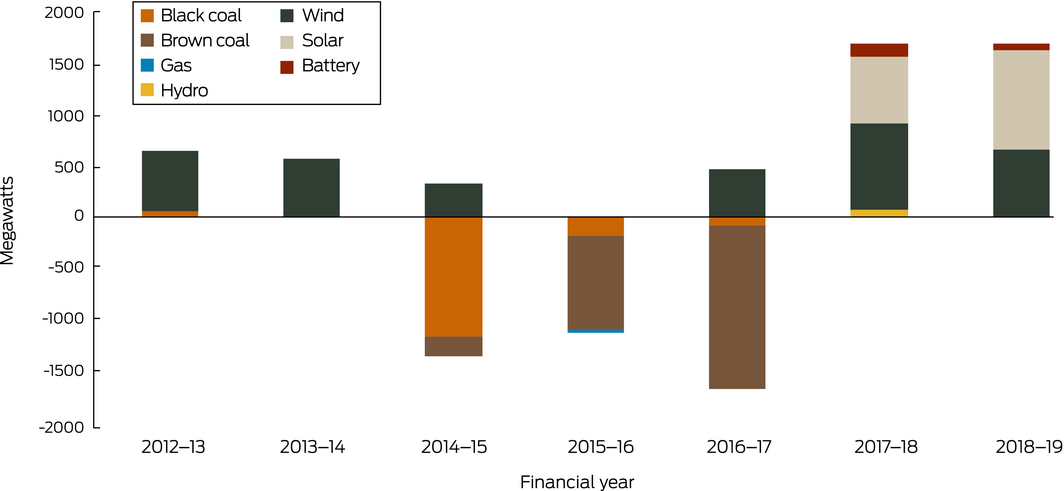
Note: 2018–19 data are to 31 October 2018 only. An additional 2076 MW of committed capacity (1178 MW of wind, 873 MW of solar, 24 MW of biomass and 2 MW of battery storage) was expected to be commissioned in 2018–19. Source: Australian Energy Regulator.67
Box 23 – Annual direct full‐time equivalent (FTE) employment in renewable energy activities for Australia, New South Wales, Queensland, South Australia and Victoria, 2009–10 to 2017–18
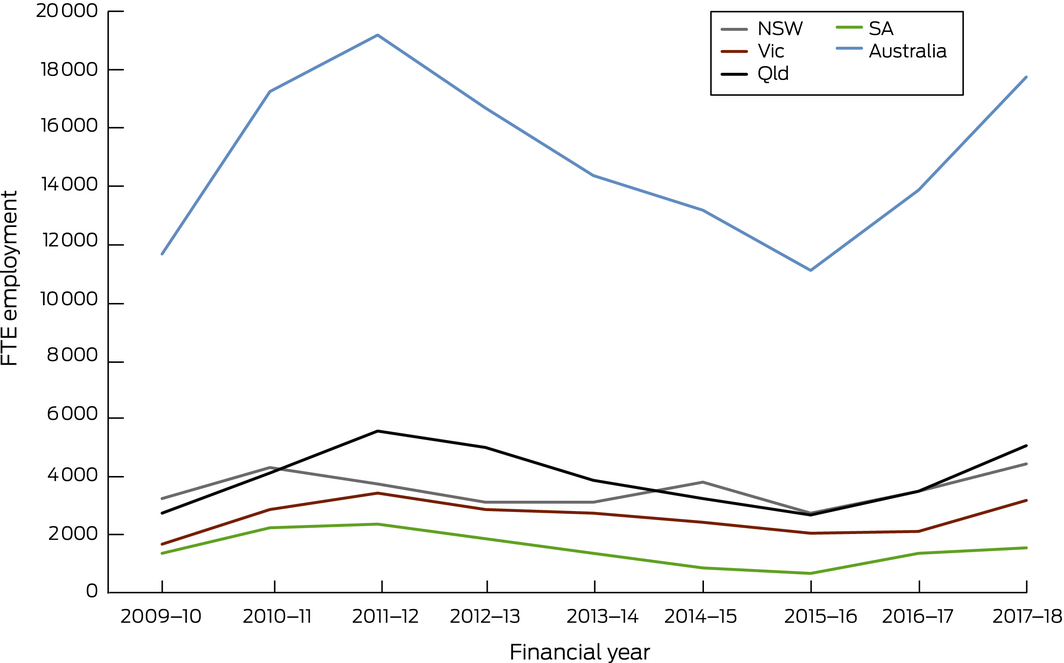
Source: Australian Bureau of Statistics.70
Box 24 – Summary of progress on Australian climate change finance and economics
|
Indicator number |
Indicator name |
Previous value |
Current value |
Change |
Progress |
||||||||||
|
|
|||||||||||||||
|
4.1 |
Economic losses due to climate‐related extreme events |
$2.75 billion (2017) |
$1.62 billion (2018) |
− 41% |
Yes |
||||||||||
|
4.2 |
Investments in zero carbon energy and energy efficiency |
|
|
|
|
||||||||||
|
|
Renewables |
See main text of this report |
+ |
Yes |
|||||||||||
|
|
Coal withdrawal |
See main text of this report |
0 |
No |
|||||||||||
|
4.3 |
Investment in new coal capacity |
See main text of this report |
|
Yes |
|||||||||||
|
4.4 |
Employment in renewable and fossil fuel energy industries |
|
|
|
|
||||||||||
|
|
Renewable |
~ 15 000 (2016–17) |
17 740 (2017–18) |
+ 28% |
Yes |
||||||||||
|
|
Fossil fuel |
157 000 (2016–17) |
168 000 (2017–18) |
+ 7% |
No |
||||||||||
|
4.5 |
Funds divested from fossil fuels |
|
|
|
|
||||||||||
|
|
Coal withdrawal |
0 (2017–18) |
0 (2018–19) |
0 |
No |
||||||||||
|
4.6 |
Coverage and strength of carbon pricing |
See main text of this report |
|
No |
|||||||||||
|
4.7 |
Use of carbon pricing revenues |
See main text of this report |
|
No |
|||||||||||
|
|
|||||||||||||||
|
|
|||||||||||||||
Box 25 – Annual number of newspaper articles reporting on health and climate change, by regions in Australia, 2008–2019
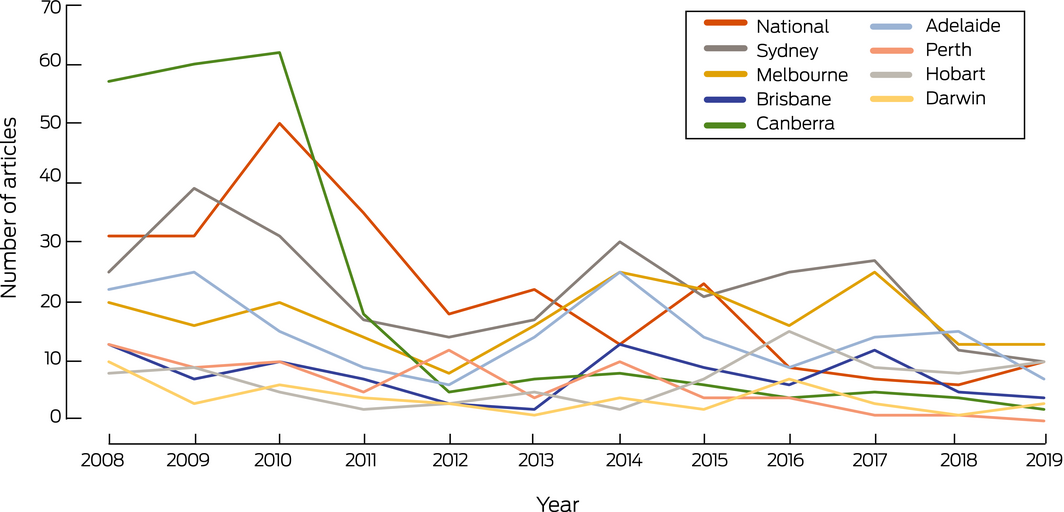
Note: 2019 is part year, to 17 May.
Box 27 – Summary of progress on Australian climate change public and political engagement
|
Indicator number |
Indicator name |
Previous value* |
Current value* |
Change |
Progress |
||||||||||
|
|
|||||||||||||||
|
5.1 |
Media coverage of health and climate change |
103 |
65 |
− 36% |
No |
||||||||||
|
5.2 |
Coverage of health and climate change in scientific journals |
56 |
66 |
+ 18% |
Yes |
||||||||||
|
5.3 |
Engagement in health and climate change in Australian government |
0 |
0 |
0 |
No |
||||||||||
|
5.4 |
Engagement in health and climate change in Australian corporate sector |
106† |
130† |
+ 23% |
Yes |
||||||||||
|
|
|||||||||||||||
|
*Previous value is 2017 and current value is 2018 unless otherwise indicated.†Previous value is the number of active organisations in 2017 and current value is the number of active organisations in 2018. |
|||||||||||||||
Provenance: Not commissioned; externally peer reviewed.
- Paul J Beggs1
- Ying Zhang2
- Hilary Bambrick3
- Helen L Berry2
- Martina K Linnenluecke1
- Stefan Trueck1
- Peng Bi4
- Sinead M Boylan2
- Donna Green5
- Yuming Guo6
- Ivan C Hanigan2
- Fay H Johnston7
- Diana L Madden8
- Arunima Malik2
- Geoffrey G Morgan9
- Sarah Perkins‐Kirkpatrick5
- Lucie Rychetnik10
- Mark Stevenson11
- Nick Watts12
- Anthony G Capon2
- 1 Macquarie University, Sydney, NSW
- 2 University of Sydney, Sydney, NSW
- 3 Queensland University of Technology, Brisbane, QLD
- 4 University of Adelaide, Adelaide, SA
- 5 Climate Change Research Centre, UNSW, Sydney, NSW
- 6 Monash University, Melbourne, VIC
- 7 Menzies Institute for Medical Research, University of Tasmania, Hobart, TAS
- 8 University of Notre Dame Australia, Sydney, NSW
- 9 University Centre for Rural Health, University of Sydney, Lismore, NSW
- 10 Menzies Centre for Health Policy, University of Sydney, Sydney, NSW
- 11 University of Melbourne, Melbourne, VIC
- 12 Institute of Global Health, University College London, London, UK
We thank Dr Elizabeth Ebert (Australian Bureau of Meteorology) for contributing indicator 2.4 (Climate information services for health) and Bronwyn Brown for assistance with Google Analytics for that indicator. For indicator 1.2 (Exposure to temperature change) and indicator 1.3 (Health effects of heatwaves) we thank Robert Fawcett who conducted the analysis and wrote the text with assistance from Elizabeth Ebert and John Nairn (all from the Australian Bureau of Meteorology). Material for the Supporting Information for indicator 1.5 (Mental health) was prepared by Helen Berry (University of Sydney) and Lennart Reifels, Suzanne Mavoa, and Hamish Bignell (University of Melbourne). Lennart Reifels contributed to data acquisition and coordination of the background scientific project. Suzanne Mavoa led the sourcing and analysis of temperature data and building of the database. She is supported by an Australian National Health and Medical Research Council Early Career Fellowship (1121035). Hamish Bignell undertook the analysis of the temperature data and contributed to building the database. We acknowledge the work of Zahra Borghei Ghomi who worked as a research assistant on compiling the relevant information for Section 3. Richard Broome and Joshua Horsley provided advice related to the calculation of the attributable number of premature deaths for indicator 3.5.2. In relation to Box 11, we acknowledge members of the Climate Change and Health Working Group, Medical Education Curriculum Committee, Medical Deans Australia and New Zealand. We thank Jonathan Chambers, Tord Kjellstrom and Bruno Lemke for the Australian data used for indicator 1.4 (Change in labour capacity), and Yang Liu and Bryan Vu for the Australian data used for indicator 1.6 (Wildfire exposure).
No relevant disclosures.
- 1. Austin EK, Handley T, Kiem AS, et al. Drought‐related stress among farmers: findings from the Australian Rural Mental Health Study. Med J Aust 2018; 209: 159–165. https://www.mja.com.au/journal/2018/209/4/drought-related-stress-among-farmers-findings-australian-rural-mental-health.
- 2. Hanigan IC, Schirmer J, Niyonsenga T. Drought and distress in Southeastern Australia. EcoHealth 2018; 15: 642–655.
- 3. Longman JM, Bennett‐Levy J, Matthews V, et al. Rationale and methods for a cross‐sectional study of mental health and wellbeing following river flooding in rural Australia, using a community‐academic partnership approach. BMC Public Health 2019; 19: 1255.
- 4. Commonwealth Scientific and Industrial Research Organisation. Australian national outlook 2019. CSIRO, 2019. https://www.csiro.au/en/Showcase/ANO (viewed Oct 2019).
- 5. Australian Medical Association (AMA). Climate change is a health emergency. Canberra: AMA, 2019. https://ama.com.au/media/climate-change-health-emergency (viewed Sept 2019).
- 6. Watts N, Amann M, Ayeb‐Karlsson S, et al. The Lancet Countdown on health and climate change: from 25 years of inaction to a global transformation for public health. Lancet 2018; 391: 581–630.
- 7. Watts N, Amann M, Arnell N, et al. The 2018 report of the Lancet Countdown on health and climate change: shaping the health of nations for centuries to come. Lancet 2018; 392: 2479–2514.
- 8. Beggs PJ, Zhang Y. The MJA–Lancet Countdown on health and climate change: Australian policy inaction threatens lives. Med J Aust 2018; 209: 474–475. https://www.mja.com.au/journal/2018/209/11/mja-lancet-countdown-health-and-climate-change-australian-policy-inaction.
- 9. Zhang Y, Beggs PJ. The Lancet Countdown down under: tracking progress on health and climate change in Australia. Med J Aust 2018; 208: 285–286. https://www.mja.com.au/journal/2018/208/7/lancet-countdown-down-under-tracking-progress-health-and-climate-change.
- 10. Zhang Y, Beggs PJ, Bambrick H, et al. The MJA–Lancet Countdown on health and climate change: Australian policy inaction threatens lives. Med J Aust 2018; 209(474): 474.e1–474.e21. https://www.mja.com.au/journal/2018/209/11/mja-lancet-countdown-health-and-climate-change-australian-policy-inaction.
- 11. Watts N, Amann M, Arnell N, et al. The 2019 report of The Lancet Countdown on health and climate change. Lancet 2019; 394: 1836‐1878.
- 12. Mitchell D, Heaviside C, Vardoulakis S, et al. Attributing human mortality during extreme heat waves to anthropogenic climate change. Environ Res Lett 2016; 11: 074006.
- 13. Ebi KL, Ogden NH, Semenza JC, Woodward A. Detecting and attributing health burdens to climate change. Environ Health Perspect 2017; 125: 085004.
- 14. Stone D, Auffhammer M, Carey M, et al. The challenge to detect and attribute effects of climate change on human and natural systems. Clim Change 2013; 121: 381–395.
- 15. Australian Bureau of Statistics. Australian Aboriginal and Torres Strait Islander health survey: nutrition results ‐ food and nutrients, 2012‐13. Canberra: ABS, 2015. (Cat. No. 4727.0.55.005) http://www.abs.gov.au/AUSSTATS/abs@.nsf/DetailsPage/4727.0.55.0052012-13?OpenDocument (viewed July 2019).
- 16. Australian Institute of Family Studies. Food insecurity in Australia: what is it, who experiences it and how can child and family services support families experiencing it? Melbourne: AIFS, 2011. https://aifs.gov.au/cfca/publications/food-insecurity-australia-what-it-who-experiences-it-and-how-can-child (viewed July 2019).
- 17. Wildfire Today [website]. https://wildfiretoday.com/tag/australia/ (viewed July 2019).
- 18. Killick D. Think Hobart's bad? Bushfire smoke levels in Cygnet spark a public health warning. The Mercury 2019; 31 Jan. https://www.themercury.com.au/news/think-hobarts-bad-bushfire-smoke-levels-in-cygnet-spark-a-public-health-warning/news-story/3f5466bd2d9166e477fb6adaef21fdd0 (viewed July 2019).
- 19. Green D, Alexander L, McInnes K, et al. An assessment of climate change impacts and adaptation for the Torres Strait Islands, Australia. Clim Change 2010; 102: 405–433.
- 20. Rigby CW, Rosen A, Berry HL, Hart CR. If the land's sick, we're sick: the impact of prolonged drought on the social and emotional well‐being of Aboriginal communities in rural New South Wales. Aust J Rural Health 2011; 19: 249–254.
- 21. Nairn J, Fawcett R. Defining heatwaves: heatwave defined as a heat‐impact event servicing all community and business sectors in Australia (CAWCR Technical Report No. 060). CSIRO and Australian Government Bureau of Meteorology, 2013. http://www.bom.gov.au/research/publications/cawcrreports/CTR_060.pdf (viewed July 2019).
- 22. Nairn JR, Fawcett RJB. The excess heat factor: a metric for heatwave intensity and its use in classifying heatwave severity. Int J Environ Res Public Health 2015; 12: 227–253.
- 23. Zander KK, Moss S, Garnett ST. Climate change‐related heat stress and subjective well‐being in Australia. Weather Clim Soc 2019; 11: 505–520.
- 24. Jolly WM, Cochrane MA, Freeborn PH, et al. Climate‐induced variations in global wildfire danger from 1979 to 2013. Nat Commun 2015; 6: 7537.
- 25. Westerling AL. Increasing western US forest wildfire activity: sensitivity to changes in the timing of spring. Philos Trans R Soc Lond B Biol Sci 2016; 371: 20150178.
- 26. Bowman DMJS, Williamson GJ, Abatzoglou JT, et al. Human exposure and sensitivity to globally extreme wildfire events. Nat Ecol Evol 2017; 1: 0058.
- 27. Lannom KO, Tinkham WT, Smith AMS, et al. Defining extreme wildland fires using geospatial and ancillary metrics. Int J Wildland Fire 2014; 23: 322–337.
- 28. Doerr SH, Santín C. Global trends in wildfire and its impacts: perceptions versus realities in a changing world. Philos Trans R Soc Lond B Biol Sci 2016; 371: 20150345.
- 29. Liu JC, Mickley LJ, Sulprizio MP, et al. Particulate air pollution from wildfires in the Western US under climate change. Clim Change 2016; 138: 655–666.
- 30. Ford B, Val Martin M, Zelasky SE, et al. Future fire impacts on smoke concentrations, visibility, and health in the contiguous United States. GeoHealth 2018; 2: 229–247.
- 31. Knorr W, Dentener F, Hantson S, et al. Air quality impacts of European wildfire emissions in a changing climate. Atmos Chem Phys 2016; 16: 5685–5703.
- 32. Horsley JA, Broome RA, Johnston FH, et al. Health burden associated with fire smoke in Sydney, 2001‐2013. Med J Aust 2018; 208: 309–310.
- 33. Montoya D. Bushfires in NSW: timelines and key sources. Sydney: New South Wales Parliament, 2014. https://www.parliament.nsw.gov.au/researchpapers/Documents/bushfires-in-nsw-timelines-and-key-sources/Bushfires%20in%20NSW%20-%20timelines%20and%20key%20sources.pdf (viewed July 2019).
- 34. Mariani M, Holz A, Veblen TT, et al. Climate change amplifications of climate‐fire teleconnections in the Southern Hemisphere. Geophys Res Lett 2018; 45: 5071–5081.
- 35. Williamson GJ, Prior LD, Jolly WM, et al. Measurement of inter‐ and intra‐annual variability of landscape fire activity at a continental scale: the Australian case. Environ Res Lett 2016; 11: 035003.
- 36. Australian Government Department of Health. National Notifiable Diseases Surveillance System. Canberra: Commonwealth of Australia, 2019. http://www9.health.gov.au/cda/source/cda-index.cfm (viewed July 2019).
- 37. Mordecai EA, Caldwell JM, Grossman MK, et al. Thermal biology of mosquito‐borne disease. Ecol Lett 2019; 22: 1690–1708.
- 38. Tall JA, Gatton ML. Flooding and arboviral disease: predicting Ross River virus disease outbreaks across inland regions of south‐eastern Australia. J Med Entomol 2019; tjz120. https://doi.org/10.1093/jme/tjz120.
- 39. Flies EJ, Lau CL, Carver S, Weinstein P. Another emerging mosquito‐borne disease? Endemic Ross River virus transmission in the absence of marsupial reservoirs. BioScience 2018; 68: 288–293.
- 40. Madden DL, McLean M, Horton GL. Preparing medical graduates for the health effects of climate change: an Australasian collaboration. Med J Aust 2018; 208: 291–292. https://www.mja.com.au/journal/2018/208/7/preparing-medical-graduates-health-effects-climate-change-australasian.
- 41. Armstrong F, Cooke S, Rissik D, Tonmoy F. Queensland climate adaptation strategy: human health and wellbeing climate change adaptation plan for Queensland. Brisbane: Queensland Government, 2018.
- 42. Climate and Health Alliance. Framework for a national strategy on climate, health and well‐being for Australia. Melbourne: CAHA, 2017. https://www.caha.org.au/national_strategy_framework_launch (viewed Oct 2019).
- 43. Garnaut R. The Garnaut climate change review: final report. Cambridge: Cambridge University Press, 2008.
- 44. Steffen W, Vertessy R, Dean A, et al. Deluge and drought: water security in a changing climate. Sydney: Climate Council, 2018. https://www.climatecouncil.org.au/resources/water-security-report/ (viewed Oct 2019).
- 45. Steffen W, Dean A, Rice M. Weather gone wild: climate change‐fuelled extreme weather in 2018. Sydney: Climate Council, 2019.
- 46. Hughes L, Mullins G, Rice M, Dean A. Escalating Queensland bushfire threat: interim conclusions. Sydney: Climate Council, 2018.
- 47. International Energy Agency. Indicators for CO2 emissions (Edition 2018). Paris: IEA, 2018. (https://doi.org/10.1787/477da1bc-en). https://www.oecd-ilibrary.org/content/data/477da1bc-en (viewed July 2019).
- 48. International Energy Agency. Coal statistics. Paris: IEA, 2016. https://www.iea.org/topics/coal/statistics/ (viewed July 2019).
- 49. International Energy Agency. Coal 2018: analysis and forecasts to 2023. Paris: IEA, 2018. https://www.iea.org/coal2018/ (viewed July 2019).
- 50. International Energy Agency. IEA atlas of energy. Paris: IEA, 2016. http://energyatlas.iea.org/#!/tellmap/2020991907/2 (viewed July 2019).
- 51. International Energy Agency. OECD – electricity and heat generation. Paris: IEA, 2016. https://www.oecd-ilibrary.org/content/data/data-00457-en (viewed July 2019).
- 52. Australian Energy Council. Germany: renewables rise as share of greenhouse gas emissions plateau. Melbourne: AEC, 2019. https://www.energycouncil.com.au/analysis/germany-renewables-rise-as-share-of-greenhouse-gas-emissions-plateau/ (viewed July 2019).
- 53. Enerdata [website]. https://www.enerdata.net/energy-research-information-database-free-trial.html (viewed July 2019).
- 54. Clean Energy Council. Clean energy Australia: report 2019. Melbourne: CEC, 2019. https://assets.cleanenergycouncil.org.au/documents/resources/reports/clean-energy-australia/clean-energy-australia-report-2019.pdf (viewed July 2019).
- 55. Clean Energy Council. Clean energy Australia: report 2018. Melbourne: CEC, 2018. https://assets.cleanenergycouncil.org.au/documents/resources/reports/clean-energy-australia/clean-energy-australia-report-2018.pdf (viewed Oct 2019).
- 56. Clean Energy Regulator. Small‐scale Renewable Energy Scheme. Canberra: CER, 2018. http://www.cleanenergyregulator.gov.au/RET/About-the-Renewable-Energy-Target/How-the-scheme-works/Small-scale-Renewable-Energy-Scheme (viewed July 2019).
- 57. Clean Energy Regulator. Postcode data for small‐scale installations. Canberra: CER, 2019. http://www.cleanenergyregulator.gov.au/RET/Forms-and-resources/Postcode-data-for-small-scale-installations#Smallscale-installations-by-installation-year (viewed July 2019).
- 58. Infrastructure Australia. Remote and indigenous communities: Australian infrastructure plan. Sydney: IA, 2016. https://www.infrastructureaustralia.gov.au/sites/default/files/2019-06/ia_j16-2330_fact_sheet_remote_and_indigenous_v1.1.pdf (viewed Sept 2019).
- 59. ClimateWorks Australia. The state of electric vehicles in Australia. Second report: driving momentum in electric mobility. Melbourne: ClimateWorks Australia, 2018. https://www.climateworksaustralia.org/sites/default/files/documents/publications/climateworks_australia_state_of_electric_vehicles2_june_2018.pdf (viewed Oct 2019).
- 60. Bureau of Infrastructure, Transport and Regional Economics. Australian infrastructure statistics — yearbook 2018. Canberra: BITRE, 2018. https://www.bitre.gov.au/publications/2018/yearbook_2018.aspx (viewed Oct 2019).
- 61. Malik A, Lenzen M, McAlister S, McGain F. The carbon footprint of Australian health care. Lancet Planet Health 2018; 2: e27–e35.
- 62. Australian Institute of Health and Welfare. Health expenditure Australia 2016–17 (Health and Welfare Expenditure Series No. 64; Cat. No. HWE 74). Canberra: AIHW, 2018. https://www.aihw.gov.au/reports/health-welfare-expenditure/health-expenditure-australia-2016-17/contents/data-visualisation (viewed July 2019).
- 63. Australian Institute of Health and Welfare. Australia's health performance framework: accessibility. Canberra: AIHW, 2019. https://www.aihw.gov.au/reports-data/indicators/australias-health-performance-framework/national/national/access/accessibility (viewed Sept 2019).
- 64. Pichler P‐P, Jaccard IS, Weisz U, Weisz H. International comparison of health care carbon footprints. Environ Res Lett 2019; 14: 064004.
- 65. McGain F. Five ways hospitals can reduce their environmental footprint. The Conversation 2018; 24 May. http://theconversation.com/five-ways-hospitals-can-reduce-their-environmental-footprint-90390 (viewed July 2019).
- 66. Linnenluecke MK, Han J, Pan Z, Smith T. How markets will drive the transition to a low carbon economy. Econ Model 2019; 77: 42–54.
- 67. Australian Energy Regulator. State of the energy market 2018. Melbourne: AER, 2018. https://www.aer.gov.au/publications/state-of-the-energy-market-reports/state-of-the-energy-market-2018 (viewed July 2019).
- 68. Australian Energy Market Operator. Generation information. Melbourne: AEMO, 2019. http://aemo.com.au/Electricity/National-Electricity-Market-NEM/Planning-and-forecasting/Generation-information (viewed July 2019).
- 69. World Coal. AGL completes first stage of Bayswater power plant upgrade. 7 Jan 2019. https://www.worldcoal.com/power/07012019/agl-completes-first-stage-of-bayswater-power-plant-upgrade/ (viewed July 2019).
- 70. Australian Bureau of Statistics. Employment in renewable energy activities, Australia, 2017‐18 (Cat. No. 4631.0). Canberra: ABS, 2019. https://www.abs.gov.au/ausstats/abs@.nsf/mf/4631.0 (viewed July 2019).
- 71. Arabella Advisors. The global fossil fuel divestment and clean energy investment movement: 2018 report. Washington, DC: Arabella Advisors, 2018. https://www.arabellaadvisors.com/wp-content/uploads/2018/09/Global-Divestment-Report-2018.pdf (viewed July 2019).
- 72. Fossil Free Australia. Divestment. Fossil Free Australia, 2019. https://gofossilfree.org.au/divestment/#divested (viewed July 2019).
- 73. Australian Government Department of the Environment and Energy. The safeguard mechanism – overview. Canberra: Commonwealth of Australia, 2016. http://www.environment.gov.au/climate-change/government/emissions-reduction-fund/publications/factsheet-erf-safeguard-mechanism (viewed July 2019).
- 74. Australian Government Department of the Environment and Energy. Climate Solutions Fund – Emissions Reduction Fund. Canberra: Commonwealth of Australia, 2019. http://www.environment.gov.au/climate-change/government/emissions-reduction-fund (viewed July 2019).
- 75. OECD and World Bank Group. The FASTER principles for successful carbon pricing: an approach based on initial experience. Washington, DC and Paris: OECD and WBG, 2015. http://documents.worldbank.org/curated/en/901041467995665361/pdf/99570-WP-PUBLIC-DISCLOSE-SUNDAY-SEPT-20-4PM-CarbonPricingPrinciples-1518724-Web.pdf (viewed Oct 2019).
- 76. Australian Government Department of the Environment and Energy. Emissions Reduction Fund update. Canberra: Commonwealth of Australia, 2019. http://www.environment.gov.au/climate-change/publications/emissions-reduction-fund-update (viewed July 2019).
- 77. Bureau of Meteorology. Australia in January 2019. Melbourne: BOM, 2019. http://www.bom.gov.au/climate/current/month/aus/archive/201901.summary.shtml (viewed July 2019).
- 78. Berry HL, Waite TD, Dear KBG, et al. The case for systems thinking about climate change and mental health. Nat Clim Chang 2018; 8(4): 282–290.
Summary