


There exists a common belief that sleep duration is declining. This appears supported by results of online polls that indicate average sleep duration in Australia has declined by 1 hour over the past decade.1,2 Short sleep duration (≤ 6 hours nightly) is associated with risk of premature mortality,3 cardiovascular events,4,5 obesity,6,7 accident and injury,8 and mental health problems.9 Declining sleep duration could therefore pose a threat to public health.
However, scientific evidence for secular changes in sleep is scarce. Data from other countries are equivocal, showing either no change10-12 or a decrease in sleep duration.13,14 Some studies point to declines in certain sociodemographic groups; for example, working-aged men13 and younger middle-aged women.15 We therefore aimed to determine whether sleep duration among Australian adults (defined here as ≥ 15 years of age) has declined over recent years and to identify any sociodemographic groups that are sleeping less.
Nationally representative data were obtained from repeated cross-sectional time-use surveys conducted by the Australian Bureau of Statistics (ABS) in 1992, 1997 and 2006.16-18 Private households were selected for the surveys by multistage cluster sampling. Household information was collected from one household member by an interviewer. Time-use diaries were left for all adults in the household to complete and return by post. The diaries were 24-hour activity logs with 5-minute intervals. Respondents completed the diaries on two consecutive days assigned by the ABS. Activities were described with free responses and later coded into standard activities by the ABS.19-21 The surveys were conducted over four 2-week periods throughout each year (Box 1).
Sleep duration was defined as the total time spent sleeping in each 24-hour period, averaged over the number of data collection days. Response rates at both the household and person level were 84% or higher. Respondents for whom diaries were missing sleep duration were excluded (< 2% of person-days in each survey), and data for 21 195 respondents were included in the analysis (Box 1). Differences in sleep duration were explored by sex, age, marital status, area of residence, highest level of education, income, hours worked per week, current study status (eg, studying full-time), being a carer (ie, providing unpaid care and support to relatives or friends who are older or disabled), and number of children aged ≤ 14 years in the household.
Mean sleep duration in 1992 was 8 h 20 min (SEM, 1 min), which increased by 13 min (95% CI, 10–16 min) to 8 h 33 min (SEM, 1 min) in 1997. Mean sleep duration increased from 1992 to 2006 by 10 min (95% CI, 7–13 min) to 8 h 30 min (SEM, 1 min), but there was no significant change in sleep duration from 1992 to 2006 after adjustment for sampling during weekends and different seasons (adjusted difference, 2 min; 95% CI, − 2 to 5 min; P = 0.33).
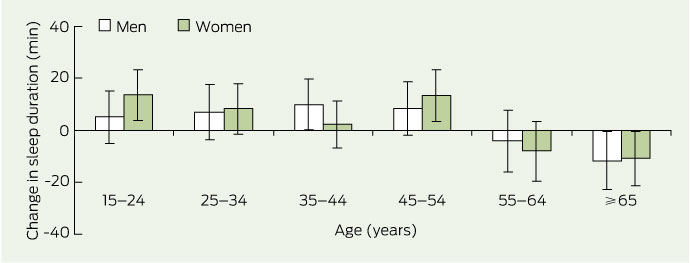
Sleep duration was unchanged over the study period in most age groups, but it decreased significantly in people aged ≥ 65 years (adjusted difference, 12 min; 95% CI, 4–19 min; P < 0.001) (Box 2), for whom mean sleep duration in 2006 was 8 h 17 min (SEM, 3 min). There were no significant changes by sex or marital status. Sleep duration increased slightly in people from major urban areas (4 min; 95% CI, 0–8 min; P = 0.06) but was unchanged in people from other areas.
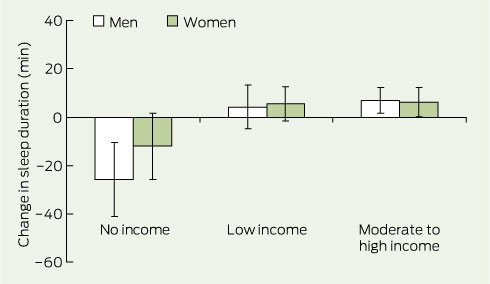
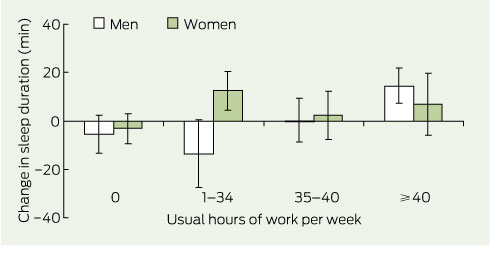
There was a differential effect of level of income on change in sleep duration, which was more pronounced in men. For men and women combined, sleep increased in moderate to high income earners (9 min; 95% CI, 3–15 min; P < 0.001) and was unchanged in those with low incomes. There was a decrease in those with no income (adjusted difference, 17 min; 95% CI, 7–27 min; P = 0.001), for whom mean sleep duration in 2006 was 8 h 14 min (SEM, 5 min); the decrease was concentrated in men and not significant in women (Box 3). Sleep was unchanged in people who were not working or who were working full-time (35–40 h per week) (Box 4). There was an interaction effect between usual work hours and gender (P < 0.001). Women who worked part-time slept less than men in the same category in 1992 (8 h 13 min [SEM, 3 min] v 8 h 31 min [SEM, 5 min]), but there was no longer a difference by 2006 (8 h 26 min [SEM, 3 min] v 8 h 28 min [SEM, 5 min], respectively). Similarly, men who worked ≥ 40 h slept less than women in the same category in 1992 (7 h 56 min [SEM, 3 min] v 8 h 6 min [SEM, 5 min]), but there was no longer a difference by 2006 (8 h 11 min [SEM, 3 min] v 8 h 13 min [SEM, 4 min], respectively).
Sleep duration increased slightly in people who were not carers (5 min; 95% CI, 1–8 min; P = 0.006) and decreased by 31 min (95% CI, 9–53 min; P = 0.002) for male carers. However, in 2006, the sleep duration of female carers was 8 h 9 min (SEM, 3 min) and of male carers was 8 h 6 min (SEM, 4 min). Although sleep duration was shorter in people with two or more children in the household, this effect did not change over time.
Our finding that sleep duration did not change for most Australian adults is consistent with British10 and American12 data. There may, however, be variation by country or latitude. For example, sleep duration in Finland has decreased by about 5 minutes per decade since the 1960s, and this decline is most evident in working-aged men.13 In contrast, our results suggest that decreased sleep duration is concentrated in men with no income.
The decrease in sleep duration in people aged ≥ 65 years could be due to an ageing population.22 This age group is older on average than it used to be and is more prone to health problems that affect sleep.
Recent technological developments have been blamed for the purported decline in sleep.23,24 However, over the period we examined, ownership of computers has doubled, mobile phone ownership has tripled, and household access to the internet has increased from essentially nil to 60%,25 but we found no corresponding loss of sleep. If there is an impact of technology use on sleep, it is not evident at a population level or it may affect another aspect of sleep (eg, quality or timing of sleep).
We found sleep durations for weekdays and weekends in all survey years to be about an hour longer than those reported for 18–64-year-old residents of New South Wales who completed a postal survey during 2000.26 Compared with our study, selection and information bias were more likely in the NSW study; it had a much lower response rate (34%) and its stated focus was sleep and traffic accidents. In addition, our study used sleep duration data derived from time-use data (which included naps), whereas the NSW study used single estimates of the number of hours slept; thus sleep duration is likely to be longer in our study. This does not affect the validity of the findings, as it would only affect secular changes in the unlikely event of people across all demographics substituting naps for night-time sleep in a consistent fashion. The advantage of the time-use estimate is that it is likely to be free from reporting bias because sleep is not the focus of each diary.
Limitations of our study include the lack of an indicator of sleep quality, which may have changed despite unchanged sleep duration.15 Also, it is unclear whether the small but statistically significant changes of a few minutes that we detected in some sociodemographic groups are of significance to health. Furthermore, there is potential for false-positive findings due to the multiple statistical comparisons made here (P values of 0.05 were used throughout). Strengths of our study include the use of nationally representative data, high response rates, exploration of a large number of socio-demographic variables, and an unbiased estimate of sleep duration.
1 Survey periods and response rates of the time-use surveys
24 Feb – 7 Mar 25 May – 6 Jun 28 Sep – 10 Oct 23 Nov – 5 Dec |
20 Feb – 4 Mar 24 Apr – 6 May 26 June – 8 Jul 23 Oct – 4 Nov |
||||||||||||||
* Respondents for whom diaries were missing sleep duration were excluded. |
|||||||||||||||
Received 15 March 2011, accepted 14 July 2011
- Yu Sun Bin1
- Nathaniel S Marshall2
- Nicholas S Glozier1
- 1 Sydney Medical School, University of Sydney, Sydney, NSW.
- 2 Centre for Integrated Research and Understanding of Sleep, Woolcock Institute of Medical Research, University of Sydney, Sydney, NSW.
Yu Sun Bin is supported by a PhD scholarship from the National Health and Medical Research Council Centre for Integrated Research and Understanding of Sleep.
Nicholas Glozier has received funding from Servier Laboratories for research and travel, and consultancy fees from sanofi-aventis.
- 1. Australian Broadcasting Corporation. The National Sleep Research Project. 2000. http://www.abc.net.au/science/sleep/default.htm (accessed Feb 2011).
- 2. Australian Broadcasting Corporation. Big sleep survey. 2010. http://www.sleepsurvey.net.au/the-sleep-survey/results (accessed Feb 2011).
- 3. Gallicchio L, Kalesan B. Sleep duration and mortality: a systematic review and meta-analysis. J Sleep Res 2009; 18: 148-158.
- 4. Chien KL, Chen PC, Hsu HC, et al. Habitual sleep duration and insomnia and the risk of cardio-vascular events and all-cause death: report from a community-based cohort. Sleep 2010; 33: 177-184.
- 5. Amagai Y, Ishikawa S, Gotoh T, et al. Sleep duration and incidence of cardiovascular events in a Japanese population: the Jichi Medical School Cohort Study. J Epidemiol 2010; 20: 106-110.
- 6. Cappuccio FP, Taggart FM, Kandala N-B, et al. Meta-analysis of short sleep duration and obesity in children and adults. Sleep 2008; 31: 619-626.
- 7. Marshall NS, Glozier N, Grunstein RR. Is sleep duration related to obesity? A critical review of the epidemiological evidence. Sleep Med Rev 2008; 12: 289-298.
- 8. Choi SW, Peek-Asa C, Sprince NL, et al. Sleep quantity and quality as a predictor of injuries in a rural population. Am J Emerg Med 2006; 24: 189-196.
- 9. Glozier N, Martiniuk A, Patton G, et al. Short sleep duration in prevalent and persistent psychological distress in young adults: the DRIVE Study. Sleep 2010; 33: 1139-1145.
- 10. Groeger J, Zijlstra F, Dijk D. Sleep quantity, sleep difficulties and their perceived consequences in a representative sample of some 2000 British adults. J Sleep Res 2004; 13: 359-371.
- 11. Tune GS. Sleep and wakefulness in 509 normal human adults. Br J Med Psychol 1969; 42: 75-80.
- 12. Knutson KL, Van Cauter E, Rathouz PJ, et al. Trends in the prevalence of short sleepers in the USA: 1975–2006. Sleep 2010; 33: 37-45.
- 13. Kronholm E, Partonen T, Laatikainen T, et al. Trends in self-reported sleep duration and insomnia-related symptoms in Finland from 1972 to 2005: a comparative review and re-analysis of Finnish population samples. J Sleep Res 2008; 17: 54-62.
- 14. Centers for Disease Control and Prevention. QuickStats: percentage of adults aged >18 years who reported an average of <6 hours of sleep per 24-hour period, by sex and age group — National Health Interview Survey, United States, 1985 and 2006. 2008. http://www.cdc.gov/mmwr/preview/mmwrhtml/mm5708a8.htm (accessed Feb 2011).
- 15. Rowshan Ravan A, Bengtsson C, et al. Thirty-six-year secular trends in sleep duration and sleep satisfaction, and associations with mental stress and socioeconomic factors — results of the Population Study of Women in Gothenburg, Sweden. J Sleep Res 2010; 19: 496-503.
- 16. Australian Bureau of Statistics. Information paper: time use survey, Australia, 1992. Canberra: ABS, 1992. (ABS Cat. No. 4151.0.) http://www.abs.gov. au/AUSSTATS/abs@.nsf/DetailsPage/4151.01992? OpenDocument (accessed Feb 2011).
- 17. Australian Bureau of Statistics. Information paper: time use survey, basic CURF, Australia, 1997. Canberra: ABS, 1999. (ABS Cat. No. 4151.0.) http://www.abs.gov.au/AUSSTATS/abs@.nsf/Details Page/4151.01997?OpenDocument (accessed Feb 2011).
- 18. Australian Bureau of Statistics. Time use survey: user guide, 2006. Canberra: ABS, 2008. (ABS Cat. No. 4150.0.) http://www.abs.gov.au/AUSSTATS/abs@.nsf/DetailsPage/4150.02006?Open Document (accessed Feb 2011).
- 19. Australian Bureau of Statistics. Time use survey, Australia, 1992: user’s guide. Canberra: ABS, 1993.
- 20. Australian Bureau of Statistics. Time use survey: user guide, 2006. Canberra: ABS, 2008. (ABS Cat. No. 4150.0.) http://www.abs.gov.au/AUSSTATS/abs@.nsf/Lookup/4150.0Main+Features12006? OpenDocument (accessed Mar 2011).
- 21. Australian Bureau of Statistics. Time use survey, Australia — users’ guide, 1997. Canberra: ABS, 1998. (ABS Cat. No. 4150.0.) http://www.abs.gov.au/AUSSTATS/abs@.nsf/Lookup/4150.0Main+ Features11997?OpenDocument (accessed Mar 2011).
- 22. Australian Bureau of Statistics. Population by age and sex, Australian states and territories, Jun 2010. Canberra: ABS, 2010. (ABS Cat. No. 3201.0.) http://www.abs.gov.au/ausstats/abs@.nsf/mf/3201.0 (accessed Mar 2011).
- 23. Ban DJ, Lee TJ. Sleep duration, subjective sleep disturbances and associated factors among university students in Korea. J Korean Med Sci 2001; 16: 475-480.
- 24. Thomee S, Dellve L, Harenstam A, Hagberg M. Perceived connections between information and communication technology use and mental symptoms among young adults — a qualitative study. BMC Public Health 2010; 10: 66.
- 25. Australian Bureau of Statistics. Australian social trends, 2007. Canberra: ABS, 2007. (ABS Cat. No. 4102.0.) http://www.abs.gov.au/ausstats/abs@.nsf/0/0485BB5550FE5799CA25732C 00207C77?opendocument (accessed Feb 2011).
- 26. Bartlett DJ, Marshall NS, Williams A, Grunstein RR. Sleep health New South Wales: chronic sleep restriction and daytime sleepiness. Intern Med J 2008; 38: 24-31.
Abstract
Objective: To determine whether sleep duration of Australian adults has declined over recent years.
Design: Analysis of nationally representative data from repeated cross-sectional time-use surveys conducted in 1992, 1997 and 2006.
Setting: Private households in Australia.
Participants: Respondents aged 15 years and over (N = 21 195) who completed time-use diaries over two consecutive days.
Main outcome measure: Change in sleep duration by sociodemographic group.
Results: Mean sleep duration was 8 h 20 min in 1992, 8 h 33 min in 1997, and 8 h 30 min in 2006 (SEM for all years, 1 min). After adjustment for sampling during weekends and different seasons, there was no significant change in sleep duration from 1992 to 2006 (adjusted difference, 2 min; 95% CI, − 2 to 5 min; P = 0.33). The only significant decreases in sleep duration were observed in people aged 65 years and over (adjusted difference, 12 min; 95% CI, 4–19 min; P < 0.001), people with no income (adjusted difference, 17 min; 95% CI, 7–27 min; P = 0.001) and male carers (adjusted difference, 31 min; 95% CI, 9–53 min; P = 0.002), although people in these groups reported over 8 h sleep on average.
Conclusions: Most Australian adults were not sleeping less in 2006 than they did in 1992. Public health concerns over declining sleep duration do not appear to be warranted. Investigation of possible changes in quality of sleep is required.