


The association between maternal obesity and adverse pregnancy outcomes is well described,1-5 although underlying causes are less well characterised.6,7 Despite the widespread use of catchphrases such as “obesity epidemic”, temporal trends in body mass index (BMI) during pregnancy in Australia remain poorly described. We previously published the largest Australian cohort study of BMI and pregnancy outcomes, in 11 252 women who gave birth to singletons between 1998 and 2002 at the Mater Mothers’ Hospital (MMH), a tertiary referral maternity hospital in Brisbane.8 Another small Australian cohort report recently noted a 43% prevalence of overweight and obesity in pregnant women.9 Here, we aimed to define recent temporal trends in BMI distribution and to examine the contribution of BMI to a broad, clinically relevant spectrum of pregnancy outcomes, including some less frequent events, such as perinatal mortality, that were not sufficiently addressed in our previous report.
The study was granted ethics approval by the Mater Health Services Human Research Ethics Committee.
The data collection methods were similar to those used previously.8 Antenatal BMI was derived from self-reported pre-pregnancy maternal height and weight recorded at the first antenatal visit (generally at 12–16 weeks’ gestation). De-identified data on maternal characteristics and maternal and neonatal pregnancy outcomes were extracted from routinely collected clinical data in MMH databases.
Maternal BMI was categorised according to World Health Organization recommendations10,11 into six groups: underweight (< 18.5 kg/m2); normal (18.5–< 25 kg/m2); overweight (25–< 30 kg/m2); obese class I (30–< 35 kg/m2); obese class II (35–< 40 kg/m2) and obese class III (≥ 40 kg/m2). Ethnic-specific BMI cut-offs were not used,11 but ethnicity was considered in the adjusted analyses.
Hypertension in pregnancy was classified according to the Australasian Society for the Study of Hypertension in Pregnancy,12 and gestational diabetes was defined according to the Australasian Diabetes in Pregnancy Society.13 Birthweight was classified as small for gestational age (< 10th centile), average for gestational age (10th–90th centile), or large for gestational age (> 90th centile). Births were classified according to both population-based standards (corrected for plurality, sex and gestational age at birth)14 and customised birthweight standards (adjusted additionally for maternal characteristics such as size [this varies between models, but generally includes height and/or weight and/or BMI], ethnicity and parity).15 Macrosomia (birthweight > 4000 g) is reported separately. Other outcomes were defined as noted in the hospital record and recorded in the databases.
Continuous variables are reported as mean and standard deviation or median and interquartile range, and categorical variables as number (%). Changes in BMI distribution over time, and the association of demographic characteristics and outcomes with BMI categories, were analysed using Cuzick’s test for trend.16
From January 1998 to December 2009, 87 292 singleton births occurred at MMH. Of these, 9153 were excluded due to missing maternal BMI data, and a further 2707 due to other missing data, primarily parity, leaving 75 432 births (86%) included in the analysis. Missing BMI data were more common in the first 2 years (< 10% of women were missing these data from 2000 on). As noted previously,8 women missing BMI data were more likely to have been transferred from other hospitals and have higher rates of maternal complications such as hypertension in pregnancy and gestational diabetes than those included in the study. They were more likely to deliver preterm, and their babies were twice as likely to require neonatal intensive care.
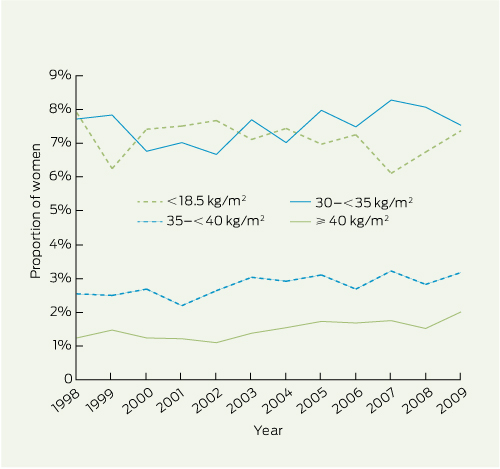
Although the distribution of maternal BMI changed significantly over the 12 years (P < 0.001), changes were generally small (Box 1). The proportions of women in the normal and overweight categories remained stable at around 60% and 20%, respectively. Class I obesity fell from 7.7% in 1998 to 7.5% in 2009, but class II obesity increased from 2.5% to 3.2%, and class III obesity from 1.2% to 2.0%. The proportion of underweight women declined from 7.9% to 7.4%. The number of women with class II or III obesity increased threefold from 147 in 1998 to 440 in 2009.
Demographic characteristics of the women are shown in Box 2. Underweight women were slightly younger than the other groups, with greater proportions of primiparas and women of Asian ethnicity. Smoking was least common in those of normal BMI (13%) and was substantially higher in both underweight (20%) and obese class III women (23%). The proportion of privately insured women was highest in the normal BMI (53%) and overweight (46%) groups. This was broadly similar to the distribution of BMI groups among Socio-Economic Indexes for Areas (SEIFA) quintiles,17 although a large proportion of underweight women were in higher SEIFA quintiles. The frequency of previous caesarean section increased with BMI in parous women.
Bivariate analysis showed that the frequency of hypertension in pregnancy, gestational diabetes, caesarean section, perinatal mortality, stillbirth and neonatal mortality increased with increasing BMI (Box 3). Preterm birth and neonatal morbidities including hypoglycaemia, jaundice, respiratory distress syndrome and neonatal intensive care unit admission were increased in babies born to overweight and obese women relative to the normal BMI group. The frequency of congenital anomalies was not related to maternal BMI in this cohort (P = 0.71; data not shown). The risk of babies being large for gestational age increased with increasing BMI, although this association was attenuated when customised measures were used. Using customised birthweight modelling, obese women also showed an increased risk of having small babies for gestational age.
These associations were largely confirmed in the multivariate analysis (Box 4). Hypertension in pregnancy, gestational diabetes, caesarean section and perinatal mortality remained strongly associated with maternal BMI. Preterm birth, stillbirth and neonatal death were clearly associated with maternal obesity when all obese women were grouped together.
For comparison with our cohort, the 2004–05 National Health Survey reported that 5% of all Australian women aged 25–44 years were underweight, 56% had a normal BMI, 24% were overweight, and 14% were obese.18 In contrast with the continuing increase in male obesity, there was a greater increase in obesity prevalence in women between 1989 and 2001 than between 2001 and 2004–05.18
Our study clearly confirms the burden of adverse pregnancy outcomes associated with maternal obesity. Serious maternal and neonatal complications, including perinatal mortality, are clearly associated with increasing maternal BMI. It is not clear why our analyses did not show an increase in congenital anomalies with increasing maternal BMI, as did our previous report,8 but this may relate in part to incomplete ascertainment of anomalies in routine data collection. A recent meta-analysis has confirmed the relationship between obesity and congenital anomalies.4 The association of obesity with preterm birth is controversial, with some reports suggesting a protective influence1 or varying effects in parous versus nulliparous women.2 However, two recent meta-analyses have concluded that obesity is associated with preterm birth.19,20
The potential causal pathways linking obesity and pregnancy complications remain ill defined. Recent results from the Hyperglycaemia and Adverse Pregnancy Outcome Study showed that the effects of maternal BMI are independent of maternal hyperglycaemia,21 although the two frequently coexist. Increased concentrations of non-glucose substrates may contribute to fetal overgrowth, and the low-level chronic “meta-inflammation” characteristic of obesity may also foster pregnancy complications.6,7,22,23
The frequently described association of maternal obesity with lower socioeconomic status and adverse health behaviour,18 such as smoking, was confirmed in our cohort. Although the mechanisms linking social disadvantage to adverse pregnancy outcomes are multifactorial,5 obesity is likely to be a major contributor.
The lack of proven interventions that can be instituted during pregnancy to improve outcomes in obese women remains frustrating.24 Improvements may arise through limitation of weight gain.25 Ideally, interventions should begin before pregnancy as part of preconception care.5-7,26 Data from pregnancies before and after bariatric surgery27 suggest that substantial weight reduction may reduce later infant adiposity and immediate pregnancy complications.
The major strength of our study lies in a large, consistently collected dataset over a period of 12 years. In addition to documenting maternal BMI, we collected a broad range of other potentially confounding variables and adjusted appropriately for these in our analysis. Although our study is not population-based, the MMH provides care for women in both public and private sectors across a broad risk profile and generally caters for around one in seven births in Queensland.28
However, our data have some important limitations. Although the BMI distribution of our cohort is similar to that in a contemporary Australian population study,18 we are unable to suggest that our cohort is representative of the Australian obstetric population as a whole. Referral patterns for women in some BMI classes may also have changed over time (eg, if referring hospitals became equipped to accommodate class I obese women). Our data were collected in the course of routine care, without rigorous data verification as in prospective studies. We verified the data by removing implausible values but were unable to cross-check entries against patient records. Ascertainment of some pregnancy complications, such as gestational diabetes, may be incomplete due to variable screening policies and practices in force over the 12 years. Although our BMI data are based on recalled pre-pregnancy weight and height, we have previously shown that such measures correlate well with objective data.8 Large-scale epidemiological data from the National Health and Nutrition Examination Survey in the United States29 demonstrate overall concordance of self-reported and measured BMI of 80%–90% for BMIs of 18.5–40 kg/m2, although misclassification is more common at the extremes of BMI. Our hospital database does not record maternal weight after the first visit, preventing analysis of pregnancy weight gain30 as a contributor to outcomes.
Although increasing maternal BMI is clearly associated with a broad spectrum of adverse maternal and neonatal pregnancy outcomes, the one “bright spot” in our data is the lack of marked temporal trend towards increasing maternal obesity in Australia. As noted in a recent US population study31 and Australian data,18 the rate of increase in obesity appears to have slowed in recent years in at least some groups. Despite this, obesity remains prevalent in women and is a potentially modifiable cause of serious adverse pregnancy outcomes.5 Our study demonstrates the clinical utility of recording maternal height and weight, and this is now routine in Queensland. Maternal BMI serves as a marker of pregnancy risk that can aid in the care of individual women and help plan appropriate allocation of maternity health care resources.
Received 29 August 2011, accepted 30 November 2011
- H David McIntyre1,2
- Kristen S Gibbons2
- Vicki J Flenady2
- Leonie K Callaway1,3
- 1 University of Queensland, Brisbane, QLD.
- 2 Mater Medical Research Institute, Brisbane, QLD.
- 3 Royal Brisbane and Women’s Hospital, Brisbane, QLD.
No relevant disclosures.
- 1. Sebire NJ, Jolly M, Harris JP, et al. Maternal obesity and pregnancy outcome: a study of 287,213 pregnancies in London. Int J Obes Relat Metab Disord 2001; 25: 1175-1182.
- 2. Cnattingius S, Bergstrom R, Lipworth L, Kramer MS. Prepregnancy weight and the risk of adverse pregnancy outcomes. N Engl J Med 1998; 338: 147-152.
- 3. Confidential Enquiry into Maternal and Child Health. Why mothers die 2000–2002. The sixth report of the confidential enquiries into maternal deaths in the United Kingdom. London: RCOG Press, 2004.
- 4. Stothard KJ, Tennant PWG, Bell R, Rankin J. Maternal overweight and obesity and the risk of congenital anomalies: a systematic review and meta-analysis. JAMA 2009; 301: 636-650.
- 5. Flenady V, Koopmans L, Middleton P, et al. Major risk factors for stillbirth in high-income countries: a systematic review and meta-analysis. Lancet 2011; 377: 1331-1340.
- 6. Catalano PM. Obesity, insulin resistance, and pregnancy outcome. Reproduction 2010; 140: 365-371.
- 7. Nelson SM, Matthews P, Poston L. Maternal metabolism and obesity: modifiable determinants of pregnancy outcome. Hum Reprod Update 2010; 16: 255-275.
- 8. Callaway LK, Prins JB, Chang AM, McIntyre HD. The prevalence and impact of overweight and obesity in an Australian obstetric population. Med J Aust 2006; 184: 56-59. <MJA full text>
- 9. Athukorala C, Rumbold AR, Willson KJ, Crowther CA. The risk of adverse pregnancy outcomes in women who are overweight or obese. BMC Pregnancy Childbirth 2010; 10: 56.
- 10. World Health Organization. Obesity: preventing and managing the global epidemic. Report of a WHO consultation. World Health Organ Tech Rep Ser 2000; 894: i-xii, 1-253.
- 11. WHO Expert Consultation. Appropriate body-mass index for Asian populations and its implications for policy and intervention strategies. Lancet 2004; 363: 157-163.
- 12. Brown MA, Hague WM, Higgins J, et al. The detection, investigation and management of hypertension in pregnancy: full consensus statement. Aust N Z J Obstet Gynaecol 2000; 40: 139-155.
- 13. Hoffman L, Nolan C, Wilson JD, et al. Gestational diabetes mellitus — management guidelines. The Australasian Diabetes in Pregnancy Society. Med J Aust 1998; 169: 93-97. <MJA full text>
- 14. Roberts CL, Lancaster PA. Australian national birthweight percentiles by gestational age. Med J Aust 1999; 170: 114-118.
- 15. Gibbons K, Chang A, Flenady V, et al. Validation and refinement of an Australian customised birthweight model using routinely collected data. Aust N Z J Obstet Gynaecol 2010; 50: 506-511.
- 16. Cuzick J. A Wilcoxon-type test for trend. Stat Med 1985; 4: 87-90.
- 17. Australian Bureau of Statistics. Census of Population and Housing: Socio-Economic Indexes for Areas (SEIFA), Australia — technical paper, 2001. Canberra: ABS, 2004. (ABS Cat. No. 2039.0.55.001.)
- 18. Australian Bureau of Statistics. Overweight and obesity in adults, Australia, 2004–05. Canberra: ABS, 2008. (ABS Cat. No. 4719.0.)
- 19. Torloni MR, Betran AP, Daher S, et al. Maternal BMI and preterm birth: a systematic review of the literature with meta-analysis. J Matern Fetal Neonatal Med 2009; 22: 957-970.
- 20. McDonald SD, Han Z, Mulla S, Beyene J; Knowledge Synthesis Group. Overweight and obesity in mothers and risk of preterm birth and low birth weight infants: systematic review and meta-analyses. BMJ 2010; 341: c3428.
- 21. HAPO Study Cooperative Research Group. Hyperglycaemia and Adverse Pregnancy Outcome (HAPO) Study: associations with maternal body mass index. BJOG 2010; 117: 575-584.
- 22. Basu S, Haghiac M, Surace P, et al. Pregravid obesity associates with increased maternal endotoxemia and metabolic inflammation. Obesity (Silver Spring) 2011; 19: 476-482.
- 23. Callaway LK, Lawlor DA, McIntyre HD. Hypertensive disorders of pregnancy and long-term prognosis. Am J Obstet Gynecol 2008; 199: e20; author reply e20-21.
- 24. Dodd JM, Grivell RM, Crowther CA, Robinson JS. Antenatal interventions for overweight or obese pregnant women: a systematic review of randomised trials. BJOG 2010; 117: 1316-1326.
- 25. Rasmussen KM, Yaktine AL, editors. Institute of Medicine and National Research Council Committee to Reexamine IOM Pregnancy Weight Guidelines. Weight gain during pregnancy: reexamining the guidelines. Washington, DC: National Academies Press, 2009.
- 26. Lee CY, Koren G. Maternal obesity: effects on pregnancy and the role of pre-conception counselling. J Obstet Gynaecol 2010; 30: 101-106.
- 27. Smith J, Cianflone K, Biron S, et al. Effects of maternal surgical weight loss in mothers on intergenerational transmission of obesity. J Clin Endocrinol Metab 2009; 94: 4275-4283.
- 28. Queensland Health. Health Statistics Centre perinatal statistics 2009. http://www.health.qld.gov.au/hic/peri2009/perinatal09.asp (accessed Feb 2012).
- 29. Stommel M, Schoenborn CA. Accuracy and usefulness of BMI measures based on self-reported weight and height: findings from the NHANES & NHIS 2001-2006. BMC Public Health 2009; 9: 421.
- 30. Cedergren M. Effects of gestational weight gain and body mass index on obstetric outcome in Sweden. Int J Gynaecol Obstet 2006; 93: 269-274.
- 31. Flegal KM, Carroll MD, Ogden CL, Curtin LR. Prevalence and trends in obesity among US adults, 1999-2008. JAMA 2010; 303: 235-241.
Abstract
Objectives: To document temporal trends in maternal overweight and obesity in Australian women and to examine associations with pregnancy outcomes.
Design, setting and participants: Retrospective 12-year cohort study of 75 432 women with singleton pregnancies who had pre-pregnancy height and weight data available and who gave birth in a tertiary referral maternity hospital in Brisbane between January 1998 and December 2009.
Main outcome measures: Maternal body mass index (BMI); prevalence of overweight and obesity, and pregnancy complications including hypertension, gestational diabetes, caesarean delivery, and perinatal morbidity and mortality.
Results: From 1998 to 2009, class III and class II obesity increased significantly (from 1.2% to 2.0%, and 2.5% to 3.2%, respectively), while the proportions of underweight women and those with class I obesity fell slightly (from 7.9% to 7.4%, and 7.7% to 7.5%, respectively). Increasing maternal BMI was associated with many adverse pregnancy outcomes, including hypertension in pregnancy, gestational diabetes, caesarean delivery, perinatal mortality (stillbirth and neonatal death), babies who were large for gestational age, and neonatal morbidities including hypoglycaemia, jaundice, respiratory distress and the need for neonatal intensive care (P < 0.001 for all). Most associations remained significant after adjusting for maternal age, parity, insurance status, smoking status, ethnicity and year of the birth. The frequency of congenital anomalies was not associated with maternal BMI (P = 0.71).
Conclusions: Maternal overweight and obesity are endemic challenges for Australian obstetric care and are associated with serious maternal and neonatal complications, including perinatal mortality.