


There is growing concern about harmful drinking among young Australians.1-3 The federal government’s response, effective in April 2008, was to increase the excise duty on pre-mixed alcoholic beverages — known as “alcopops” and favoured by young people — by almost 70%. Parliament subsequently passed “validating” legislation for continued collection of the increased tax, even though the original legislation did not pass.4 The legislation was based on findings that higher taxes on and prices of alcoholic beverages reduce overall consumption of alcohol and, in particular, heavy drinking.5,6 However, it is unclear whether tax increases on only one type of drink, as opposed to alcoholic beverages in general, are similarly effective. Young people may merely switch to cheaper, and potentially more potent, alcoholic drinks.
Initial studies of the increased alcopops tax have been equivocal. Alcohol sales data suggested a substantial fall in the sales of ready-to-drink beverages after the tax increase, with a smaller shift to other beverages (beer and spirits) and a net reduction in overall sales.7-10 However, it is difficult to know if this reduced the harms related to alcohol consumption in the longer term. Moreover, taxation or sales data for all alcoholic beverages cannot provide information on changes in alcohol misuse, because they only reflect consumption overall, and provide no indication of whether or how consumption at harmful levels is changing.11
Indicators of health outcomes, such as health service use, may be more appropriate for measuring the effect of the increased alcopops tax. A study by Access Economics of hospital admissions and emergency department (ED) presentations by young people for alcohol-related incidents across Australia found no decrease in alcohol-related harms after the tax increase.12 This study restricted health outcomes to alcohol-attributable mental health conditions such as alcohol dependence and misuse. Such conditions represent a minority of alcohol-attributable conditions for which young people are admitted.13 Among 15–24-year-olds, unintentional and intentional injuries are the most common causes of hospitalisation attributable to alcohol for both males (66%) and females (59%).13 Furthermore, many of the alcohol-attributable mental health conditions included in the Access Economics report required long-term use of alcohol, and so were inappropriate for measuring change in the few months after the tax increase.13 Additionally, the report did not include any control patients.12
F10 codes for mental and behavioural disorders due to alcohol;
T51.0 and T51.9 for alcohol poisoning;
Z04.0 for a blood-alcohol test; and
S and T codes for injury (excluding superficial injury S codes).
Where present, we also extracted external cause of injury codes (eg, W, X or Y codes). These give information on the cause of the injury (eg, intentional self-harm, assault). We used narrow and broad definitions of alcohol-related harm. The former included codes solely associated with alcohol, the latter the narrow definition plus all the injury codes. We used alcohol-attributable fractions (AAFs) to adjust for the fact that not all injuries are due to alcohol. AAFs assign the likelihood that any given condition has an association with alcohol using previously published clinical data. Alcoholic cirrhosis, for example, has an AAF of 1.0, while assault has a value of 0.27. We used AAFs for external cause of injury from Australia or Britain appropriate to sex and age group.14,15 When we were unable to apply cause-specific AAFs, we calculated an average across all injuries of that type, or used sex-appropriate AAFs for injuries as a whole. As we could not find Australian AAFs for the latter, we used Swiss data.16 We further refined the broad definition by only considering presentations between 22:00 and 06:00 hours, or on weekends, when alcohol would be most likely to be a factor. We undertook a sensitivity analysis of including S codes for superficial injury.
30–49-year-olds with alcohol-related harms;
15–29-year-olds with asthma (ICD-10 code J45) and appendicitis (ICD-10 code K35.9), because these are diagnoses in young people unrelated to alcohol; and
15–29-year-olds with any non-alcohol and non-injury-related presentation.
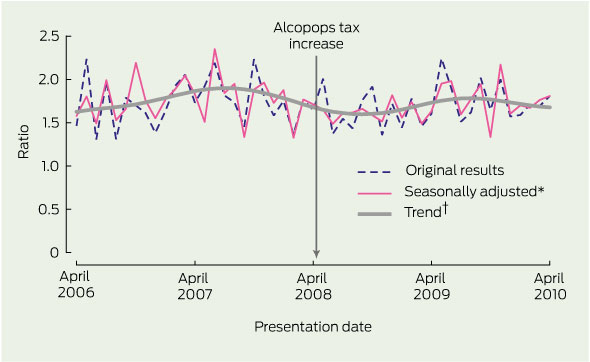
Presentations for alcohol-related harms may be subject to seasonal fluctuations. We therefore used time series analysis to test for any significant change in the proportion of presentations among 15–29-year-olds for alcohol-related harms before and after the alcopops tax increase, compared with controls. This analysis adjusts for seasonal and random fluctuations by month. We used the X11 procedure to identify any seasonal, irregular and trend components of the series.17 We used Autoregressive Integrated Moving Average (ARIMA) modelling with differencing to test for any significant change after the increase in tax.18 Differencing takes into account long-term upward trends in alcohol-related presentations that could mask the effect of the increased tax. We found the ARIMA (1,1,0)(1,0,0)12 model to be the best fit for most series, testing for white noise with the Ljung–Box test. In time series with no strong underlying trends, we also fitted an ARIMA (1,0,0)(1,0,0)12 model.
We undertook the following sensitivity analyses in addition to those for the injury codes:
we assessed if there was any difference between younger and older age groups within the 15–29-year-old sample by looking at 15–19-year-olds only;
we investigated if there was any difference for the narrow compared with the broad definition of alcohol-related presentations;
we investigated the effect of excluding the Robina ED from our analyses following its opening in 2007; and
we restricted the analysis to people whose residential address was in the Gold Coast area, based on the following postcodes: 4209–4221, 4223–4230, 4261, 4270–4272, and 4275 (we calculated alcohol-related presentation rates per 10 000 people for this analysis, as the potential population at risk would not vary according to the number of visitors).
We used Estimated Resident Population figures for the Gold Coast area from the Australian Bureau of Statistics.19 Although we hypothesised a permanent break in the time-series, we also checked for a delayed or temporary effect by testing different transfer functions.20
There were 62 813 ED visits in April 2005 to April 2006, rising to 111 564 in 2009–10 (Box 1). The 15–29-year-old age group represented about 28% of ED presentations each year. This age group had an average age of 22.1 years and 52% were male. By our broad definition of alcohol-related harm, over a third of 15–29-year-olds presented to ED with alcohol-related conditions, as opposed to around a quarter for all other age groups (Box 1).
Box 2 shows the results of the time series analyses. There was no significant fall in broadly-defined alcohol-related ED presentations in 15–29-year-olds compared with those in 30–49-year-olds (Box 2 and Box 3). There was also no fall in relation to 15–29-year-olds presenting with appendicitis or asthma, or non-alcohol related conditions in general (Box 2). We found similar results for males and females, narrow and broad definitions of alcohol-related harms, and for patients aged 15–19 years (Box 2). The results were also similar when we considered alcohol-related presentations for Gold Coast patients per 10 000 Gold Coast residents (Box 2).
We also found no difference when applying AAFs for injuries as a whole rather than for specific external causes, or when including superficial injury codes. There was no difference when we excluded presentations to the ED at Robina. Graphs of the time series all resembled Box 3. Finally, we also found no evidence of a temporary effect when considering different transfer functions.20
Given the strong evidence of the effectiveness of taxation on overall alcohol consumption, one interpretation of these findings is that price influences average consumption of all drinks, but not risky consumption on a single occasion. A second is that raising the price of just one type of drink may not reduce alcohol-related harms in tourist destinations such as the Gold Coast. If the latter were true, this may raise questions about generalising from the effects of overall increases in alcohol tax or duty to initiatives that target one type of drink.21 If our findings hold across other health services and populations, more comprehensive approaches may be required, combining fiscal measures such as volumetric taxation for all alcoholic beverages, along with other supply and demand initiatives.21,22 These could include incentives to encourage mid-strength and low-strength beer, restrictions on the availability of drinks with a high alcohol content, more effective regulation of advertising, and increasing the age at which it is legal to drink alcohol.21,22
Our study also suggests that other efforts to reduce binge drinking on the Gold Coast, such as increased policing or holding officially sanctioned drug-free and alcohol-free events have not been associated with reductions in ED presentations either. This again suggests the need for a more comprehensive approach to binge drinking among young people.21
Administrative data are subject to reporting bias, and we cannot be certain that alcohol-related events were not due to other causes, such as substance use. ED data in Queensland are based on a restricted range of ICD codes, but we took this into account in our definitions of alcohol-related harm. Finally, there were minor changes to administrative data coding in 2008.12 However, our narrow and broad definitions of alcohol-related harm were defined so that people were allocated to the same category regardless of the change.
1 Presentations for alcohol-related harms to two Gold Coast hospital emergency departments by 15–29-year-olds compared with all other age groups 2008 to 2010
2 Summary statistics for change in emergency department presentations after the increase in alcopops tax
Received 9 August 2010, accepted 5 October 2011
- Steve R Kisely1,2
- Joanne Pais1
- Angela White3
- Jason Connor3
- Lake-Hui Quek3
- Julia L Crilly4
- David Lawrence5
- 1 School of Population Health, University of Queensland, Brisbane, QLD.
- 2 Griffith Health Institute, Griffith University, Gold Coast, QLD.
- 3 Centre for Youth Substance Abuse Research, University of Queensland, Brisbane, QLD.
- 4 State Wide Emergency Department Clinical Network, Queensland Health, Gold Coast, QLD.
- 5 Centre for Child Health Research, The University of Western Australia, Perth, WA.
We acknowledge the support from the Decision Support Services at the Gold Coast Hospital. We also thank Wayne Hall, National Health and Medical Research Council Australia Fellow, for his advice during key phases of this study.
No relevant disclosures.
- 1. Australian Institute of Health and Welfare. 2007 National Drug Strategy household survey: first results. Canberra: AIHW, 2008. (AIHW Cat. No. PHE 98; Drugs Statistics Series No. 20.)
- 2. Chikritzhs T, Stockwell T, Heale P, et al. Trends in alcohol-related road injury in Australia, 1990–1997. National Alcohol Indicators, Bulletin No. 2. Perth: National Drug Research Institute, 2000.
- 3. Chikritzhs T, Catalano P, Stockwell T, et al. Australian Alcohol Indicators, 1990–2001: Patterns of alcohol use and related harms for Australian states and territories. Perth: National Drug Research Institute, 2003.
- 4. Hudson A. Alcopops legislation finally bubbles through Australian parliament. Melbourne: Hunt & Hunt, 2009. http://www.mondaq.com/australia/article.asp?articleid=84938 (accessed May 2011).
- 5. Chaloupka FJ, Grossman M, Saffer H. The effects of price on alcohol consumption and alcohol-related problems. Alcohol Res Health 2002; 26: 22-34.
- 6. Wagenaar AC, Salois MJ, Komro KA. Effects of beverage alcohol price and tax levels on drinking: a meta-analysis of 1003 estimates from 112 studies. Addiction 104: 179-190.
- 7. Australian Bureau of Statistics. Apparent consumption of alcohol, Australia, 2008-09. Canberra: ABS, 2010. (ABS Cat. No. 4307.0.55.001.) http://www.abs.gov.au/AUSSTATS/abs@.nsf/Lookup/4307.0.55.001Main+Features12008-09?OpenDocument (accessed July 2010).
- 8. Chikritzhs TN, Dietze PM, Allsop SJ, et al. The “alcopops” tax: heading in the right direction. Med J Aust 2009; 190: 294-295. <MJA full text>
- 9. Commonwealth of Australia. Budget Paper No. 1: Budget strategy and outlook 2009-10. Canberra: CoA, 2009. http://www.budget.gov.au/2009-10/content/bp1/html/bp1_bst5-06.htm (accessed Jul 2010).
- 10. Hall W, Chikritzhs T. The Australian alcopops tax revisited. Lancet 2011; 377: 1136-1137.
- 11. Shakeshaft A, Doran CM, Byrnes J. The role of research in the failure of the alcopops excise in Australia: what have we learned? Med J Aust 2009; 191: 223-225. <MJA full text>
- 12. Access Economics. Trends in alcohol related hospital use by young people. Canberra: Access Economics, 2009.
- 13. Chikritzhs T, Allsop S. Review: Trends in alcohol related hospital use by young people by Access Economics. Perth: Curtin University, 2009. http://ndri.curtin.edu.au/local/docs/pdf/publications/R224.pdf (accessed Nov 2011).
- 14. Jones L, Bellis M, Sumnall H. Alcohol-attributable fractions for England: alcohol-attributable mortality, and hospital admissions. Liverpool: North West Public Health Observatory, Liverpool John Moores University, 2009.
- 15. National Health and Medical Research Council. Australian guidelines to reduce health risks from drinking alcohol. Canberra: Commonwealth of Australia, 2009. http://www.nhmrc.gov.au/publications/synopses/ds10syn.htm (accessed May 2011).
- 16. Gmel G, Bissery A, Gammeter R, et al. Alcohol-attributable injuries in admissions to a Swiss emergency room — an analysis of the link between volume of drinking, drinking patterns, and preattendance drinking. Alcohol Clin Exp Res 2006; 30: 501-509.
- 17. Shiskin J, Young AH, Musgrave JC. The X-11 variant of the Census method II seasonal adjustment program. Bureau of the Census Technical Paper No. 15. Rev. ed. Washington: US Dept of Commerce, 1967. http://www.census.gov/ts/papers/ShiskinYoungMusgrave1967.pdf (accessed Nov 2011).
- 18. McCain LJ, McCleary R. The statistical analysis of the simple interrupted time-series quasi-experiment. In: Cook TD, Campbell DT, editors. Quasi-experimentation: design and analysis issues for field settings. Chicago: Rand-McNally, 1979.
- 19. Australian Bureau of Statistics. Population by age and sex, regions of Australia, 2010. Canberra: ABS, 2010. (ABS Cat. No. 3235.0.) http://www.abs.gov.au/Ausstats/abs@.nsf/mf/3235.0 (accessed Nov 2011).
- 20. Pridemore WA, Snowden AJ. Reduction in suicide mortality following a new national alcohol policy in Slovenia: an interrupted time-series analysis. Am J Public Health 2009; 99: 915-920.
- 21. Doran CM, Shakeshaft AP. Using taxes to curb drinking in Australia. Lancet 2008; 372: 701-702.
- 22. Cobiac L, Vos T, Doran C, Wallace A. Cost-effectiveness of interventions to prevent alcohol-related disease and injury in Australia. Addiction 2009; 104: 1646-1655.
Abstract
Objective: To measure alcohol-related harms to the health of young people presenting to emergency departments (EDs) of Gold Coast public hospitals before and after the increase in the federal government “alcopops” tax in 2008.
Design, setting and participants: Interrupted time series analysis over 5 years (28 April 2005 to 27 April 2010) of 15–29-year-olds presenting to EDs with alcohol-related harms compared with presentations of selected control groups.
Main outcome measures: Proportion of 15–29-year-olds presenting to EDs with alcohol-related harms compared with (i) 30–49-year-olds with alcohol-related harms, (ii)15–29-year-olds with asthma or appendicitis, and (iii) 15–29-year-olds with any non-alcohol and non-injury related ED presentation.
Results: Over a third of 15–29-year-olds presented to ED with alcohol-related conditions, as opposed to around a quarter for all other age groups. There was no significant decrease in alcohol-related ED presentations of 15–29-year-olds compared with any of the control groups after the increase in the tax. We found similar results for males and females, narrow and broad definitions of alcohol-related harms, under-19s, and visitors to and residents of the Gold Coast.
Conclusions: The increase in the tax on alcopops was not associated with any reduction in alcohol-related harms in this population in a unique tourist and holiday region. A more comprehensive approach to reducing alcohol harms in young people is needed.