


Health care for children involves universal prevention, primary care (commonly provided by general practitioners), secondary care (commonly provided by outpatient or private paediatricians) and tertiary inpatient care.1,2 Most paediatric research takes place in primary or tertiary institutional settings and may not be generalisable to secondary care settings. However, understanding the casemix and patterns of secondary care provision could inform future workforce training and facilitate research into issues that pose major health care and societal costs, such as childhood obesity and autism.
The Australian Paediatric Research Network (APRN) is a nationwide network of paediatricians that was established in 2007 to facilitate multisite secondary care research in Australian paediatric outpatient settings. The APRN is modelled on the successful Pediatric Research in Office Settings network in the United States,3 and offers an opportunity to collect information about contemporary Australian paediatric casemix.4
In 2008, the APRN conducted a Delphi-style survey to ascertain its members’ clinically relevant research priorities.5 From 430 member-proposed research questions, those accorded the highest priority related to the optimal management of childhood obesity and its comorbidities, long-term outcomes of attention deficit hyperactivity disorder (ADHD), and outcomes and service use following diagnosis of autism spectrum disorder (ASD). The APRN’s next step was to ascertain Australian secondary care paediatric practice patterns through a national prospective audit — the Children Attending Paediatricians Study (CAPS) — to establish the feasibility of conducting future research in these areas. The aims of CAPS were to:
- describe paediatricians’ casemix, consultation characteristics and management patterns;
- determine the most prevalent new and review diagnoses (a) overall and (b) for children of Aboriginal and Torres Strait Islander (Indigenous) descent;
- identify family and paediatrician variables associated with the most common (a) medical and (b) behavioural–developmental diagnoses; and
- document billing practices.
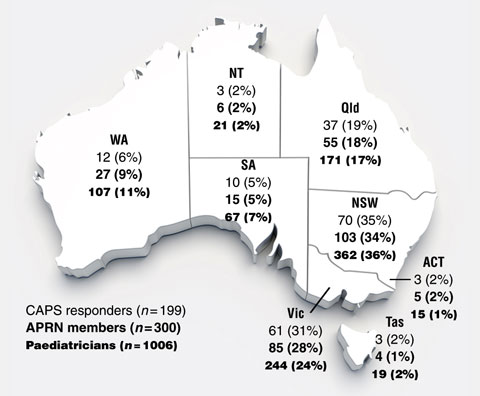
In 2007, the 1006 general paediatricians registered with the Royal Australasian College of Physicians (RACP) were invited to join the APRN. By 15 October 2008, 300 were members, with all Australian states and territories proportionally represented (Box 1).5 All 300 members were invited to participate in this prospective practice audit, which targeted consultations in private consulting rooms, community health centres and hospital outpatient clinics.
The data collection form covered a single consultation and was modelled on the Morbidity and Treatment Survey of the Bettering the Evaluation And Care of Health (BEACH) project,6,7 a continuous national study of patterns of Australian general practice.8 We piloted the form with 10 APRN regional representatives and modified it based on their feedback. The final form included the date, location, and start and end times of the consultation; diagnoses made; medications and vaccinations provided; Medicare item numbers billed; investigations and referrals made; the parent’s perceptions of both the child’s health and his or her own health on 5-point Likert scales;9,10 and the child’s weight and height.
We asked paediatricians to record diagnoses using a coding sheet (available from the authors) of the top 60 most common diagnoses identified in a 1996–97 audit of paediatric practice in the Barwon region of Victoria,11 or, if a child had a diagnosis not on this list, by writing the diagnosis in full.
We scanned the completed forms using Cardiff TeleForm 10.0 software (Cardiff, Vista, Calif, USA). A research assistant verified and corrected any queries raised by this process against the original data collection forms. One of us (J R S) coded the additional handwritten diagnoses; most could be assigned one of the original 60 codes, while the remainder resulted in 55 additional codes. We assigned each child a census-derived Socio-Economic Indexes for Areas (SEIFA) Index of Relative Socio-economic Disadvantage score based on his or her home postcode.12
For each of the top three medical and five (collapsed from seven) behavioural–developmental diagnoses (Aim 3), we fitted a single marginal logistic regression model using generalised estimating equations, assuming an exchangeable correlation matrix with information sandwich (robust) estimates of standard error that allowed for the correlation between characteristics of patients from the same cluster (paediatrician).13 The variables entered into each of the eight models were: sex of the paediatrician and time since specialist qualification (Fellow of the RACP [FRACP]); and child age, sex, socioeconomic status (SEIFA score and Health Care Card ownership), Indigenous status, and language spoken at home.
Of the 300 eligible APRN members, 199 (66.3%) participated and collected data on 8345 consultations. Responders were more likely to work full-time than non-responders (Box 2).
Box 3 shows the consultation characteristics of the 10 most prevalent diagnoses for new and review consultations. Behavioural–developmental disorders dominated the top diagnostic categories.
Child, parent and doctor variables associated with the top three medical and top five behavioural–developmental diagnoses are shown in Box 4 and Box 5, respectively. Owning a Health Care Card was associated with all developmental–behavioural diagnoses, as was male sex of the child (except for developmental delay/intellectual disability). Coming from a non-English-speaking background was associated with behaviour and learning difficulty/disability, but not developmental delay/intellectual disability, language delay or ASD. Paediatrician variables (sex, time since FRACP was awarded) showed no significant association with diagnosis.
In this first national prospective audit of Australian paediatric outpatient practice across metropolitan, rural and regional areas, paediatricians saw a wide variety of medical, behavioural and developmental problems. Developmental and behavioural diagnoses, dominated by ADHD and learning difficulties, were the most prevalent. In contrast, despite the known high prevalence of childhood obesity (around 6%),14 our findings show it appears to be significantly underdiagnosed, suggesting that children are not actively presenting with obesity or that there are substantial barriers to their management in secondary care settings.15 The proportion of consultations with children of Indigenous descent (2.9%) was lower than the national proportion of Indigenous children in the general population (4.9% of all 0–19-year-olds).16 However, as hypothesised, we found that children of Indigenous descent were more likely to present with infectious diseases than children of non-Indigenous descent, but were equally likely to present with ADHD. Paediatrician variables were less strongly associated with casemix than were patient characteristics, and paediatricians generally billed families for single rather than complex consultations, even though over half the consultations involved more than one diagnosis.
The only previous published study of paediatricians’ secondary care practice in Australia was conducted in the mid 1990s in the Victorian region of Barwon, about 85 km from Melbourne. Drawn from a single region, those data are now over 10 years old and may not generalise to current practice. In that 12-month prospective audit, six paediatricians recorded 14 711 consultations, of which medical diagnoses comprised 69% and behavioural problems an overlapping 35%.11 The Barwon audit grouped a number of behavioural diagnoses (including ADHD, its most common diagnosis at 26%) as behavioural problems, so its prevalence of 35% is higher than our combined prevalence of 24% for ADHD (18%) and behavioural problems (6%). Baby checks (9.1%) were the second most common CAPS category, compared with epilepsy/disability in the Barwon study (14.5%). This may reflect epilepsy/disability diagnostic care moving towards subspecialists over recent years or differences in practice sites; almost two-thirds of CAPS responders were from metropolitan areas, which have greater access to subspecialist care than do regional sites. Finally, diagnoses of ASD and non-cows milk food allergy were common in our study but did not feature in the top 50 Barwon diagnoses, probably reflecting the changing prevalence of child health morbidities.
In contrast, the top diagnoses in a paediatric audit in the US were well child checks, otitis media and upper respiratory infections,17 reflecting the largely primary care role of US paediatricians. In a health care utilisation study of 1000 American children aged 0–17 years, 167 visited a non-hospital paediatrician each month, eight visited a hospital clinic and only three were hospitalised.2 However, very little is known about the care provided for child problems in secondary care settings, because primary and secondary paediatric care in the US cannot be distinguished.
Our study also had some limitations. We cannot say how representative our sample is of the general paediatric workforce, as comparable data for Australian general paediatricians are not available — neither the Australian Institute of Health and Welfare nor the RACP differentiates generalists from subspecialist paediatricians in their workforce data. The most recent RACP workforce survey (2008) described a group with a similar distribution to CAPS responders by sex (60% v 54% male) but fewer working part-time (28% v 65%).18 However, as the RACP survey combined general and specialty paediatricians and had a low response rate (22%), such comparisons are dubious. The fact that full-time APRN paediatricians were more likely to complete the CAPS audit than part-timers may bias our results toward medical diagnoses, as children with medical conditions present with more acute needs, and full-time paediatricians anecdotally have greater flexibility in managing short-notice presentations. Thus, we may actually be underestimating Australian paediatricians’ developmental–behavioural caseload. We cannot be sure that paediatricians recorded data for all patients seen, nor predict how any resulting selection bias may have affected our conclusions. Finally, we conducted the audit during spring, and the prevalence of respiratory and gastrointestinal illnesses may have been higher had it been conducted in winter.
This study has research, clinical, training and policy implications. In terms of the top secondary care research priorities for APRN members,5 recruitment of participants to study ADHD and autism appear feasible from a prevalence perspective, whereas research into childhood obesity and its comorbidities is likely to require approaches that specifically address barriers to initiating care. Our findings confirm the conclusion from the Barwon audit that a greater focus on family, social and emotional factors is needed in paediatric training.11 Finally, paediatricians see children with multiple diagnoses, and remuneration needs to account for the extra time paediatricians spend after consultations on related tasks such as contacting teachers and allied health professionals for reports on the child. Future workforce policies should account for the nature and complexity of child health care in secondary settings, to ensure we have adequate numbers of suitably trained paediatricians to care for Australia’s children.
1 APRN members, CAPS responders and Australian paediatricians eligible for the APRN,5 by state or territory
3 Consultation characteristics of the top 10 new and review diagnoses, ranked by frequency*
* Missing data not included. |
|||||||||||||||
4 Multivariable logistic regression analyses estimating the odds ratios (ORs) of association between the top three medical diagnoses and family and paediatrician characteristics (n = 5698)*
Baby check (premature/full-term) |
|||||||||||||||
Provenance: Not commissioned; externally peer reviewed.
Received 3 March 2010, accepted 31 January 2011
- Harriet Hiscock1,2,3
- Gehan Roberts1,2,3
- Daryl Efron1,2,3
- Jillian R Sewell1,2,3
- Hannah E Bryson1,2
- Anna M H Price1,2
- Frank Oberklaid1,2,3
- Michael South1,2,3
- Melissa A Wake1,2,3
- 1 Royal Children’s Hospital, Melbourne, VIC.
- 2 Centre for Community Child Health, Murdoch Childrens Research Institute, Melbourne, VIC.
- 3 Department of Paediatrics, University of Melbourne, Melbourne, VIC.
This study was funded by the Murdoch Childrens Research Institute. Melissa Wake and Harriet Hiscock are supported by National Health and Medical Research Council Career Development Awards (546405 and 607351). We thank all the APRN members who took part in this study, and the Paediatrics and Child Health Division of the RACP for their support of the APRN.
None identified.
- 1. White KL, Williams TF, Greenberg BG. The ecology of medical care. N Engl J Med 1961; 265: 885-892.
- 2. Dovey S, Weitzman M, Fryer G, et al. The ecology of medical care for children in the United States. Pediatrics 2003; 111 (5 Pt 1): 1024-1029.
- 3. Wasserman RC, Slora EJ, Bocian AB, et al. Pediatric Research in Office Settings (PROS): a national practice-based research network to improve children’s health care. Pediatrics 1998; 102: 1350-1357.
- 4. Hiscock H, Efron E, Wasserman R, Wake M. Power to the paediatricians: the Australian Paediatric Research Network is born. J Paediatr Child Health 2010; Jun 27. [Epub ahead of print.]
- 5. Rudolph S, Hiscock H, Efron D, et al. What research questions matter to Australian paediatricians? National Delphi Study. J Paediatr Child Health 2009; 45: 704-710.
- 6. Australian General Practice Statistics and Classification Centre. The BEACH Project: Bettering the Evaluation And Care of Health. http://www.fmrc.org.au/beach.htm (accessed Nov 2010).
- 7. BEACH (Bettering the Evaluation And Care of Health) – Morbidity and Treatment Survey – National. http://www.fmrc.org.au/Beach/BEACH-Form-yr12.pdf (accessed Jan 2010).
- 8. Britt HC, Miller GC. The BEACH study of general practice [editorial]. Med J Aust 2000; 173: 63-64.
- 9. Waters E, Salmon L, Wake M, et al. The Child Health Questionnaire in Australia: reliability, validity and population means. Aust N Z J Public Health 2000; 24: 207-210.
- 10. Waters E, Doyle J, Wolfe R, et al. Influence of parental gender and self-reported health and illness on parent-reported child health. Pediatrics 2000; 106: 1422-1428.
- 11. Hewson PH, Anderson PK, Dinning AH, et al. A 12-month profile of community paediatric consultations in the Barwon region. J Paediatr Child Health 1999; 35: 16-22.
- 12. Australian Bureau of Statistics. SEIFA: Socio-Economic Indexes for Areas. http://www.abs.gov.au/websitedbs/D3310114.nsf/home/Seifa_entry_page (accessed Jan 2010).
- 13. Hanley JA, Negassa A, Edwardes MD, Forrester JE. Statistical analysis of correlated data using generalized estimating equations: an orientation. Am J Epidemiol 2003; 157: 364-375.
- 14. Australian Government Department of Health and Ageing. 2007 Australian National Children’s Nutrition and Physical Activity Survey – key findings. http://www.health.gov.au/internet/main/publishing.nsf/Content/phd-nutrition-childrens-survey-keyfindings (accessed Feb 2010).
- 15. Wake M, Baur LA, Gerner B, et al. Outcomes and costs of primary care surveillance and intervention for overweight or obese children: the LEAP 2 randomised controlled trial. BMJ 2009; 339: b3308.
- 16. Australian Bureau of Statistics. Population characteristics, Aboriginal and Torres Strait Islander Australians. Canberra: ABS, 2006. (ABS Cat. No. 4713.0.) http://www.ausstats.abs.gov.au/Ausstats/subscriber.nsf/0/526FE126443EBCC 6CA257718001D547F/$File/47130_2006_reissue.pdf (accessed Jan 2010).
- 17. Slora EJ, Thoma KA, Wasserman RC, et al. Patient visits to a national practice-based research network: comparing pediatric research in office settings with the National Ambulatory Medical Care Survey. Pediatrics 2006; 118: e228-e234.
- 18. Royal Australasian College of Physicians. RACP 2008 Workforce Survey. Sydney: RACP, 2010.
Abstract
Objective: To audit general paediatric outpatient practice in Australia, including consultation characteristics and management patterns, diagnoses, factors associated with diagnoses, and billing practices.
Design, setting and participants: In October – November 2008, members of the Australian Paediatric Research Network (APRN; a national network of paediatricians established to facilitate multisite secondary care research) were invited to prospectively complete brief standardised data collection forms for 100 consecutive patients or all patients during a 2-week period, whichever came first.
Main outcome measures: Length of consultation and type of diagnoses made; proportions recorded as having medications, investigations or referral; odds ratios for factors associated with diagnoses; and proportions of Medicare items billed.
Results: Of 300 APRN members, 199 (66%) completed data forms for 8345 consultations in which 15 375 diagnoses were made (mean, 1.8 diagnoses per consultation); 46.0%, 30.9% and 22.8% of consultations involved 1, 2 and ≥ 3 diagnoses, respectively. New and review consultations lasted a mean of 41 (SD, 20) and 26 (SD, 15) minutes, respectively. The most common diagnoses were attention deficit hyperactivity disorder (18.3%), baby checks (9.1%), and learning difficulties (7.5%). Patients seen in 47.5% of consultations had medications (eg, prescriptions, vaccinations) recorded, and patients in 27.2% of consultations were referred elsewhere, usually to a subspecialist or psychologist (31.6% and 26.6% of referrals, respectively). Male sex of the child and owning a Health Care Card were associated with most developmental–behavioural diagnoses. Paediatricians tended to bill for single disease/non-complex consultations, even when seeing a child with multiple problems.
Conclusions: Australian paediatricians see children with a range of diagnoses that are often multiple and complex. Our findings provide directions for future secondary care research, and may inform workforce planning and paediatricians’ training requirements.