


Pathology services currently account for 14%, or $2 billion per annum, of Medicare expenditure.1 Over the past decade, pathology service costs have increased rapidly in Australia and many other developed countries.2 Nearly 70% of public expenditure on pathology services in Australia goes towards tests ordered by general practitioners.3
Outside hospitals, pathology service delivery in Australia is dominated by a few large companies; it is an oligopoly. Specimens are collected from patients at general practices or pathology collection centres (PCCs) and couriered to central laboratories for testing. More than 80% of PCCs are owned and operated by one of the country’s four major pathology companies.4 Pathology companies compete to place PCCs in the most commercially advantageous locations. Commonly, that will be in or adjacent to busy general practices. The pathology companies then strive to secure and maintain the referral allegiance of their GP neighbours.
Regulators have long worried about these arrangements.5-8 The nub of the policy concern is that the structure of pathology markets, coupled with the close professional relationships that exist between doctors and pathology company staff, may stimulate over-testing.7 In 2007, the federal government introduced new rules aimed at curbing inappropriate influences in the delivery of pathology and imaging services,9 including sham commercial relationships, such as landlord–tenant deals, used to mask “kickbacks” to doctors for referrals. Recent media reports suggest a forthcoming federal government taskforce to investigate claims of bribery and kickbacks in the pathology industry,10 and at least one such allegation is currently being litigated.11
Data on pathology test ordering by GPs were obtained from the Bettering the Evaluation and Care of Health (BEACH) program. BEACH is a continuous national cross-sectional study of GP activity, involving ever-changing random samples of about 1000 GPs per year. Each GP participant completes a questionnaire about themselves and their practice, and uses a structured encounter form to record details of 100 consecutive patient encounters. This produces information on about 100 000 GP–patient encounters each year. Ethics committees of the University of Sydney and the Australian Institute of Health and Welfare approved the BEACH study.
Details that participating GPs record on each encounter cover up to four specific problems managed, and how they were managed — including up to five pathology tests or batteries of tests ordered. The BEACH program classifies problems managed and pathology tests ordered12 according to the International Classification of Primary Care (ICPC-2);13 the problems and tests are also coded more specifically at the GP terminology level using ICPC-2 PLUS.14 In addition, pathology tests are mapped to the main pathology service groups in the Medicare Benefits Schedule (MBS). For this analysis, problems managed were analysed at the ICPC-2 chapter level.13 We sub-analysed pathology test data at two levels: by the eight MBS pathology service groups and, more specifically, by 19 pathology tests commonly ordered by GPs12 (Box 1).
We defined a practice as co-located with a PCC if it occupied the same premises as a PCC, either in a shared suite or in an immediately adjacent suite. As the BEACH program does not collect information about the proximity of practices to PCCs, this was determined by other means. From a publicly available list of all Department of Health and Ageing-approved PCCs and their locations,15 we identified all PCCs located within the metropolitan boundaries16 of Melbourne and Sydney. Between December 2008 and February 2009, we telephoned each of these PCCs and asked for the name and location of the nearest general practice. Hospital-based PCCs were dropped from further consideration. For PCCs associated with specialty medical practices, the standard query about location of the nearest general practice applied. The geographical distance between each PCC and its nearest general practice was then verified via online searches of addresses and by using Google Maps (http://maps.google.com.au/). Next, for all PCCs that shared a suite with or occupied a suite adjacent to a general practice, we obtained the year in which the co-location was established via a telephone call to the PCC staff and/or the general practice manager.
Standard error calculations incorporated the single-stage clustered study design according to Kish’s formula.17 We used the statistical software package SAS 9.1.3 (SAS Institute, Cary, NC, USA) for descriptive analyses and Stata 11.0 (Stata Corp, College Station, Tex, USA) for univariate and multivariate analyses.
Of the 321 400 total GP–patient encounters, 10% occurred in co-located practices, 59% were in Sydney, 35% were with female GPs, 39% were with GPs 55 years or older, and 36% were with GPs who were Fellows of the Royal Australian College of General Practitioners (Box 2).
GPs in co-located practices had higher rates of pathology test ordering than GPs in practices located apart from PCCs (40.3 v 37.0 tests per 100 encounters; P = 0.01) (Box 3). The difference stemmed from a higher probability of ordering one or more tests at encounters in co-located practices (16.8% v 15.5% of encounters; P < 0.01), not from larger numbers of tests when one or more tests were ordered in an encounter (mean of 2.4 tests in both groups; P = 0.35).
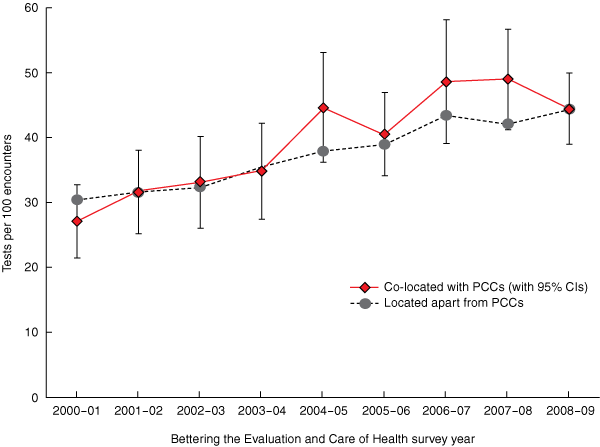
All of the other variables shown in Box 2 were either significantly associated (P < 0.05), or had one or more categories that were significantly associated, with both test-ordering rates and the likelihood of ordering one or more tests in encounters. Hence, all were included as covariates in the adjusted analyses. In addition, test-ordering rates increased sharply over the study period in both co-located practices and practices located apart from PCCs (Box 4), so dummy variables for each BEACH survey year were included in the adjusted analyses.
The significant association observed in unadjusted analyses between co-location and number of pathology tests ordered per encounter did not hold in an adjusted analysis (rate ratio [RR], 0.98; 95% CI, 0.93–1.05) (Box 5). However, several other GP and practice variables were significantly associated with test-ordering rates, after adjusting for patient characteristics, encounter characteristics and survey year. Test-ordering rates were higher in accredited practices (RR, 1.12; 95% CI, 1.07–1.18), practices with 5–9 and 10–14 GPs, among female GPs (RR, 1.12; 95% CI, 1.08–1.17) and among GPs who worked 11 or more sessions per week (RR, 1.09; 95% CI, 1.01–1.17). On the other hand, test-ordering rates were lower in Sydney than Melbourne (RR, 0.90; 95% CI, 0.86–0.94) and among GPs in age groups above 44 years relative to GPs younger than 35 years.
An analogous body of research is relevant. Many studies have shown that doctors’ contact with the pharmaceutical industry can influence their clinical decision making.18 Repeated visits by sales representatives,19-22 the availability of free drug samples,23,24 and relationships forged through conferences, educational events and consultancy arrangements25,26 have been linked to prescribing patterns. The hypothesised mechanism of action is, of course, the same as the pharmaceutical industry’s rationale for spending vast sums27 on marketing campaigns directed at doctors — namely, doctors who are regularly exposed to information, people, money and events associated with a particular product are more likely to incorporate that product into their clinical activities.
Our analysis found no evidence of such effects arising out of the close relationships between GPs and pathology companies in Australia. One possible explanation for this result is that, in Australia, pathology markets differ from pharmaceutical markets in important respects. Pathology companies sell a defined set of services; those services are relatively homogeneous from company to company; and prices are basically fixed and mostly paid by government (although this may be changing28). This combination of economic factors may make doctors’ demand for pathology services fairly inelastic; it may also force pathology companies to compete on the basis of socially desirable attributes such as test quality, reliability, speed and convenience. In sum, the nature of pathology markets, however aggressive, may not carry the same risks of supplier-induced demand that exist in markets for other health care products, such as pharmaceuticals.
The GP and practice characteristics found to be associated with test-ordering rates in this study largely echo those detected in earlier Australian research. A 1994 study of Medicare data found that rates of test ordering were higher among female GPs and varied according to year of graduation from medical school.29 Previous analyses of BEACH data showed higher rates of test ordering among female GPs and in larger practices, and lower rates among older GPs.30,31 To those recognised associations, our study adds practice accreditation and high workload (11 + sessions per week) as positive predictors; we also found that test-ordering rates were about 10% higher in Melbourne than in Sydney.
A strength of our study is that we used BEACH data, which have important advantages over Medicare data for measuring rates of pathology test ordering. Most notably, the federal government’s “coning” rule for reimbursement confines Medicare data to the three most expensive pathology items ordered in any GP–patient episode of care. The reliability and validity of the BEACH methods have been tested and described elsewhere.32
In summary, we found no evidence that co-location of general practices and PCCs affects GPs’ test-ordering behaviour. From a policy perspective, the result suggests that the convenience of PCC co-locations for patients, particularly patients who have ambulatory problems or lack access to transportation, is not gained at the expense of undue influences on pathology test-ordering behaviour. However, our findings do not close the book on questions about the structure of pathology services in Australia generally, or over-testing in particular. Several recent trends are noteworthy, namely: the spread of GP Super Clinics, portending further integration of primary care and diagnostic services;33 the discontinued agreement between the federal government, pathologists and pathology companies over caps on the growth of pathology services;34 the federal government’s loosening of PCC licensing rules;35 and the looming prospect of larger out-of-pocket pathology costs for patients.28 Together, these developments suggest that the need to better understand drivers of variation in test-ordering behaviour, and what constitutes cost-effective use of pathology services, is even more pressing today than it was when Deeble and Lewis-Hughes sounded the call two decades ago.5
1 Pathology service groups and test types used for sub-analyses of pathology test data
Pathology service groups in the Medicare Benefits Schedule
haematology
chemistry
microbiology
immunology
tissue pathology
cytology
infertility and pregnancy tests
simple basic tests
Pathology tests commonly ordered by general practitioners
full blood count
lipids
electrolytes, urea and creatinine
liver function
glucose and glucose tolerance
Pap smear
thyroid function
urine microscopy, culture and sensitivity
ferritin
other chemistry
erythrocyte sedimentation rate
coagulation
hormone assay
other microbiology
glycated haemoglobin
hepatitis serology
multibiochemical analysis
prostate specific antigen
vaginal swab microscopy, culture and sensitivity
3 Pathology test-ordering frequency during GP–patient encounters at general practices co-located with PCCs (n = 31 700) and general practices located apart from PCCs (n = 289 700), Melbourne and Sydney, 2000–2009
4 Pathology tests ordered per 100 GP–patient encounters, by survey year and co-location status of general practices*
 | |||||||||||||||
5 Rate ratios for general practice and GP characteristics in an adjusted model predicting pathology test-ordering rates*
GP = general practitioner. RACGP = Royal Australian College of General Practitioners. * Covariates in the model include patient and encounter variables shown in Box 2 and dummy variables for each Bettering the Evaluation and Care of Health survey year. |
|||||||||||||||
- David M Studdert1
- Helena C Britt2
- Ying Pan2
- Salma Fahridin2
- Clare F Bayram2
- Lyle C Gurrin1
- 1 Melbourne School of Population Health, University of Melbourne, Melbourne, VIC.
- 2 Family Medicine Research Centre, School of Public Health, University of Sydney, Sydney, NSW.
We thank Adrian Minson and April Mori for research assistance. Paul Monagle and Marie Pirotta helped conceive the study idea and provided valuable comments on an earlier draft of the manuscript. We also thank the GPs who participated in the BEACH program.
Helena Britt, Ying Pan, Salma Fahridin and Clare Bayram have conducted analysis of problems involving pathology testing on behalf of the Australian Association of Pathology Practices.
- 1. Medicare Australia. MBS group statistics reports. https://www.medicareaustralia.gov.au/statistics/mbs_group.shtml (accessed Mar 2010).
- 2. PricewaterhouseCoopers. International review of pathology funding arrangements: March 2010. http://www.hirc.health.gov.au/internet/main/publishing.nsf/Content/20CBB3 0C457BEB1DCA2576D300822677/$File/PwC_DoHAPathologyReview_180310_FINAL.pdf (accessed 2 Jun 2010).
- 3. Bayram C, Valenti L. GP pathology ordering. In: Britt H, Miller GC, editors. General practice in Australia, health priorities and policies 1998 to 2008. General practice series no. 24. Canberra: Australian Institute of Health and Welfare, 2009: 57-86. (AIHW Cat. No. GEP 24.) http://www.aihw.gov.au/publications/index.cfm/title/10721 (accessed Jun 2010).
- 4. KPMG. Review of the current arrangements for the regulation of approved (pathology) collection centres. Canberra: Department of Heath and Ageing, 2006. http://www.health.gov.au/internet/main/publishing.nsf/Content/health-pathology-leg-appaccs (accessed Mar 2010).
- 5. Deeble J, Lewis-Hughes P. Directions for pathology. National health strategy background paper no. 6. Canberra: Department of Health, Housing and Community Services, 1991.
- 6. Australian Government Department of Health and Ageing. Report of the review of Commonwealth legislation for pathology arrangements under Medicare. Final report, December 2002. http://pandora.nla.gov.au/pan/10941/20031108-0000/www.health.gov.au/haf/branch/dtb/review.pdf (accessed Jun 2010).
- 7. Phillips Fox. Review of the enforcement and offence provisions of the Health Insurance Act 1973 as they relate to the provision of pathology services under Medicare. 25 January, 2005. www.health.gov.au/internet/wcms/publishing.nsf/Content/health-pathology-leg-index.htm (accessed Mar 2010, link no longer available).
- 8. Medew J. Pathology rorts face new probe. The Age (Melbourne) 2008; 5 Apr. http://www.theage.com.au/news/national/pathology-rorts-face-new-probe/2008/04/04/120724 9461184.html (accessed Mar 2010).
- 9. Health Insurance Amendment (Inappropriate and Prohibited Practices and Other Measures) Act 2007 (Cwlth). No. 88, 2007.
- 10. Urban R. Probe into pathology kickbacks. The Australian 2010; 27 May.
- 11. Urban R. Showdown for pathology rivals in bribery case. The Australian 2010; 5 May.
- 12. Britt H, Miller GC, Charles J, et al. General practice activity in Australia 2008–09. Canberra: Australian Institute of Health and Welfare, 2009. (AIHW Cat. No. GEP 25.) http://www.aihw.gov.au/publications/index.cfm/title/11013 (accessed Mar 2010).
- 13. WONCA International Classification Committee. ICPC-2: international classification of primary care. 2nd ed. Oxford: Oxford University Press, 1998.
- 14. Britt H. A new coding tool for computerised clinical systems in primary care — ICPC plus. Aust Fam Physician 1997; 26 Suppl 2: S79-S82.
- 15. Medicare Australia. Approved collection centres. http://www.medicareaustralia.gov.au/apps/notesweb/acc.nsf/ACCPDFAttach/PDF/$File/ACCList.pdf?OpenElement (accessed Mar 2010).
- 16. Australian Bureau of Statistics. Australian standard geographical classification (ASGC), Jul 2009. Canberra: Commonwealth of Australia, 2009. (ABS Cat. No. 1216.0.) http://www.abs.gov.au/AUSSTATS/abs@.nsf/DetailsPage/1216.0Jul%202009?OpenDocument (accessed Mar 2010).
- 17. Kish L. Survey sampling. New York: John Wiley and Sons, 1965.
- 18. Wazana A. Physicians and the pharmaceutical industry. Is a gift ever just a gift? JAMA 2000; 283: 373-380.
- 19. Lurie N, Rich EC, Simpson DE, et al. Pharmaceutical representatives in academic medical centers. J Gen Intern Med 1990; 5: 240-243.
- 20. Caudill TS, Johnson MS, Rich EC, McKinney WP. Physicians, pharmaceutical sales representatives and the cost of prescribing. Arch Fam Med 1996; 5: 201-206.
- 21. Sondergaard J, Vach K, Kragstrup J, Andersen M. Impact of pharmaceutical representative visits on GPs’ drug preferences. Fam Pract 2009; 26: 204-209.
- 22. Vancelik S, Beyhun NE, Acemoglu H, Calikoglu O. Impact of pharmaceutical promotion on prescribing decisions of physicians in Eastern Turkey. BMC Public Health 2007; 7: 122.
- 23. Adair RF, Holmgren LR. Do drug samples influence resident prescribing behavior? A randomized trial. Am J Med 2005; 118: 881-884.
- 24. Peay MY, Peay ER. The role of commercial sources in the adoption of a new drug. Soc Sci Med 1988; 26: 1183-1189.
- 25. Orlowski JP, Wateska L. The effects of pharmaceutical firm enticements on physician prescribing patterns. Chest 1992; 102: 270-273.
- 26. Bowman MA, Pearle DL. Changes in drug prescribing patterns related to commercial company funding of continuing medical education. J Contin Educ Health Prof 1988; 8: 13-20.
- 27. Gagnon M, Lexchin J. The cost of pushing pills: a new estimate of pharmaceutical promotion expenditures in the United States. PLoS Med 2008; 5: e1. doi: 10.1371/journal.pmed.005 0001.
- 28. Creswell A. Pathology labs avoid bulk-billing. The Australian 2009; 29 Aug. http://www.theaustralian.com.au/news/pathology-labs-avoid-bulk-billing/story-e6frg6no-1225767255566 (accessed Mar 2010).
- 29. Taylor PT. Some fundamental influences on the pathology requesting behaviour of Victorian general practitioners — preliminary study results. Pathology 1994; 26: 33-35.
- 30. Britt H, Miller GC, McGeechan K, Sayer GP. Pathology ordering by general practitioners in Australia 1998. Canberra: Department of Health and Aged Care, 1999.
- 31. Britt H, Knox S, Miller GC. Changes in pathology ordering by GPs in Australia 1998–2001. Canberra: Australian Institute of Health and Welfare, 2003.
- 32. Britt H, Miller G, Bayram C. The quality of data on general practice — a discussion of BEACH reliability and validity. Aust Fam Physician 2007; 36: 36-40.
- 33. Australian Government Department of Health and Ageing. A national health and hospitals network for Australia’s future — delivering better health and better hospitals. http://www.yourhealth.gov.au/internet/yourhealth/publishing.nsf/content/home (accessed Mar 2010).
- 34. Ryan S. Razor gang targets pathology test costs. The Australian 2009; 6 Apr.
- 35. Australian Government Department of Health and Ageing. Health Budget 2009–2010. Increasing competition in pathology and diagnostic imaging. http://www.health.gov.au/internet/budget/publishing.nsf/Content/bud get2009-hmedia15.htm (accessed Mar 2010).
Abstract
Objective: To determine whether rates of pathology test ordering by general practitioners in general practices co-located with pathology collection centres (PCCs) are higher than those of GPs in practices located apart from PCCs.
Design, setting and participants: We identified all practices in the Melbourne and Sydney metropolitan areas that were co-located with PCCs (same or immediately adjacent suite) and the date co-location was established. This information was merged with the Bettering the Evaluation and Care of Health database to identify samples of GP–patient encounters in co-located practices (n = 31 700) and practices located apart from the nearest PCC (n = 289 700) over the period 2000–2009. Using Poisson regression analysis and logistic regression analysis, we compared GP test-ordering rates across the two types of practices, controlling for a range of potential confounders.
Main outcome measures: Numbers of tests ordered per encounter; likelihood of ordering one or more tests per encounter.
Results: In unadjusted analyses, GPs in co-located practices ordered more pathology tests than GPs in practices located apart from PCCs (40.3 v 37.0 tests per 100 encounters, P = 0.01) and had a higher likelihood of ordering one or more tests (16.8% v 15.5% of encounters, P < 0.01). After adjusting for other predictors of test ordering, however, neither test-ordering rate (rate ratio, 0.98; 95% CI, 0.93–1.05; P = 0.56) nor likelihood of ordering one or more tests per encounter (odds ratio, 1.01; 95% CI, 0.95–1.07; P = 0.79) differed significantly by co-location status. Sub-analyses within specific test groups and types showed few systematic differences.
Conclusions: Pathology test-ordering rates are not higher in practices co-located with PCCs. To the extent inappropriate commercial influences and relationships exist in the pathology sector, GPs’ test-ordering behaviour may be unaffected.