


Cardiovascular disease (CVD) is the leading cause of death and disability worldwide.1 In 2005, CVD was responsible for 35% of deaths in Australia and an estimated 1.4 million Australians (6.9% of the population) were living with a CVD-related disability.2 Ninety percent of Australian adults have at least one modifiable CVD risk factor and 25% have three or more modifiable risk factors.3 Because around 85% of Australians visit a general practitioner every year,4 primary care is the ideal setting for CVD prevention. The federal government has targeted CVD as a priority area in its proposed National Primary Health Care Strategy5 and has set specific performance benchmarks for the management of CVD risk and for the prevention of CVD.6 As vascular health checks in primary health care have been shown to be highly cost-effective, improving the performance of these checks could reduce the rising costs of acute hospital care.7,8
Despite evidence that CVD management and prevention should be based on an individual’s overall or absolute risk, there has been little analysis on how extensively this evidence is being implemented in primary health care. One qualitative study demonstrated that GPs do not routinely perform absolute CVD risk assessments.9 Barriers identified include lack of understanding of the difference between absolute and relative risk, poor understanding of how to use CVD risk tools in clinical management, and lack of incorporation of risk tools into practice software. Several recently published studies have revealed substantial gaps in CVD risk management.10-13 Potential barriers that have been identified include guidelines for single diseases and conflicts with the criteria for prescribing subsidised medications within the Pharmaceutical Benefits Scheme (PBS).
New guidelines for the assessment of absolute CVD risk were published by the National Vascular Disease Prevention Alliance (NVDPA) in March 2009.14 In this study, we sought to describe the distribution of CVD risk according to various guidelines, to ascertain GPs’ perceptions of their patients’ CVD risks and to determine the proportion of patients whose CVD risk is being managed according to current Australian evidence-based guidelines.
The Australian Hypertension and Absolute Risk Study (AusHEART) was a nationally representative, cluster-stratified, cross-sectional survey of CVD risk management practice in primary health care for patients aged 55 years or older. The study design is based on previously used methodology.15
GPs were recruited on the basis of interest in participating in the study. Two mail-outs to all 21 074 registered GPs in Australia were conducted during January and February 2008. GPs who expressed an interest in participating in the study were stratified according to location within each state and territory and whether their practice was in a rural or urban area, using a classification derived from national rural, remote and metropolitan area categories.16 We randomly selected interested GP investigators in a stratified manner to ensure that state and rural–urban splits reflected the distribution of the adult population according to 2004 census data. Characteristics of the selected GPs were compared with those who were not selected and with the Australian GP workforce for the 2007–08 financial year.17
Following data collection, estimation of absolute 5-year risk of a cardiovascular event was calculated centrally (by one of us [E L H], using available data) for each patient without established CVD, using the 1991 Framingham risk equations.18 This is based on age, sex, smoking status, BP, total and high-density lipoprotein cholesterol levels, diabetes and left ventricular hypertrophy to predict a first CVD event.
Adjustments to the Framingham risk calculation were made according to three guidelines — the National Heart Foundation (NHF) Hypertension management guide for doctors 200419 (the prevailing guideline at the time of data collection), the NHF Guide to management of hypertension 2008,20 and the NVDPA Guidelines for the assessment of absolute cardiovascular disease risk (published in 2009).14 The adjustment criteria are summarised in Box 1. The NVDPA 2009 guideline also states that the Framingham method is likely to underestimate absolute risk in certain patients (Aboriginal and Torres Strait Islander patients, patients with diabetes who are younger than 60 years and do not have microalbuminuria, overweight or obese patients, and patients aged 75 years or older), for whom clinical judgement is required. However, we did not make any further automatic adjustments to the Framingham method of calculating risk in response to the NVDPA suggestion of groups in whom risk might be underestimated.
Unadjusted and adjusted 5-year risks of a cardiovascular event were then classified into low (< 10%), moderate (10% to < 15%) and high (≥ 15%) categories, as specified in the NHF 2004,19 NHF 200820 and NVDPA 200914 guidelines. Patients with established CVD (defined as previous myocardial infarction, stroke, peripheral arterial disease, revascularisation, transient ischaemic attack or angina) were classified into a separate category.
Differences between data on participating GPs and data on the GP workforce17 were tested using the χ2 test. Sex differences were tested using the χ2 test for categorical variables and the independent t test for differences between means. Agreement between GP estimates of risk and centrally calculated estimates of risk was evaluated using κ statistics. Data entry and manipulations were carried out using SAS version 9.1 (SAS Institute, Cary, NC, USA). Statistical analyses were conducted using STATA version 9.2 (Stata Corporation, College Station, Tex, USA).
A total of 1416 GPs expressed interest in participating in the AusHEART study, of whom 534 were selected to participate. Of those selected, 322 GPs (60%) provided data for an average of 16 patients each; the remaining 212 did not contribute data or formally withdrew before contributing data. Characteristics of the actively participating GPs, compared with non-participating GPs and the Australian GP workforce, are shown in Box 2. When compared with the Australian GP workforce, the actively participating GPs were more likely to be older and located in a rural area.
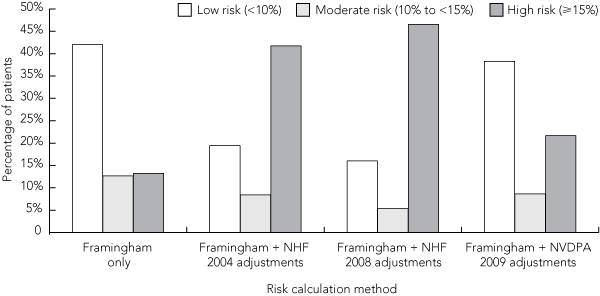
Data were obtained from 5293 patients whose sex was recorded and who were aged 55 or older, of whom 3462 (65%) consented to participate in the longitudinal follow-up component of the study. Their demographic and CVD risk factor details are summarised in Box 3. Box 4 shows the distribution of risk categories using Framingham-based risk estimates alone, as well as the distribution using adjustments from the three different Australian guidelines. Using the NHF 2004, NHF 2008 and NVDPA 2009 guideline adjustments, 2211 (42%), 2465 (47%) and 1145 (22%) patients, respectively, were classified as high risk. The NVDPA guideline did, however, state that risk might be underestimated in 793 of the 2026 low-risk patients (39%) and 241 of the 458 moderate-risk patients (53%). If these patients were all categorised as high risk, this would result in a similar risk distribution to that resulting from NHF 2004 adjustments.
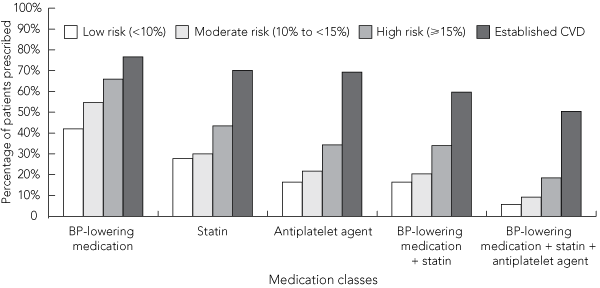
Box 5 shows prescribing patterns for major cardiovascular medication groups stratified by categories of risk estimated using NHF 2004 guideline adjustments. Of the 1548 patients with established CVD, 780 (50%) were prescribed a combination of a BP-lowering medication, a statin and an antiplatelet agent, and 143 (9%) were prescribed a BP-lowering medication and a statin without an antiplatelet agent. Using unadjusted Framingham risk estimates as well as estimates calculated using the NHF 2004, NHF 2008 and NVDPA 2009 guideline adjustments, 39%, 34%, 32% and 42%, respectively, of patients at high risk of a cardiovascular event in the next 5 years (but without established CVD) were prescribed a combination of a BP-lowering medication and a statin (with or without an antiplatelet agent). When applying the criteria for PBS statin subsidy for high-risk patients without established CVD (using NHF 2004 guideline adjustments), treatment would not be recommended to 1537 of 2211 patients (70%) despite being at high risk. An estimated 64% (429 of 674 patients) of high-risk patients eligible for a statin subsidy under the PBS were prescribed a statin.
Of the 1799 patients with and without CVD not prescribed at least one BP-lowering medication, treatment was indicated for 802 (45%), according to the NHF 2004 guidelines. Statin treatment was indicated for 892 (34%) of the 2597 patients not prescribed a statin, according to the 2005 NHF and Cardiac Society of Australia and New Zealand guidelines.21
The AusHEART study shows that large evidence–practice gaps exist in primary and secondary prevention of CVD for older Australians. Our findings are similar to those of our previous cross-sectional studies involving younger adults in mainstream and Indigenous health settings,10,13 and are consistent with recent findings by other investigators.11,12 The consistency of outcomes suggests that these gaps are entrenched in primary care.
The evidence–practice gaps found in this study are not only the domain of individual clinicians, they also relate to system failure. A stronger effort to rationalise the many guidelines for assessment and management of CVD risk factors is needed. The NVDPA guideline for CVD risk assessment and future plans for an accompanying management guideline are important advances in creating a standardised approach in primary health care. In addition, the NVDPA is aiming to raise awareness about CVD risk assessment in the general population by providing a simple online risk calculator.22 A departure from the many existing guidelines for individual diseases might also simplify management options. Harmonisation of guidelines with the PBS is a key accompanying step. The development of point-of-care decision support tools might be another way to increase the use of guidelines.23 Practice nurses and other non-GP care providers could also play a role in supporting CVD risk management.24
2 Characteristics of general practitioners in the AusHEART study compared with the Australian GP workforce
GPs who expressed an interest in participating |
|||||||||||||||
* Number of GPs for 2007–08 financial year, and data from the Australian Government Department of Health and Ageing.17 † P values represent χ2 test comparing actively participating GPs with Australian GP workforce; P values for age and state data represent tests for differences in distribution in age and state categories, respectively. ‡ Some GPs did not declare their age. § Includes practices in remote areas. ¶ Some GPs used more than one calculator. na = not available. |
|||||||||||||||
Received 9 April 2009, accepted 13 September 2009
- Emma L Heeley1
- David P Peiris1,2
- Anushka A Patel1
- Alan Cass1
- Andrew Weekes3
- Claire Morgan3
- Craig S Anderson1
- John P Chalmers1
- 1 The George Institute for International Health and the University of Sydney, Sydney, NSW.
- 2 Tharawal Aboriginal Corporation, Sydney, NSW.
- 3 Medical Department, Servier Australia, Melbourne, VIC.
We thank the 532 GP investigators who participated in the study. Those who submitted data for 15 or more patients were eligible for 40 Category 1 points for RACGP continuing professional development program. Dr Peter Arnold helped draft the manuscript. Data were collected and initially analysed by Statistical Revelations, Melbourne. We also thank Catherine Devlin for help with collating data and Ruth Webster for help with interpreting the guidelines.
The AusHEART study was conducted as a collaborative project between the George Institute for International Health and Servier Australia. Emma Heeley received a travel grant from Servier to present AusHEART findings at the European Stroke Conference. Anushka Patel has received speaker fees and travel assistance from Servier. Alan Cass has received an honorarium for speaking at a national education meeting sponsored by Servier. Andrew Weekes and Claire Morgan are employed by Servier Australia and collaborated with the George Institute investigators in the study design and review of the submitted article. Craig Anderson has received speaker fees and educational grants from Boehringer Ingelheim, Servier, Pfizer and Genzyme, and travel assistance to attend meetings from Sanofi-Aventis, Boehringer Ingelheim, Mayo Clinic and the Korean Stroke Society. John Chalmers has received research grants from Servier for the Perindopril Protection Against Recurrent Stroke Study (PROGRESS), the Action in Diabetes and Vascular Disease Preterax and Diamicron MR Controlled Evaluation (ADVANCE) and the AusHEART study, and has received lecture fees for speaking at scientific meetings from Servier.
- 1. Murray CJL, Lopez AD. The global burden of disease: a comprehensive assessment of mortality and disability from diseases, injuries, and risk factors in 1990 and projected to 2020. Boston: Harvard School of Public Health, 1996.
- 2. Australian Institute of Health and Welfare. Australia’s Health 2008. Canberra: AIHW, 2008. (AIHW Cat No. AUS 99.)
- 3. Australian Institute of Health and Welfare. Living dangerously: Australians with multiple risk factors for cardiovascular disease. Canberra: AIHW, 2005. (AIHW Cat. No. AUS 57.)
- 4. Knox SA, Harrison CM, Britt HC, et al. Estimating prevalence of common chronic morbidities in Australia. Med J Aust 2008; 189: 66-70. <MJA full text>
- 5. Australian Government Department of Health and Ageing. Towards a national primary health care strategy: a discussion paper from the Australian Government. Canberra: Commonwealth of Australia, 2008.
- 6. Australian Government Department of Health and Ageing. Divisions of General Practice Program: national performance indicators 2008–09. Canberra: DoHA, 2008. http://www.phcris.org.au/divisions/reporting/documents/techdetails/National_Performance_Indicator_Technical_Details_Dec08.pdf (accessed Mar 2009).
- 7. Department of Health, UK. Economic modelling for vascular checks. London: Department of Health, 2008.
- 8. Tonkin AM, Chen L. Where on the healthcare continuum should we invest? The case for primary care? Heart Lung Circ 2008; 18: 108-113.
- 9. Torley D, Zwar N, Comino EJ, Harris M. GPs’ views of absolute cardiovascular risk and its role in primary prevention. Aust Fam Phys 2005; 34: 503-504.
- 10. Peiris D, Patel A, Cass A, et al. Cardiovascular disease risk management for Aboriginal and Torres Strait Islander peoples in primary health care settings: findings from the Kanyini Audit. Med J Aust 2009; 191: 304-309. <MJA full text>
- 11. Chen L, Rogers SL, Colagiuri S, et al. How do the Australian guidelines for lipid-lowering drugs perform in practice? Cardiovascular disease risk in the AusDiab Study, 1999-2000. Med J Aust 2008; 189: 319-322. <MJA full text>
- 12. Reid C, Nelson MR, Shiel L, et al. Australians at risk: management of cardiovascular risk factors in the REACH Registry. Heart Lung Circ 2008; 17: 114-118.
- 13. Webster RJ, Heeley EL, Peiris DP, et al. Gaps in cardiovascular disease risk management in Australian general practice. Med J Aust 2009; 191: 324-329. <MJA full text>
- 14. National Vascular Disease Prevention Alliance. Guidelines for the assessment of absolute cardiovascular disease risk. National Heart Foundation of Australia, 2009.
- 15. Thomas MC, Weekes AJ, Broadley OJ, et al. The burden of chronic kidney disease in Australian patients with type 2 diabetes (the NEFRON study). Med J Aust 2006; 185: 140-144. <MJA full text>
- 16. Australian Government Department of Primary Industries and Energy. Rural, remote and metropolitan areas classification. 1991 census edition. Canberra: Commonwealth of Australia, 1994.
- 17. Australian Government Department of Health and Ageing. General practice statistics. Canberra: Commonwealth of Australia, 2008.
- 18. Anderson KM, Odell PM, Wilson PWF, et al. Cardiovascular disease risk profiles. Am Heart J 1991; 121: 293-298.
- 19. National Heart Foundation of Australia. Hypertension management guide for doctors 2004. NHFA, 2003.
- 20. National Heart Foundation of Australia (National Blood Pressure and Vascular Disease Advisory Committee). Guide to management of hypertension 2008. NHFA, 2008.
- 21. Tonkin A, Barter P, Best J, et al. National Heart Foundation of Australia and the Cardiac Society of Australia and New Zealand: position statement on lipid management — 2005. Heart Lung Circ 2005; 14: 275-291.
- 22. National Vascular Disease Prevention Alliance. Australian absolute cardiovascular disease risk calculator. http://www.cvdcheck.org.au/ (accessed Apr 2009).
- 23. Kawamoto K, Houlihan CA, Balas EA, et al. Improving clinical practice using clinical decision support systems: a systematic review of trials to identify features critical to success. BMJ 2005; 330: 765.
- 24. Halcomb EJ, Davidson PM, Griffiths R, et al. Cardiovascular disease management: time to advance the practice nurse role? Aust Health Rev 2008; 32: 44-53.
Abstract
Objective: To examine the perception and management of cardiovascular disease (CVD) risk in Australian primary care.
Design, setting and participants: The Australian Hypertension and Absolute Risk Study (AusHEART) was a nationally representative, cluster-stratified, cross-sectional survey of 322 general practitioners. Each GP was asked to collect data on CVD risk factors and their management in 15–20 consecutive patients aged ≥ 55 years who presented between April and June 2008, and to estimate each patient’s absolute risk of a cardiovascular event in the next 5 years.
Main outcome measures: Estimated 5-year risk of a cardiovascular event, proportion of patients receiving appropriate treatment.
Results: Among 5293 patients, 29% (1548) had established CVD. A further 22% (1145), when categorised according to the 2009 National Vascular Disease Prevention Alliance guideline, to 42% (2211), when categorised according to National Heart Foundation (NHF) 2004 guideline, had a high (≥ 15%) 5-year risk of a cardiovascular event. Of the 1548 patients with established CVD, 50% were prescribed a combination of a blood pressure (BP)-lowering medication, a statin and an antiplatelet agent, and 9% were prescribed a BP-lowering medication and a statin but not an antiplatelet agent. Among high-risk patients without established CVD, categorised using NHF 2004 adjustments, 34% were prescribed a combination of a BP-lowering medication and a statin. GPs estimated 60% of patients with established CVD as having a risk of less than 15%. The GPs’ estimates of risk among patients without established CVD agreed with the centrally calculated estimate (according to the NHF 2004 guideline) in 48% of instances (κ = 0.21).
Conclusions: These data confirm substantial undertreatment of patients who are at high risk of a cardiovascular event. We recommend that GPs assess absolute risk for older patients and ensure that high-risk patients receive evidence-based pharmacotherapy.