Nationally, Aboriginal Australians have a significantly lower life expectancy and a significantly higher morbidity than non-Aboriginal people.1 In the Northern Territory, reliable identification of Indigenous status in mortality and hospitalisation data has allowed detailed comparisons between Aboriginal and non-Aboriginal Australians, including trends analysis.
The conditions leading to higher mortality and morbidity in Aboriginal people — cardiovascular disease, diabetes and acute respiratory infections — have been identified.2 Trends analysis shows a shift from infectious diseases and respiratory conditions in 1981, to cardiovascular diseases and diabetes by 2000.3 These trends call for increased emphasis on primary care interventions for non-communicable diseases. However, to date, the extent to which such interventions can alleviate disparities in health status has not been reliably measured.
The concept of “avoidable hospitalisations” (also known as “ambulatory care-sensitive conditions”) provides a framework for measuring the proportion of morbidity that could be avoided by timely and effective care outside hospital. Classifying a hospital admission as avoidable does not imply that an individual patient’s admission was avoidable. Rather, it is a population measure based on specific admission diagnoses:4 avoidable hospitalisations involve a selected group of conditions for which hospitalisation could be avoided by preventive measures, or early diagnosis and treatment in primary care.5 The list of conditions for which hospitalisation is potentially avoidable has varied over time, and remains the subject of debate.5 Despite this, data on avoidable hospitalisations are increasingly used internationally as an indicator of access to primary care and its effectiveness,6,7 and as a measure of the potential health gains from primary care interventions.4,8 Within Australia, both the federal and most state health departments now routinely report avoidable hospitalisation rates.5,9,10
Previous research reveals that avoidable hospitalisation rates are higher in people living in remote areas,5 those of lower socioeconomic status,5,6,11 and in Aboriginal people and ethnic minorities.4,7 An inverse association between avoidable hospitalisations and self-reported access to primary care has also been demonstrated.6,12 Analysing avoidable hospitalisations may assist in priority setting for Aboriginal and Torres Strait Islander health,13 and avoidable hospitalisation rates have recently been included in national Aboriginal and Torres Strait Islander outcome reporting.14
Inpatient discharge data from NT public hospitals for the years 1998–99 to 2005–06 were used for the analysis. During this period, hospitalisation discharge data were coded using the International statistical classification of diseases and related health problems, 10th revision, Australian modification (ICD-10-AM).15 Avoidable hospitalisations were defined in accordance with the lists of conditions produced by the Public Health Information Development Unit at the University of Adelaide.5 NT population data were based on the Australian Bureau of Statistics 2001 census.16
Avoidable conditions were further classified into three categories:5
vaccine-preventable conditions, which include influenza and pneumonia;
chronic conditions, which comprise chronic disease complications that can be managed in primary care by effective drug therapy, patient education and lifestyle modification; they include diabetes complications, chronic obstructive pulmonary disease (COPD) and hypertension; and
acute conditions, for which hospitalisation could be avoided by early diagnosis and appropriate management by primary care practitioners.
Based on the Public Health Information Development Unit classification, the reported “principal diagnosis” and, where appropriate, “any diagnosis” were used in the analysis.5 An age limit was applied for influenza and pneumonia by excluding children under 2 months of age. Although some researchers also set upper age limits to account for difficulties of classification in people with multiple comorbidities, this approach was not adopted here. In the NT, renal dialysis is recorded as an inpatient episode, but this is not the case in all Australian jurisdictions; to ensure comparability of results, renal dialysis patients were excluded from this analysis.
Between 1998–99 and 2005–06, there were 52 144 avoidable hospitalisations in the NT. These comprised 15.6 % of total hospitalisations. Although Aboriginal people account for 28% of the NT population, they experienced 61% of avoidable hospitalisations. The avoidable hospitalisation rate in the NT Aboriginal population was 11 090 per 100 000 population, nearly four times higher than the previously reported Australian rate of 2848 per 100 000.5 The avoidable hospitalisation rate for non-Aboriginal people living in the NT was 2779 per 100 000.
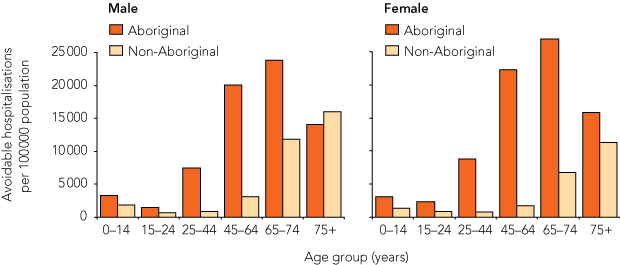
Although total average avoidable hospitalisation rates were higher in Aboriginal than non-Aboriginal people in the NT, the largest differences were observed in the age groups 25–44 and 45–64 years (Box 1).
As shown in Box 2, chronic diseases and their complications constitute the largest proportion of avoidable hospitalisations in all population groups, followed by acute conditions. The top five causes of avoidable hospitalisations for NT Aboriginal people, NT non-Aboriginal people, and the Australian population as a whole are in boxes in Box 2. The avoidable hospitalisation rates for the NT Aboriginal population exceeded the Australian rates for almost all conditions, and the rate ratio was highest for nutritional deficiencies (19.7), diabetes complications (6.8), and influenza and pneumonia (6.1). For most conditions, the rates for the NT non-Aboriginal population were similar to the Australian rates.
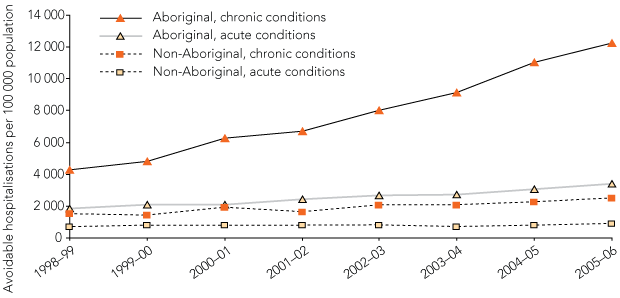
Avoidable hospitalisation rates in the NT Aboriginal population increased significantly during the study period, compared with a much smaller increase in the non-Aboriginal population. As shown in Box 3, most of the increases in avoidable hospitalisation rates were due to chronic conditions, particularly in Aboriginal people. Not shown in Box 3 are the rates for vaccine-preventable conditions, which decreased by a similar proportion (38%) in both populations. Hospitalisations for non-avoidable conditions increased slightly in both Aboriginal and non-Aboriginal people.
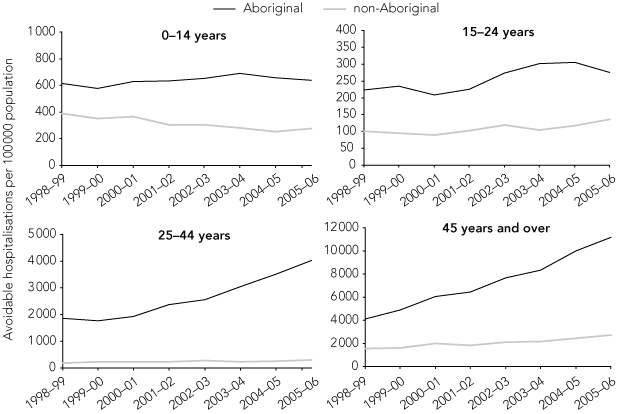
The increase in avoidable hospitalisation rates in the NT Aboriginal population over the study period was not evenly distributed across age groups and conditions. There was little increase for those 0–24 years, but a steady increase for the age group 25–44 years and a dramatic increase for those 45 years and over. The avoidable hospitalisation rates in non-Aboriginal people in the NT remained steady for all age groups, except for a modest increase for those 45 years and over (Box 4).
The results also highlight the dynamic nature of health indices among the NT Aboriginal population. The increasing rates of avoidable hospitalisations have occurred during a period of increases in resources and a focus on chronic disease management in primary care services, but positive results have been modified by increases in the underlying prevalence, incidence and severity of chronic diseases in the NT Aboriginal population.17-20 Primary care interventions and associated resources need to be geared for current and future needs, not planned on past measurement.
General practitioners are in short supply in the NT, and visits to GPs occur half as often as the national average.21,22 Data on use of GP services by NT Aboriginal people are limited; provisional estimates from Medicare usage suggest significantly lower rates for Aboriginal than non-Aboriginal people.23 However, increasing the number of GPs may not be all that is needed. In the United States an inverse relationship was found between the supply of primary care physicians and avoidable hospitalisation rates,24 whereas in Canada socioeconomically disadvantaged people had higher rates of both avoidable hospitalisations and utilisation of primary care physicians, independent of supply.11 This may reflect differences in health care systems, but it also supports the suggestion that the aspects of primary care best able to sustainably reduce avoidable morbidity depend on the causal mechanisms underlying care-seeking behaviour and clinical decision making in particular contexts.24,25
Just as the factors determining access to primary health care are multifactorial and context-dependent, the antecedents of hospitalisation are also complex. Hospitalisation rates for specific conditions depend on age, sex, underlying disease prevalence and severity, socioeconomic status, geographical remoteness, GP behaviour (eg, GPs may be more likely to admit people to hospital who live in remote areas or are of low socioeconomic status), continuity of care,26 and the availability of social supports facilitating home care. In some contexts, high rates of avoidable hospitalisations may reflect not only a failing in the primary care system, but also the hospital system’s ability to respond to high needs.27 The consequent inability of avoidable hospitalisation rates and trends to identify the causes of the disparity in rates between Aboriginal and non-Aboriginal people, or suggest targeted solutions, is a limitation of this technique.5
A further limitation is that the conditions currently classified as avoidable do not take into account population differences. For example, we found that Aboriginal people in the NT have high rates of avoidable hospitalisations for convulsions and epilepsy. In many populations, convulsions are amenable to primary care interventions (eg, early diagnosis and the provision of anti-epilepsy medications); in the NT Aboriginal population, admissions for convulsions may be related to alcohol and substance misuse and thus more sensitive to population-based health strategies. This may have led to an overestimation of avoidable hospitalisations, as we have defined them, in Aboriginal people. To overcome this, a New Zealand study included a new category of hospitalisations preventable by population health strategies, an approach consistent with publications on avoidable mortality.4 These conditions include those caused by smoking, alcohol and motor vehicle accidents, and may be a further indicator of potential health gains.
Despite these limitations, avoidable hospitalisations remain an important indicator of effective and timely access to primary care and a summary measure of potential health gains from primary care interventions. Although not able to prescribe corrective action, avoidable hospitalisation rates highlight broad gaps in service provision. Further, the increases in avoidable hospitalisation rates for some chronic conditions over time (eg, diabetes), as compared with relatively stable rates for other conditions (eg, COPD), suggest that primary health care interventions implemented during the study period have had variable effectiveness. This warrants evaluations of why this may be the case, but caution must be exercised when setting benchmarks against which to gauge the impact of services in an environment of varying trends in disease-specific morbidity. Assessing avoidable hospitalisation rates, which are readily available from hospital discharge data, overcomes the difficulty of measuring and comparing outcomes of primary health care programs.5 The technique should therefore also be seen as an opportunity to quantify the effectiveness of future primary care strategies and, in time, the effectiveness of population-based health strategies.
1 Average avoidable hospitalisation rates by age, sex and Aboriginality, Northern Territory, 1998–99 to 2005–06

2 Avoidable hospitalisations and age-adjusted rates per 100 000 population by condition and Aboriginality, Northern Territory and Australia,4 1998–99 to 2005–06*
- Shu Q Li1
- Natalie J Gray2
- Steve L Guthridge3
- Sabine L M Pircher4
- Health Gains Planning Branch, Northern Territory Department of Health and Families, Darwin, NT.
None identified.
- 1. Australian Bureau of Statistics and Australian Institute of Health and Welfare. The health and welfare of Australia’s Aboriginal and Torres Strait Islander peoples 2005. Canberra: ABS, AIHW, 2005. (ABS Cat. No. 4704.0.)
- 2. Zhao Y, Guthridge S, Magnus A, Vos T. Burden of disease and injury in Aboriginal and non-Aboriginal populations in the Northern Territory. Med J Aust 2004; 180: 498-502. <MJA full text>
- 3. Zhao Y, Dempsey K. Causes of inequality in life expectancy between Indigenous and non-Indigenous people in the Northern Territory, 1981–2000: a decomposition analysis. Med J Aust 2006; 184: 490-494. <MJA full text>
- 4. Jackson G, Tobias M. Potentially avoidable hospitalisations in New Zealand, 1989–1998. Aust N Z J Public Health 2001; 25: 212-221.
- 5. Page A, Ambrose S, Glover J, Hetzel D. Atlas of avoidable hospitalisations in Australia: ambulatory care sensitive conditions, 2007. Adelaide: Public Health Information Development Unit, University of Adelaide, 2007. http://www.publichealth.gov.au/pdf/atlases/avoid_hosp_aust_2007/avoid_hosp_full.pdf (accessed Mar 2009).
- 6. Ansari Z, Laditka JN, Laditka SB. Access to health care and hospitalisation for ambulatory care sensitive conditions. Med Care Res Rev 2006; 63: 719-741.
- 7. Niti M, Ng TP. Avoidable hospitalisation rates in Singapore, 1991–1998: assessing trends and inequities of quality in primary care. J Epidemiol Community Health 2003; 57: 17-22.
- 8. Sheerin I, Allen G, Henare M, Craig K. Avoidable hospitalisations: potential for primary and public health initiatives in Canterbury, New Zealand. N Z Med J 2006; 119 (1236): U2029.
- 9. Public Health Information Development Unit. Population health profile of the NSW Central West Division of General Practice: supplement. Population Profile Series: No. 27a. Adelaide: PHIDU, 2007.
- 10. Public Health Information Development Unit. Population health profile of the West Vic Division of General Practice: supplement. Population Profile Series: No. 65a. Adelaide: PHIDU, 2007.
- 11. Roos LL, Walld R, Uhanova J, Bond R. Physician visits, hospitalisations and socioeconomic status: ambulatory care sensitive conditions in a Canadian setting. Health Serv Res 2005; 40: 1167-1185.
- 12. Bindman AB, Grumbach K, Osmond D, et al. Preventable hospitalizations and access to health care. JAMA 1995; 274: 305-311.
- 13. Stamp K, Duckett SJ, Fisher DA. Hospital use for potentially preventable conditions in Aboriginal and Torres Strait Islander and other Australian populations. Aust N Z J Public Health 1998; 22: 673-678.
- 14. Australian Institute of Health and Welfare. Aboriginal and Torres Strait Islander health performance framework, 2008 report: detailed analyses. Canberra: AIHW, 2008. (AIHW Cat. No. IHW 22.) http://www.aihw.gov.au/publications/ihw/aatsihpf08r-da/aatsihpf08r-da.pdf (accessed Mar 2009).
- 15. National Centre for Classification in Health. International statistical classification of diseases and related health problems, 10th revision (ICD-10-AM). Sydney: NCCH, University of Sydney.
- 16. Australian Bureau of Statistics. Census of population and housing: selected social and housing characteristics for Statistical Local Areas, Northern Territory. Canberra: ABS, 2001. (ABS Cat. No. 2015.7.)
- 17. Wilson T, Condon JR, Barnes T. Northern Territory Indigenous life expectancy improvements, 1967–2004. Aust N Z J Public Health 2007; 31: 184-188.
- 18. Thomas DP, Condon JR, Anderson IP, et al. Long-term trends in Indigenous deaths from chronic diseases in the Northern Territory: a foot on the brake, a foot on the accelerator. Med J Aust 2006; 185: 145-149. <MJA full text>
- 19. You JQ, Condon J, Zhao Y, Guthridge S. Incidence and survival analysis for acute myocardial infarctions in the Northern Territory, 1992–2004. Med J Aust 2009; 190: 298-302. <MJA full text>
- 20. Zhao Y, Connors C, Wright J, et al. Estimating chronic disease prevalence among the remote Aboriginal population of the Northern Territory using multiple data sources. Aust N Z J Public Health 2008; 32: 307-313.
- 21. Britt H, Miller GC, Knox S, et al. General practice activity in the states and territories of Australia 1998–2003. General Practice Series No. 15. Canberra: Australian Institute of Health and Welfare, 2004. (AIHW Cat. No. GEP 15.)
- 22. Britt H, Miller GC, Knox S, et al. General practice activity in Australia 2003–04. General Practice Series No. 16. Canberra: Australian Institute of Health and Welfare, 2004. (AIHW Cat. No. GEP 16.)
- 23. Byron P, Zhao Y, Guthridge SL, et al. Medicare and Pharmaceutical Benefits Scheme usage patterns in the Northern Territory, 1993/94 to 2003/04. Darwin: Department of Health and Community Services, 2005.
- 24. Laditka JN, Laditka SB, Probst JC. More may be better: evidence of a negative relationship between physician supply and hospitalisation for ambulatory care sensitive conditions. Health Serv Res 2005; 40: 1148-1166.
- 25. Bailie RS, Robinson G, Kondalsamy-Chennakesavan S, et al. Investigating the sustainability of outcomes in a chronic disease treatment programme. Soc Sci Med 2006; 63: 1661-1670.
- 26. Menec VH, Sirski M, Attawar D, et al. Does continuity of care with a family physician reduce hospitalisations among older adults? J Health Serv Res Policy 2006; 11: 196-201.
- 27. Australian Institute of Health and Welfare. Indicators for chronic diseases and their determinants 2008. Canberra: Australian Institute of Health and Welfare, 2008. (AIHW Cat. No. PHE 75.)


Abstract
Objectives: To analyse rates of avoidable hospitalisations in Aboriginal and non-Aboriginal residents of the Northern Territory, 1998–99 to 2005–06, and to consider the implications for primary care interventions.
Design and setting: Retrospective descriptive analysis of inpatient discharge data from NT public hospitals.
Main outcome measures: Avoidable hospitalisations by age, sex, Aboriginality and condition, with annual time trends.
Results: Between 1998–99 and 2005–06, Aboriginal people in the NT had an avoidable hospitalisation rate of 11 090 per 100 000 population, nearly four times higher than the Australian rate of 2848 per 100 000. The rate for non-Aboriginal NT residents was 2779 per 100 000. During this period, the average annual increase in avoidable hospitalisations was 11.6% (95% CI, 11.0%–12.1%) in the NT Aboriginal population and 3.9% (95% CI, 3.3%–4.5%) in the non-Aboriginal population. The greatest increase occurred in those aged ≥ 45 years, and was primarily attributable to diabetes complications.
Conclusions: The significantly higher rates of avoidable hospitalisations in NT Aboriginal people reflect the emerging epidemic of chronic disease in this population, highlight barriers to Aboriginal people accessing effective primary care, and emphasise the extent of potential health gains with appropriate interventions.