


Here, we argue that these post-illness factors should be the focus of biomarker research in neuropsychiatry. These biomarkers may be particularly informative about ongoing pathophysiology that causes secondary progressive illness and may be amenable to therapeutic intervention. For patients with schizophrenia and other psychotic disorders, such biomarkers are likely to include measures of cognitive or perceptual dysfunction and other measures of disconnected neural circuits and dysregulated glucocorticoid, neuroimmune or circadian systems (Box 1). We describe the conceptual development of a biomarker index (the Brain and Mind Research Institute [BMRI] Biomarker Index) for prediction of disability associated with schizophrenia and other psychotic disorders (Box 2).
The staging system4 for the major psychiatric disorders provides a novel clinical framework for the evaluation of biomarker utility. This system proposes a developmental perspective best described as a “trunk-and-branch” model. It postulates that the early stages of schizophrenia, psychotic depression and bipolar disorder present with a generic phenotype, dominated by non-specific features (including depression, irritability, odd thoughts, inattention, cognitive impairment, circadian rhythm disturbance, social withdrawal, anxiety and periodic agitation).
record the current degree of perturbation in key neurobiological systems, assuming that such markers can be used over time as direct or proxy measures of treatment response;
predict the extent of likely response to specific or non-specific interventions (ie, guide treatment selection); or
predict progression to more distinct illness types (eg, schizophrenia or bipolar disorder).
Although pathophysiological processes are not yet well defined for the major psychoses, it is clear that the onset period is correlated with the critical late phase of synaptic pruning, particularly within the frontal lobes (see Bennett in this supplement).5 Recent brain imaging studies indicate active brain changes during this period of illness (see Wood and colleagues in this supplement6).7 As in other areas of child and adolescent development, abnormal processes are best defined by trajectories (ie, altered patterns of measurement over time), rather than single-point measurements. Additionally, the integration of several indirect measures may be more revealing than single indices.
One particularly important issue is whether we can expect to detect greater biological variance between individuals with similar clinical phenotypes in earlier illness stages. The variance in the biomarker might then relate to the differences in disease trajectories (ie, disease prognosis, irrespective of the diagnosis at the time). The critical issue is whether any such measurements (eg, regional brain atrophy on structural magnetic resonance imaging [MRI],8 decreased smell differentiation,9 or increased uptake of positron emission tomography ligands [eg, peripheral benzodiazepine receptor (PBR) or PK-11195],10 indicative of microglial activation secondary to local or distant neuronal disconnection) reflect more severe or longstanding pathophysiological processes.
Of greatest clinical importance is the potential role of biomarkers in guiding treatment selection. For example, reduced plasma levels of BDNF may indicate the need to use medications (eg, antidepressants or second-generation antipsychotics) that have been demonstrated to increase these levels.11 Similarly, circadian markers of delayed sleep-phase syndromes may be used to guide behavioural and pharmacological interventions to correct these phenomena. Peripheral blood markers of immune activation may indicate the need for immunomodulatory therapies. Again, the main research goal here is to demonstrate that changes in such measures through active interventions correlate with short-term clinical response and/or non-progression to later phases of illness.
The principal purpose of biomarkers in later illness phases is the accurate measurement of persistent pathophysiological mechanisms. At the individual level, we propose that such measures can function as direct or proxy measures of treatment response. At these later stages, individuals are more likely to have phenotypes (“branches”) that can more reasonably be described as schizophrenia, bipolar disorder or psychotic depression. Consequently, some of the relevant measures may be linked more tightly with the evolved clinical phenotypes. At this later stage, circadian, glucocorticoid and neuroinflammatory measures may be more relevant to individuals with bipolar disorder or severe depression,12,13 whereas measures of ongoing cognitive deterioration or global or regional brain atrophy might be more relevant to those with schizophrenia and persistent delusional disorders.6
Many of the most useful tests in medicine (blood glucose, blood pressure, blood lipids and lipoproteins, fever, and inflammatory markers) are not informative of exact aetiology. Instead, they reliably describe the current state of the pathogenic mechanism that is causing current functional impairment or disease progression. It is arguably more useful to have biomarkers that reflect such dose–effect variations in the consequences of illness than those that aid diagnostic classification. We propose that another area of biomarker research that should be prioritised is that of biological stress markers, similar to those used in other multifactorial medical conditions. In this scenario, the psychotic episode is a stressor initiating or promoting illness pathways that result in all-cause morbidity and premature mortality.14-16
The BMRI Biomarker Index (Box 2) incorporates biological indicators of stress and general health. The choice of biomarkers in our cumulative index is solely dictated by their prognostic power related to impeding and evolving disability risk. This change in research priority (ie, away from diagnostic specificity) acknowledges two major objections to biomarker development, namely irrelevance to the patient and the risk of misuse.17 Such considerations are already evident to those who have pursued markers of genetic risk or heritability.
Biomarker research using proteomic and transcriptomic profiling of diseases (eg, leukaemia,18 inflammatory bowel disease,19 and psychiatric illness20,21) indicates that extensive phenotyping and covariation with gene or gene-product clusters can yield valuable information (eg, special gene subsets for certain disease forms). In psychiatry, however, it is uncertain whether the tenuous associations between genotype and phenotype22-28 actually lend themselves to such a broad profiling approach. Further, there remains the issue as to whether endophenotypes should be seen as illness states below the threshold level of clinical detectability. As explanatory, quasidiagnostic entities, they convey a perception of fixed pre-established risk at the expense of more analytical monitoring of changing risk in individuals over time.
Thus far, MRI-based measures have mostly reported group comparisons, rather than providing data about variation between individuals. Statistical parametric approaches have dominated analyses, and frequently report statistical variance patterns (ie, activation of specific brain regions) that essentially reflect prior assumptions of the psychological test paradigm or the diagnostic group definition.29,30 Such functional studies are prone to circularity and selective reporting.31 Although recent attempts to link the functional MRI signal with event-related electroencephalogram data may represent an advance, the approach is still conceptually bound to brain “localisationist” theories.32-34
Microglia, as the main constituent of the brain’s innate immune system, respond to a wide range of signals when brain tissue is undergoing active change (during brain development or in response to illness later in life). Microglia can become activated by alterations in neuronal activity, neurotransmission or changes in broader cellular (ie, astroglial and neuronal) crosstalk.35 Microglia follow some of the brain’s peculiar organisational principles; that is, they reflect the brain’s regional variation in cellular composition and functional specialisation, and show constitutive variations in their functional state, depending on the region in which they are located.36,37
Such regional variation may be linked to the well known regional selective vulnerability of the brain, whereby certain brain areas and neuronal subpopulations are selectively vulnerable to untargeted biological stressors.38,39 Whether the net effect of microglial activation is harm, protection or mere surveillance of the affected brain tissue appears to depend on the overall “ecological” balance of many competing or synergistic signalling and effector pathways.40-42
As proposed earlier, the stress of psychotic illnesses that leads to decline in general health is also likely to impact negatively on brain structure and function. In turn, such prolonged perturbations may maintain microglia in a persistently reactive state. Mild forms of such activation are unlikely to be detected by relatively insensitive histopathological and neuroanatomical techniques. Many of the currently available data on microglial activation, and related illness behaviour, are based on observations in severe or acute neurological disease states, and cannot easily be extrapolated to chronically evolving conditions, such as schizophrenia and related psychoses. However, there is now mounting evidence that microglia are highly active in the healthy brain, and appear to be modulated via regulatory mechanisms, such as steroid hormones, that are typically involved in biological stress conditions.43-45
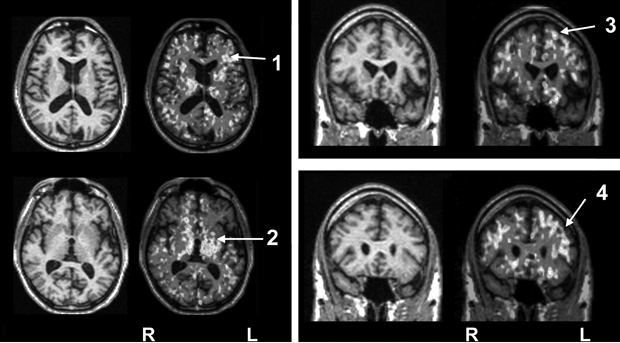
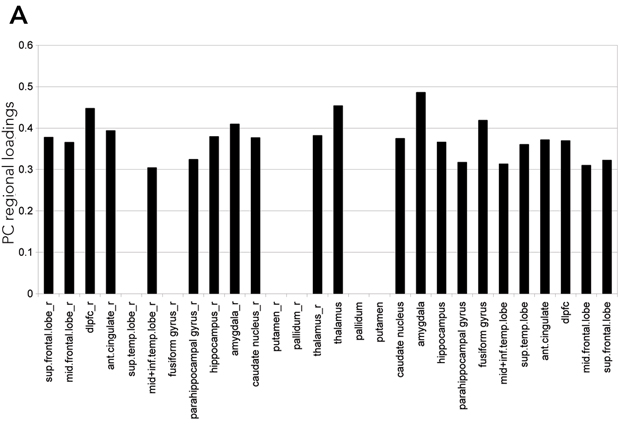
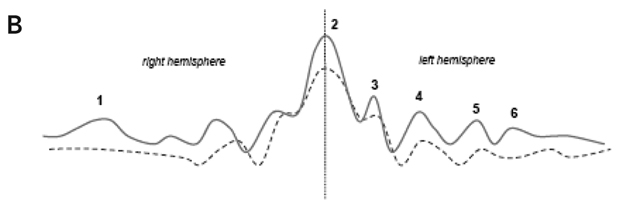
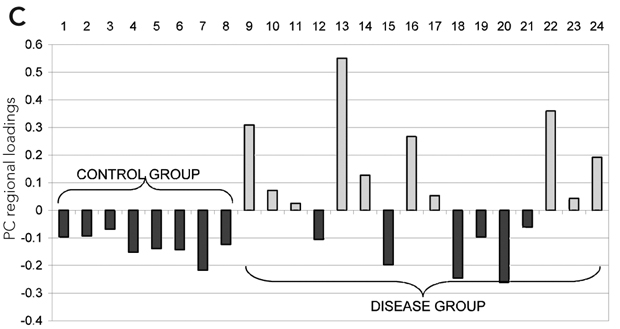
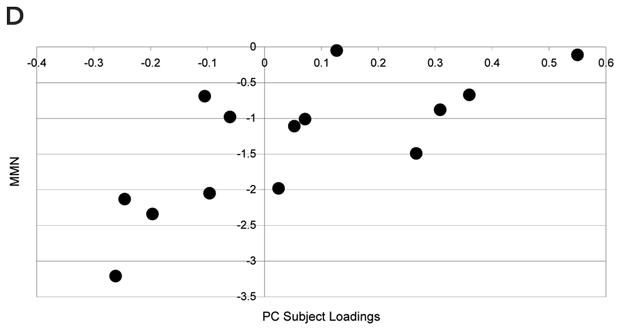
As discussed above, illness severity and prognosis can be based on biological measures that are not diagnostically specific. In this context, disease-induced microglial activation, which has been well established, can serve as a generic marker that relates more directly to disease progression.10,46-50 Preliminary studies in patients with schizophrenia suggest that microglial activation is present (Box 3) and may be correlated with other meaningful illness measures, such as (event-related potential derived) mismatch negativity.
The development of biomarkers in neuropsychiatry has been hampered, not only by limited technologies, but also by an undue emphasis on promoting diagnostically specific markers or pseudo-diagnostic markers (eg, endophenotypes). These approaches have ignored longstanding questions about the construct validity of the major diagnostic entities in psychiatry,51,52 and have not translated into better health outcomes for patients or their families. By contrast, there has been a lack of attention to potential markers of ongoing contributory risks, disease progression or treatment selection. In our view, the combination of new clinical staging paradigms, new technologies and the utilisation of multiple markers of ill health can now set the stage for a far more productive period of biomarker research.
1 Properties of biomarkers that would be of clinical use in schizophrenia and other psychotic disorders
Diagnostically non-specific. Biomarkers should not be assumed to be specific only to schizophrenia as defined by the Diagnostic and statistical manual of mental disorders, 4th edition or the International classification of diseases, 10th revision. The same marker may be a useful biological predictor of health status in other psychoses, bipolar disorder, severe depression or other neuropsychiatric disorders.
Quantitative. Variables that relate directly to the functioning of the person with schizophrenia, including continuous measures of cognition, sleep–wake cycle and other circadian phenomena, metabolism, cardiovascular function or immunological function.
Longitudinal. Simple cross-sectional measures are typically less informative than measures that vary over time — presumably in association with state of illness or during critical periods of brain development over time (eg, higher-order cognitive functions during late adolescence).
Plausibly linked to underlying pathophysiology. Biomarkers reflect organicity; that is, they relate to active brain changes in association with changes in illness status (eg, decrements in regional brain volumes or evidence of microglial activation) or changes in the central nervous system secondary to other disturbances, such as subtle changes in metabolic or nutritional homeostasis.
Predictive of risk of impairment. That is, each measure adds significantly to a general model that explains individual increases in disability. Although current risk factors are each of low predictive value, if each is tapping a different aspect of pathophysiology, together they will help to explain the variance in outcome or response to treatments between individuals with similar clinical phenotypes.
2 The Brain and Mind Research Institute (BMRI) Biomarker Index: cumulative and longitudinal risks for assessing psychotic disorders
- Richard Banati1,2
- Ian B Hickie1
- 1 Brain and Mind Research Institute, University of Sydney, Sydney, NSW.
- 2 ANSTO, Sydney, NSW.
None identified.
- 1. Waddington JL. Neuroimaging and other neurobiological indices in schizophrenia: relationship to measurement of functional outcome. Br J Psychiatry Suppl 2007; 50: s52-s57.
- 2. Potvin S, Stip E, Sepehry AA, et al. Inflammatory cytokine alterations in schizophrenia: a systematic quantitative review. Biol Psychiatry 2008; 63: 801-808.
- 3. Muller N, Riedel M, Ackenheil M, Schwarz MJ. The role of immune function in schizophrenia: an overview. Eur Arch Psychiatry Clin Neurosci 1999; 249 Suppl 4: 62-68.
- 4. McGorry PD, Hickie IB, Yung AR, et al. Clinical staging of psychiatric disorders: a heuristic framework for choosing earlier, safer and more effective interventions. Aust N Z J Psychiatry 2006; 40: 616-622.
- 5. Bennett MR. Synapse formation and regression in the cortex during adolescence and in schizophrenia. Med J Aust 2009; 190 (4 Suppl): S14-S17. <MJA full text>
- 6. Wood SJ, Pantelis C, Yung AR, et al. Brain changes during the onset of schizophrenia: implications for neurodevelopmental theories. Med J Aust 2009; 190 (4 Suppl): S10-S13. <MJA full text>
- 7. Pantelis C, Velakoulis D, McGorry PD, et al. Neuroanatomical abnormalities before and after onset of psychosis: a cross-sectional and longitudinal MRI comparison. Lancet 2003; 361: 281-288.
- 8. Hickie I, Naismith S, Ward PB, et al. Reduced hippocampal volumes and memory loss in patients with early- and late-onset depression. Br J Psychiatry 2005; 186: 197-202.
- 9. Brewer WJ, Pantelis C, Anderson V, et al. Stability of olfactory identification deficits in neuroleptic-naive patients with first-episode psychosis. Am J Psychiatry 2001; 158: 107-115.
- 10. Banati RB. Visualising microglial activation in vivo. Glia 2002; 40: 206-217.
- 11. Duman RS, Monteggia LM. A neurotrophic model for stress-related mood disorders. Biol Psychiatry 2006; 59: 1116-1127.
- 12. Hickie I, Hickie C, Lloyd A, et al. Impaired in vivo immune responses in patients with melancholia. Br J Psychiatry 1993; 162: 651-657.
- 13. Hickie IB, Naismith SL, Ward PB, et al. Serotonin transporter gene status predicts caudate nucleus but not amygdala or hippocampal volumes in older persons with major depression. J Affect Dis 2007; 98: 137-142.
- 14. McGrath J. Hypothesis: is low prenatal vitamin D a risk-modifying factor for schizophrenia? Schizophr Res 1999; 40: 173-177.
- 15. McGrath J, Eyles D, Mowry B, et al. Low maternal vitamin D as a risk factor for schizophrenia: a pilot study using banked sera. Schizophr Res 2003; 63: 73-78.
- 16. McGrath J, Saha S, Welham J, et al. A systematic review of the incidence of schizophrenia: the distribution of rates and the influence of sex, urbanicity, migrant status and methodology. BMC Med 2004; 2: 13.
- 17. Lakhan SE. Schizophrenia proteomics: biomarkers on the path to laboratory medicine? Diagn Pathol 2006; 1: 1.
- 18. Song JH, Kim H-J, Lee CH, et al. Identification of gene expression signatures for molecular classification in human leukemia cells. Int J Oncol 2006; 29: 57-64.
- 19. Silverberg MS, Satsangi J, Ahmad T, et al. Toward an integrated clinical, molecular and serological classification of inflammatory bowel disease: report of a Working Party of the 2005 Montreal World Congress of Gastroenterology. Can J Gastroenterol 2005; 19 Suppl A: 5-36.
- 20. Craddock RM, Huang JT, Jackson E, et al. Increased alpha-defensins as a blood marker for schizophrenia susceptibility. Mol Cell Proteomics 2008; 7: 1204-1213.
- 21. Huang JTJ, Leweke FM, Oxley D, et al. Disease biomarkers in cerebrospinal fluid of patients with first-onset psychosis. PLoS Med 2006; 3: e428.
- 22. Gottesman II, Gould TD. The endophenotype concept in psychiatry: etymology and strategic intentions. Am J Psychiatry 2003; 160: 636-645.
- 23. Berrettini WH. Genetic bases for endophenotypes in psychiatric disorders. Dialogues Clin Neurosci 2005; 7: 95-101.
- 24. Bowden NA, Weidenhofer J, Scott RJ, et al. Preliminary investigation of gene expression profiles in peripheral blood lymphocytes in schizophrenia. Schizophr Res 2006; 82: 175-183.
- 25. Cardno AG, Rijsdijk FV, Sham PC, et al. A twin study of genetic relationships between psychotic symptoms. Am J Psychiatry 2002; 159: 539-545.
- 26. McDonald C, Bullmore ET, Sham PC, et al. Association of genetic risks for schizophrenia and bipolar disorder with specific and generic brain structural endophenotypes. Arch Gen Psychiatry 2004; 61: 974-984.
- 27. Craddock N, O’Donovan MC, Owen MJ. Genes for schizophrenia and bipolar disorder? Implications for psychiatric nosology. Schizophr Bull 2006; 32: 9-16.
- 28. Murray RM, Sham P, Van Os J, et al. A developmental model for similarities and dissimilarities between schizophrenia and bipolar disorder. Schizophr Res 2004; 71: 405-416.
- 29. Turkheimer FE, Aston JAD, Cunningham VJ. On the logic of hypothesis testing in functional imaging. Eur J Nucl Med Mol Imaging 2004; 31: 725-732.
- 30. Jernigan TL, Gamst AC, Fennema-Notestine C, Ostergaard AL. More “mapping” in brain mapping: statistical comparison of effects. Hum Brain Mapp 2003; 19: 90-95.
- 31. Neumann J, Lohmann G, Derrfuss J, von Cramon DY. Meta-analysis of functional imaging data using replicator dynamics. Hum Brain Mapp 2005; 25: 165-173.
- 32. Uttal WR. The new phrenology: the limits of localizing cognitive processes in the brain. Cambridge, Mass: MIT Press, 2001.
- 33. Van Orden GC, Pennington BF, Stone GO. What do double dissociations prove? Cogn Sci 2001; 25: 111-172.
- 34. Donaldson DI. Parsing brain activity with fMRI and mixed designs: what kind of a state is neuroimaging in? Trends Neurosci 2004; 27: 442-444.
- 35. Bennett MR. Development of the concept of mind. Aust N Z J Psychiatry 2007; 41: 943-956.
- 36. de Haas AH, Boddeke HW, Biber K. Region-specific expression of immunoregulatory proteins on microglia in the healthy CNS. Glia 2008; 56: 888-894.
- 37. Mittelbronn M, Dietz K, Schluesener HJ, Meyermann R. Local distribution of microglia in the normal adult human central nervous system differs by up to one order of magnitude. Acta Neuropathol 2001; 101: 249-255.
- 38. Ji KA, Eu MY, Kang SH, et al. Differential neutrophil infiltration contributes to regional differences in brain inflammation in the substantia nigra pars compacta and cortex. Glia 2008; 56: 1039-1047.
- 39. Kanaan NM, Kordower JH, Collier TJ. Age and region-specific responses of microglia, but not astrocytes, suggest a role in selective vulnerability of dopamine neurons after 1-methyl-4-phenyl-1,2,3,6-tetrahydropyridine exposure in monkeys. Glia 2008; 56: 1199-1214.
- 40. Banati RB, Gehrmann J, Schubert P, Kreutzberg GW. Cytotoxicity of microglia. Glia 1993; 7: 111-118.
- 41. Banati RB, Graeber MB. Surveillance, intervention and cytotoxicity: is there a protective role of microglia? Dev Neurosci 1994; 16: 114-127.
- 42. Raivich G, Banati R. Brain microglia and blood-derived macrophages: molecular profiles and functional roles in multiple sclerosis and animal models of autoimmune demyelinating disease. Brain Res Brain Res Rev 2004; 46: 261-281.
- 43. Jellinck PH, Kaufmann M, Gottfried-Blackmore A, et al. Selective conversion by microglia of dehydroepiandrosterone to 5-androstenediol-A steroid with inherent estrogenic properties. J Steroid Biochem Mol Biol 2007; 107: 156-162.
- 44. Nimmerjahn A, Kirchhoff F, Helmchen F. Resting microglial cells are highly dynamic surveillants of brain parenchyma in vivo. Science 2005; 308: 1314-1318.
- 45. Sierra A, Gottfried-Blackmore A, Milner TA, et al. Steroid hormone receptor expression and function in microglia. Glia 2008; 56: 659-674.
- 46. Cagnin A, Brooks DJ, Kennedy AM, et al. In-vivo measurement of activated microglia in dementia. Lancet 2001; 358: 461-467. Erratum in: Lancet 2001; 358: 766.
- 47. Cagnin A, Myers R, Gunn RN, et al. In vivo visualization of activated glia by [11C] (R)-PK11195-PET following herpes encephalitis reveals projected neuronal damage beyond the primary focal lesion. Brain 2001; 124: 2014-2027.
- 48. Cagnin A, Rossor M, Sampson EL, et al. In vivo detection of microglial activation in frontotemporal dementia. Ann Neurol 2004; 56: 894-897.
- 49. Banati RB. Brain plasticity and microglia: is transsynaptic glial activation in the thalamus after limb denervation linked to cortical plasticity and central sensitisation? J Physiol Paris 2002; 96: 289-299.
- 50. Banati RB. Neuropathological imaging: in vivo detection of glial activation as a measure of disease and adaptive change in the brain. Br Med Bull 2003; 65: 121-131.
- 51. Hickie C, Hickie I, Silove D, et al. Delayed-type hypersensitivity skin testing: normal values in the Australian population. Int J Immunopharmacol 1995; 17: 629-634.
- 52. Bumke O. The dissolution of dementia praecox. Hist Psychiatry 1993; 4: 129-139. [Translation of: Die auflösung der dementia praecox. Klin Wochenschr 1932; 3: 437-440.]
Abstract
We propose that various measures of brain structure or function, gene expression and proteomic technologies can be used to guide better treatment of schizophrenia and other psychotic disorders.
These measures are not used to establish a specific diagnosis. Their purpose is to predict variations in underlying illness activity that predict severity, course of clinical illness, or other morbidity.
We propose a new instrument that uses a composite scoring system of systemic biomarkers of illness-related changes in health status: the Brain and Mind Research Institute Biomarker Index. This may permit comparison of biological dysfunction among patients who are at similar points in their illness or have similar clinical features.
A specific example of the use of a novel positron emission tomography marker of progressive brain disease in patients with schizophrenia is described.